-
Paper Information
- Previous Paper
- Paper Submission
-
Journal Information
- About This Journal
- Editorial Board
- Current Issue
- Archive
- Author Guidelines
- Contact Us
International Journal of Ecosystem
2012; 2(2): 5-18
doi: 10.5923/j.ije.20120202.02
Planktonic Communities and Trophic Interactions in the Kavaratti Waters, Lakshadweep Archipelago, India
 Abstract
 Reference
 Full-Text PDF
 Full-Text HTML
Robin R. S 1, Pradipta R. Muduli 2, K. Vishnu Vardhan 2, A. Nagarjuna 3, T. Nallathambi 4, Rajani K. Mishra 5, T. Balasubramanian 1
1Centre of Advanced Study in Marine Biology, Faculty of Marine Sciences,Annamalai University, Parangipettai ,608 502, India
2Department of Inorganic and Analytical Chemistry, Andhra University, Visakhapatnam, 530013, India
3Department of Zoology, Sri Venkateswara University, Tirupati, 517 502, India
4Vessel Management Cell, National Institute of Ocean Technology, Chennai, 600100, India
5NCAOR, Ministry of Earth Sciences, Government of India, Headland sada, Goa,India
Correspondence to: Robin R. S , Centre of Advanced Study in Marine Biology, Faculty of Marine Sciences,Annamalai University, Parangipettai ,608 502, India.
| Email: |  |
Copyright © 2012 Scientific & Academic Publishing. All Rights Reserved.
The complex relationships among marine planktonic trophic levels are not yet well understood, despite the importance of the plankton community in the global carbon cycle and its role as a food source for commercial fisheries. In this study, phytoplankton and zooplankton samples were collected and identified from the oligotrophic Kavaratti waters. Within the phytoplankton community, siliceous diatoms and dinoflagellates responded differently with environmental variations. Differential responses by different trophic interactions were also found with both phyto- and zooplankton communities. Low abundance of microzooplankton and along with the concomitant occurrence of low mesozooplankton in the Lakshadweep suggests that there could be a general lack of planktonic grazers. This would result in a weak transfer of primary and bacterial carbon to higher trophic levels, eventually leaving behind much unconsumed basic food in the stations like light house and helipad. Tracking changes in planktonic biodiversity and their trophic interactions over time will help for the assessment of potential fisheries. The study provides baseline information on the productivity, pigment concentration and plankton community structure and their trophic state with respect to marine food web, which could give new insight to the future ecological assessment of Kavaratti waters.
Keywords: Arabian Sea, Lakshadweep Islands, Kavaratti Lagoon, Planktonic Food Web, Tropic Status, Species Diversity
Article Outline
1. Introduction
- Coral reefs are the most productive environments with diverse habitats[1,2], but reports show that reefs are declining in many areas around the world due to stress that tends to threaten their survival[3,4]. Major oceanic reefs in Arabian Sea are confined to Lakshadweep groups of Islands. Oceanic Islands generally represent a multi-tiered ecosystem typically comprised of wetland habitats such as corals, seagrasses, seaweeds, mangroves and sand-dune vegetation. These wetland habitats from Lakshadweep, being unique and rich in biodiversity and productivity, are of great ecological and socio-economic importance besides protecting coastal terrestrial ecosystems from the ravages of the sea[5]. While much scientific research in the Lakshadweep has addressed the physical limitations on various taxonomic or functional groups in the marine ecosystem, there has been less focus on the interactions of multiple trophic levels in the complete ecological food web. In order to monitor the healthy state of the entire marine system, it will be important to maintain a record of the species diversity that currently exists which will begin to assess changes over time. While general classifications of primary productivity in the Lakshadweep waters exist, specific records of community composition will give information about the taxonomic groups most affected by the global climate changes. If biodiversity is monitored at different trophic levels over time, a greater understanding of the vulnerabilities and potential trophic changes of ocean ecosystems may be realized. Phytoplankton contributes about 95% of total production in the marine environment. The rate of gross primary productivity is important for assessing the fisheries yield i.e., how much can be harvested on a sustainable basis. Hence the abundance of phytoplankton can be taken as the best means for quantitative assessment of potential fisheries of an area. Furthermore, some phytoplankton can be taken as good indicators of water pollution [6]. Plankton population can be affected by pollution leading to drastic changes in the food chain in the marine environment[7]. Zooplankton plays an important role in the marine food chain as an intermediate link between transfers of energy from primary to tertiary level. Some fishes are exclusively zooplankton feeders and therefore, their abundance is directly linked to the presence of zooplankton. The rate of zooplankton production can be used to estimate the exploitable fish stock[8].During the last decades, our perception of the marine food webs has changed since the microbial loop and herbivorous web are not usually the important pathways of carbon transfer, but the more complex microbial and multivorous webs are present in aquatic environments[9,10]. Oligotrophic environments dominated by microbial food webs, most of the nutrients necessary to sustain primary production are recycled through grazing of protozoa on picoplankton[11]. In this case, a major fraction of biogenic carbon may be lost to multiple trophic transfers and remineralized within the euphotic zone. Nevertheless, there is increasing evidence that microbial food webs may play a significant role in carbon export since microzooplankton can act as a significant link between small producers and large consumers[12]. Heterotrophic nanoflagellates and small ciliates are significant grazers of pico- and nano-algae[13,14] and they may affect the size structure of bacterial assemblage[15,16].Nutrient limitation of reef productivity has been studied frequently with focus on explanations of how highly productive reef ecosystems can thrive in nutrient deserts[17] reef waters are the cradle grounds for phytoplankton growth. Nitrogen and phosphorous commonly referred as limiting nutrients[18], support the growth of phytoplankton to establish a suitable pelagic food web[19,20]. Besides the availability of nutrients, the physical variables such as salinity and turbidity also largely influence the distribution and abundance of plankton communities[21-23]. Hence, the coral reefs are always considered as biologically active zones[2]. Different types of trophic relationship between the phyto and zooplankton have been established in various marine systems[24,25]. In the last decade, a lot of efforts have been made to understand the capabilities of heterotrophic bacterioplankton in the processing of organic carbon in aquatic systems. In the open ocean, most of the dissolved organic carbon (DOC) for bacterioplankton is from phytoplankton [26]. Knowledge of primary productivity (PP) and bacterial abundance is a prerequisite to understand the transformation and mineralization of organic matter as the balance between these variables determines the trophic status of the system.Marine ecosystems of the Lakshadweep Islands are unique and known to have a very high degree of biodiversity and a number of endemic flora and fauna. Coral reef of these Islands is known to have the richest biodiversity in the entire Indian sub-continent. During the past few decades, there has been the rapid anthropogenic development in these Islands, which has resulted in the degradation of coral colonies on the reef flats as well as in the lagoon, leading to a notable decline in their biodiversity via food web destructions. However, because of their vulnerability to anthropogenic and natural destruction, they have been considered "Marine Critical Habitats" and hence are of global concern. These coastal habitats have also been categorized as "Ecologically Sensitive Regions" under the Coastal Regulation Zone (CRZ - I) Act. Numerous specific works have been carried out in the Lakshadweep waters, plankton diversity and distribution[27, 28], primary and secondary productivity, chlorophyll and phaeopigmnets[30]. Zooplankton composition and abundance of Kavaratti were also studied[31-33]. In the present investigation we examine the influence of environmental changes on tropic state interactions at Kavaratti atoll.
2. Materials and Methods
2.1. Study Area
- The Lakshadweep archipelago located in the Arabian Sea comprise a group of 11 inhabited Islands, 17 uninhabited Islands, 6 submerged sand banks and 3 coral reefs environments situated between 8 - 12°N latitude and 71°45 -73°45 E longitude. Kavaratti, a perfect atoll of the Lakashadweep archipelago located along latitude 10°33’ N and longitude 72°36’E. The lagoon of the atoll is oriented in north to south direction, with the Island on the east and coral reef on the west (Figure 1). It is approximately 4,500 m long and 1200 m wide with an average depth of 2 m.
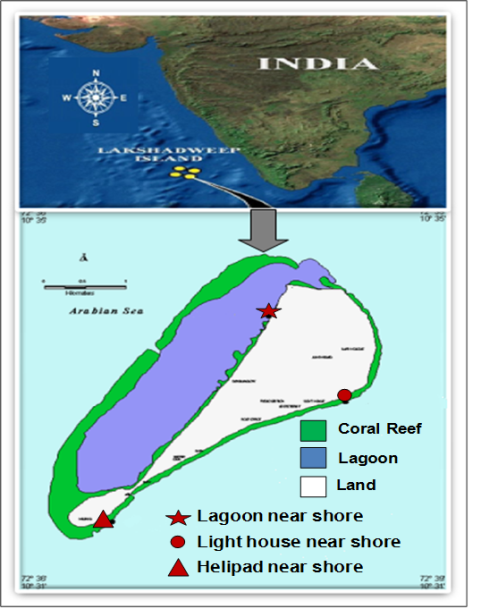 | Figure 1. Sampling locations at Kavaratti Island, Lakshadweep Sea |
2.2. Sampling
- To assess the ecological status of the aquatic environment around the Islands, water and biological samples were collected for studying the physic-chemical, biological and microbial characteristics. Three near shore stations were selected: lagoon, lighthouse and helipad (Figure1). The water samples collected using Niskin bottles (Hydrobios 5 L) were kept in the icebox and brought to the laboratory.For the collection of algae, oblique hauls for 5 minutes with nets having mesh size of 20µm were carried out and the samples were fixed with Lugol’s iodine solution and 4% formalin. Zooplankton was collected with a net (mesh size 80 µm) having a diameter of 0.6 m, towed horizontally just below the surface for a duration of 10 min (speed of the boat 1 knot). The net was fitted with a calibrated flow meter (General Oceanics, Model-2030) to quantify the volume of water filtered. Samples were collected in 250ml plastic bottles and preserved in 4% buffered formaldehyde. The keys employed include the works of many researchers[34-37]. For microbial analysis water samples were collected from all the stations in sterilized glassware and plated within one hour of collection. Specimens of marine macrophytes, including seaweeds, and seagrasses, were collected and preserved in 5% formalin as well as in the form of herbaria for further taxonomic identifications. The preserved specimens were identified using standard literature[38-40]. Quantitative data, such as percentages, frequency of occurrence, biomass of seaweeds and seagrasses were collected using 1 m2 quadrant technique [41].
2.3. Physico-Chemical Parameters
- In situ temperature was recorded using a thermometer (1–51℃ range within ± 0.1℃; Brannan, UK). Salinity was measured by argentometric titration and nutrients were estimated following Grasshoff et al.[42]. Samples for pH were collected in 100 ml glass bottles, poisoned with 100 µl of saturated mercuric chloride and sealed air-tight and measured using a ROSS combination glass electrode (ORION 8102U) by pH meter (ORION 555A). Analytical precision for pH of samples was ± 0.005. All carboys, filtering devices, glassware and tubing’s were acid-washed (10% HCl) and rinsed thrice with deionize water prior to use. They were then rinsed twice with their own volume of sample, capped and stored in the dark at 4℃ until analysis. Analyses for nutrients (NO2, NO3-, PO43- and NH4+, inorganic Silicate, total nitrogen, total phosphorous) were done within 6 h of collection, following filtration through 0.45 μ filters into acid rinsed and deionized water cleaned containers. Concentrations were determined by following standard methods[42].
2.4. Pigment Extraction (Chlorophyll-a)
- For pigment extraction, 1 L water samples were filtered through Whatman GF/F glass fibre filters, which were then immersed in 10 ml 90% acetone and allowed to extract in darkness at 20℃ for approximately 24 h. After extraction, the samples were vortexed. The samples were then centrifuged and absorbance of the supernatant was measured before and after acidification using a Perkin Elmer spectrophotometer[43].
2.5. Plankton Identification
- For qualitative studies of phytoplankton (>5 μm), 1000 ml of seawater samples were drawn from the depths mentioned above, fixed in 1% lugol's iodine and preserved in 3% formalin solution. The samples were stored in the dark at low temperature until counting and identification within a period of one month after collection. A settling and siphoning procedure was followed to obtain 20-25 ml concentrates. One ml of this concentrated sample was examined microscopically under a stereoscope binocular inverted microscope (magnification 100×) in a Sedgewick–Rafter counting chamber. Chain-forming cells were counted on a per cell basis and empty cells were excluded. The phytoplankton groups were identified to species level. Taxonomic criteria and diagnosis for phytoplankton identification mainly relied on methodology by UNESCO andSanthanam et al.[44,45].
2.6. Primary Productivity (PP)
- Primary production (PP) was measured by the radiocarbon [46,47]. Subsurface samples were collected using Niskinsampler and transferred to 300 ml polycarbonate bottles (Nalgene, Germany). Each bottle was spiked with 1 ml of NaH14CO3 (5 μCi ml −1, Board of Radioisotope Technology, Department of Atomic Energy, India) and the bottles were incubated in situ with the help of a mooring system. Three light bottles and one dark bottle were used at each depth. The incubation lasted from 1 h before sunrise to 30 min after sunset; the samples were retrieved and filtered through GF/F filters under gentle suction. The filters were exposed to concentrated HCl fumes to remove excess inorganic carbon and transferred to scintillation vials for subsequent estimation. A day before analysis, 5 ml of liquid scintillation cocktail (Sisco Research Laboratory, Mumbai) was added to the vials and the activity counted in a scintillation counter (Wallace 1409 DSA, Perkin-Elmer, USA). The disintegration per minute (DPM) was converted into daily production rates (mg C m−3 d−1) taking into account the initial activity in the bottles and the initial adsorption of 14C by particles in the bottles[48]. Surface PP was expressed as mg C m-3 d-1.
2.7. Enumeration of Total Heterotrophic Bacteria (THB)
- For microbial analysis water samples were collected from all the stations in sterilized glassware and plated within one hours of collection. The enumeration of total heterotrophic bacteria (THB) were made using the pour plate method on sterile Zobell Marine Agar medium (2216, HiMedia, Mumbai) with suitable dilutions. After inoculation, the plates were incubated in an inverted position for 72 hr at 28±1℃. Bacterial colonies developed on Zobell marine agar after the incubation periods were counted and their density was expressed as Colony Forming Unit (CFU) per ml.
3. Statistical Analysis
3.1. Community Indices
- Diversity is a concise expression of how individuals of a community are distributed in subsets of groups. Diversity decreases when one or a few groups dominate in a community, when individuals of a more common group replace individuals of a rare group or when one or a few groups rapidly reproduce. To analyze mathematically and compare changes in aquatic communities due to environmental influence, species diversity can be used as one of the tools. Diversity indices (d, H’, J’) were estimated on species abundance data implemented in PRIMER
3.1.1. Shannon and Weaver Species Diversity Index
- H’ = -∑ [Pi (log2Pi)]Pi = ni/n (proportion of the sample belonging to the ith species).
3.1.2. Margalefs Species Richness Index
- d’ = (S - 1)/loge NWhere S is the number of species and N is the total number of individuals of all the species in the sample.
3.1.3. Pielou’s Evenness
- J=H’/loge SThe statistical package SPSS 17 was employed to compute the simple correlation matrix to determine the similarity between water quality variables.
4. Results and Discussion
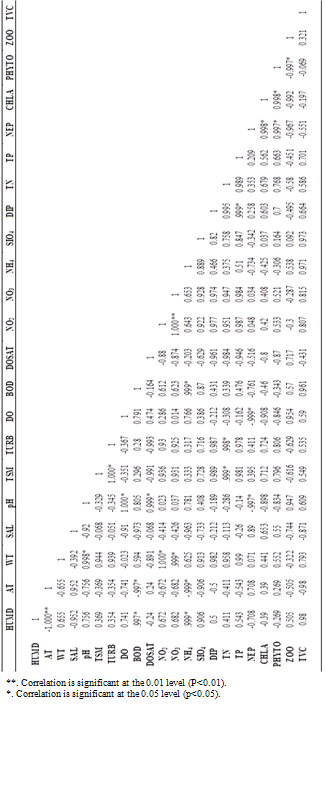
4.1. HydrographicCharacteristics
- The variations in hydrographic characteristics at Kavaratti waters are presented in Figure 2(a-g). A correlation matrix is produced to investigate the relationship among the water quality variables (Table 1). Kavaratti Island had a warm humid climate, 30.2℃ air temperature and humidity 74%. The surface-water temperatures in the non-coral reef area i.e., light house and helipad which was slightly lower as compared to lagoon, which may be attributed to the greater depths and the high-energy zone compared to the shallow and low-energy region in the lagoon. Coral reefs thrive at a water temperature ranging from 17 to 34℃, with the most optimum growth occurring between 25 and 29℃[49]. Mayer et al.[50] reported physiological stress in a number of corals at a temperature between 31.8 and 36.4oC and death at a temperature exceeding 35.8oC. Neudecker et al.[51] showed that corals suffer from sub lethal effects, such as expulsion of zooxanthellae (bleaching) and reduced growth rates at 3-4℃ and near total mortality at 4-6℃, above the ambient temperature. In the present study, the temperature ranged from 24.5 to 33.0℃, below the maximal level i.e., 36.4℃[50]. The relatively high (8.8) pH values in the lagoon compared to other station (8.12-8.23) might be due to elevated photosynthetic processes by benthic macro flora such as seagrasses and seaweeds influencing the biogeochemical processes of these waters. Higher pH in lagoon water would help in the precipitation of calcium carbonate which in turn would help in the formation of interstitial lime paste, most useful for the coral development[52]. The salinity values ranging from 34.9 to 35.26 did not vary much in the lagoon and the non-reef station (light house and helipad). Total suspended solids (TSS) and turbidity recorded in lagoon waters were 9.12 mg L-1 and 3.26 NTU respectively. Turbidity could play the role in limiting coral distribution. Increased turbidity on the reef flat reduces light availability for photosynthesis[53]. The suspended load has two major effects: blockage of light, and smothering of organisms by deposition of sediments and plugging of cavities (e.g., caves, tunnels, and crevices) in reefs[54]. Fairly saturated dissolved oxygen (~6 mg L-1) was recorded in all the stations. Among the studied stations slightly elevated values were recorded in lagoon which could be also be attributed to photosynthetic processes by marine algae and seagrasses likeThalassiahemprichii. The degree of oxygen saturation (~85%) did not show any significant variation among stations. Lower values of biochemical oxygen demand (BOD) (0.42 –1.16 mg L-1), were recorded in Kavaratii waters which indicates that the region is not receiving any significant organic discharges.
 | Figure 2. (a, b, c, d) Spatial variation of hydrographic characteristics at Kavaratti waters |
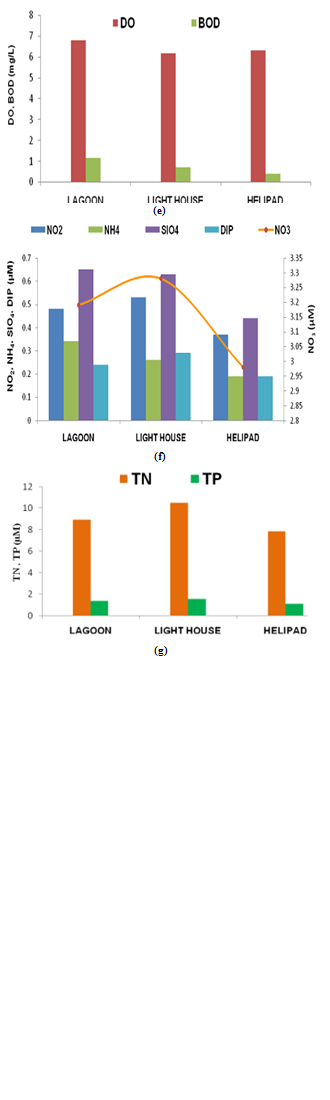 | Figure 2. (e, f, g) Spatial variation of hydrographic characteristics at Kavaratti waters |
4.2. Pigment Concentration
- Among the stations, Lagoon nearshore recorded the maximum chlorophyll a concentration (0.86 mg m-3) and Helipad nearshore recorded the minimum (0.58 mg m-3). These concentrations are slightly higher than those reported by Jeffrey et al.[58]. Variations of chlorophylla concentration at different stations are illustrated in Figure3 a. Further statistical analysis shows a positive correlation between chlorophyll a with phytoplankton standing crop and nutrient concentration (Table 1). The maximum concentration coincides with the peak value of phytoplankton standing crop supported by similar studies by Devassy et al.[59] and Sarupriya et al.[60].
4.3. Primary Production
- Among the stations surface water production ranged from 1.32 g C m-3 d-1 at helipad near shore to 2.58 g C m-3 d-1 at the lagoon near shore. Variations in primary productivity at different stations were illustrated in Figure 3 b. In the marine medium, pelagic primary production is attributed to phytoplankton. The consumers inhabiting the system utilize the organic matter synthesized by primary producers. Measurement of primary production is thus, essential for the estimation of fish production and exploitable fisheries. The primary productivity being the first link in the ecosystem may also indirectly indicate the relative fertility of the water body. The low chlorophyll concentration with less nutrient concentration was used to predict the trophic state of Kavaratti waters. Chlorophyll a is used as a good indicator of phytoplankton dominance and its value in the lagoon less than 2.5 mg m-3 can be termed oligotrophic[61]. In present findings the pigment concentration was found below 1.0 mg m-3. Higher concentration of dissolved oxygen and oxygen saturation percentage (~85%) observed for the nearshore waters suggest that may be due to the photosynthetic process by seagrass and seaweeds. The macroalgae dominated are Ulvafaciata and Hypneavalentiae and seagrasses (Cymodocearotunata, C.serrulat, Halophylaovata and Thalassiahemprichii). Similarly oxygen enriched waters with low phytoplankton count and the productivity associated with the abundance of submerged flora was well established around Minicoy Island. The rate of primary productivity in Kavaratti atoll was comparable to those obtained by Qasim et al.[29] and Kaladharan et al.[62] in Kavaratti and Amini atolls respectively. Among the stations net primary productivity rate of Thalassia bed (lagoon) alone was observed to be self-supporting since the production exceeded consumption and the result was concomitant with that of Wafar et al[29].High Primary production rates of seagrass beds were sufficient to sustain the respiratory oxygen requirement in the lagoon. In Kavaratti atoll any change or destruction of existing seagrass bed may leads heterotrophic.
|
 | Figure 3. Spatial variation of (a) pigment concentration (b) Primary Productivity (c) Phytoplankton density at Kavaratti waters |
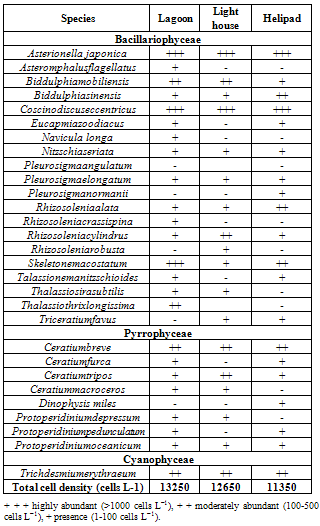
4.5. Algal Composition
- Phytoplankton distribution revealed occurrence of 29 species belonging to 3 taxonomic groups. Of these taxa, 1 species belonged to Cyanophyceae (1genus and 1species), 49 Bacillariophyceae (14 genara, 20 species), 8 Pyrrophyceae (Dinophyceae), (3genara, 8 species) were recorded (Table 2). Among the class Bacillariophyceae, centrales were predominant (12 centrales to 8 pennales). The species number at each station was in the order helipad < light house < lagoon (Table 3). The dominant species represented by Bacillariophyceae was followed by Dinophyceae and Cynophycae. Representatives of Bacillariophyceae were found gradually decreasing in the order of Helipad < Light house < Lagoon (Figure5a). Among the genera, richest in terms of species was Rhizosoleniasp. (4 species out of total 29 species), Chaetocerossp. (7 species out of 67 species), Bacteriastrum sp. (4 species out of 67 species); Ceratiumsp. (4 species out of 29 species) and Protoperidinium sp. (3 species out of 29 species). The species composition of phytoplankton may be used as a measure of the community’s stage of development, history and nature of fertility of coastal waters. Maximum standing crop was found at the lagoon with density of 13250 cells L–1 and minimum of 11350 cells L–1 at helipad near shore station. The maximum density at the lagoon could be attributed to the increased salinity, optimum pH, temperature and light condition. Asterionella japonica, Cosinodiscuseccentricus, Skelitonemmacoastatum were the most dominant throughout the stations, and the biomass increased in lagoon waters. Trichodesmiumerythraeum was the only one representative of class Cyanophyceae and its percentage composition was in the increasing order of
|
4.6. Zooplankton Composition
- Among stations highest zooplankton population of 648 no m-3 were recorded at lagoon and light house recorded lowest diversity of 538 no m-3 (Figure 4a). Zooplankton recorded were the members of Foraminifera, Radiolaria, Celiata, Anthomedusae, Leptomedusae, Ctenophores, Salps, Doliolids, Chaetognatha, Cladocera, Ostracoda, Copepoda, Amphipoda, Pteropoda, Appendicularia, Decapoda, Larvae and Ichthyoplanktons. A total of 49 species of zooplankton were recorded, which include 14 species of Copepoda, 7 species of Foraminifera, 5 species of Ciliata, 3 species of Chaetognatha, 3 species of Cladocera, 2 species of Anthomeusae, 3 species of Amphipoda, 2 species of Pteropoda, 2 species Appendicularians.
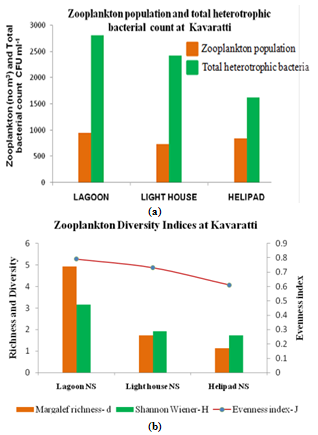 | Figure 4. Variation in a) Zooplankton population and total heterotrophic bacterial count, b) Zooplankton diversity indices at Kavaratti |
 | Figure 5. Percentage compositions (a) phytoplankton species (b) zooplankton species at Kavaratti |
|
| ||||||||||||||||||||||
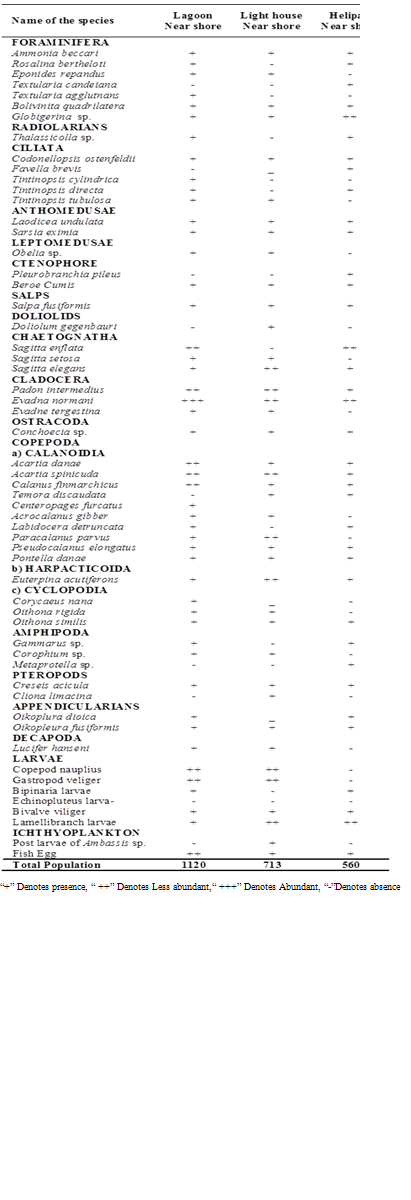
4.7. Plankton diversity and Similarity Indices
- Plankton species diversity is shown in Table 4 and Fig 4b. The maximum species diversity indexes obtained at the lagoon coincides with higher plankton density. In general, plankton diversity indices (Margalef richness d’, Shannon-Wiener H’, Pielou’s evenness J’) increased in the lagoon waters relative to light house and helipad waters are concomitant with increase in both abundance and biomass (Table 4). On the basis of these findings, it is concluded that the non-reef stations (light house and helipad) waters are least diverse both in species richness and coincides with population density. Similar Plankton diversity indices also observed at Uppanar backwaters, southeast coast of India [63].Among the total phytoplankton population 8 -10 species contribute up to 80% in lagoon waters, there were 2-3 species made up to 80% in non-reef stations suggesting overwhelming of certain species in population. Copepods were dominant and abundance among the various groups of zooplankton, 14 species of copepod constituted by 10 calanoida, 1 species of herpacticoida and 3 species of cyclopoida. The most common species were Acartia (A. danae and A. spinicudata from all the stations with 2 species. Among the ciliata, Tintinnopsis was the most abundant with 3 species. High plankton density at lagoon waters might be due to relatively stable environmental conditions, which prevailed inside the lagoon, further food, salinity and temperature are the key factor influencing distribution and abundance of plankton. Coral reef zooplankton is considered as an important trophic link between primary producers and higher trophic levels on reefs[64]. It has often been assumed that coral reef zooplankton largely came from surrounding oceanic water and their densities dramatically change[65].
4.8. Distribution of Total Heterotrophic Bacteria (THB)
- Present study revealed that the population density of heterotrophic bacteria varied from 1620 to 2800 CFU ml-1. Lagoon recorded much higher density than in the light house and helipad. The detritus particles that enriched the reef waters due to decaying macrophyte vegetation increased the distribution of organic matter as suggested, thereby increasing the bacterial population. Likewise, THB population density was higher at the lagoon where the plankton population (phytoplankton and zooplankton) density was higher. Dissolved organic matter released into the water from the plankton was probably the main source of nutrients that increased the bacterial population[66]. This would support the finding of Larsson et al.[67], who calculated that up to 45% of planktonic production, is secreted as dissolved organics and much of this is utilized by the bacteria. Reef ecosystem is the most active centre for the growth of heterotrophic bacteria[68] which are important in the recycling of nutrients and as food for many species of reef animals. These bacteria decompose particulate organic matter of local origin as well as imported from the surrounding ocean and from other reef areas and convert it into high quality biomass. This in turn serves as food for different consumers ranging from protozoa, meiofauna, sea cucumber and to the coral species[69,70,66]. In the present study, total heterotrophic bacterial count from the lagoon was relatively high and the bacterial activity within the reef regenerative spaces would help in the precipitation of calcium carbonate thereby helping in coral reef building. In the present study, lagoon near shore recorded higher bacterial population density than the non-coral reef waters (light house and helipad). Likewise, Westrum et al. [71] had shown that the bacterial population density was 10 times higher in water flowing off the back reef than over the reef front at the Lizard Island. The bacterial numbers increase when the water flows across the reef too rapidly, due to the suspension of particulate matter containing bacteria over the reefs. In many reef waters, corals on the reef flats support bacterial growth by extruding mucus. In the present study also, higher bacterial number was observed lagoon (Figure 4a) might be due to release of mucus from a variety of corals than at light house and helipad where no such coral diversity and distribution were noticed. Mucus is a glycopeptide and can be utilized by the marine bacteria as a carbon and nitrogen source[72]. Even prior to its release from the coral surface, secreted mucus serves as a habitat and substrate for viable heterotrophic bacteria[73], thus suggesting that mucus would form the basis for microbial food-chain.
4.9. Distribution of Macroalgae
- Lakshadweep Archipelagos have been observed to be very productive and harbor large numbers of marine algae and dense seagrass beds[74]. However, the seaweed flora around Kavaratti Island was represented by small numbers (12 sp.) and negligible quantities except for a few forms such as Padinaborgesenii, Acanthophoraspicifera and Hypneavalentiae and Ulvafaciata. Marine algae were mostly confined to the peripheral stretches along the reef flat in association with the seagrass beds, and on the narrow patches of sand stones at the lower intertidal region along the shore. The intertidal and submerged reef regions harbored very limited algae such as Turbinariaornata and Halimeda sp. The economically important species, such as Gelidiellaacerosa and Sargassum sp., occurred on the reef flat of storm beach towards high-tide and low-tide mark respectively, while species of Gracilaria and Hypnea were restricted to the lagoon.The seagrass flora of Kavaratti waters comprised of 6 spp., Varieties of marine algae grow in the seagrass beds as well as in epiphytic forms on seagrass blades and rhizomes[75,41]. The seagrass bed from the Kavaratti lagoon was observed to be patchy as stretches along the shore. Dense meadow occurs towards the northwest region of the lagoon exhibited marked zonation. Mostly patches of Thalassiahemprichii occurred in the shallow sandy regions towards the fore reef. While the mid-lagoon deeper region (1.5-2.5 m) harbored mixed dense beds of Thalassiahemprichii and Cymodocearotundata. The shallow region (0.5-1.5 m) towards land supports intensive growth of Cymodocearotundata. Apart from creeping kind and small-sized seagrasses, species like Halophila spp., commonly grow as pioneer species and form a suitable substratum for other larger-sized seagrasses to follow during the succession process[76]. A considerable amount of seagrass biomass contributes towards the detrital food chain[77]. That might be the reason for the high diversity at lagoon waters. Seagrass beds are ecologically and economically important habitats, and one of the most productive amongst the aquatic primary producer ecosystems[78]. Seagrass leaves are known to be habitats to epiphytic organisms such as micro and macro algae, various prokaryotes and calcareous animals [79,80]. Furthermore, epiphyte decrease water movement and thereby the erosion of sediment, which in turn allows for the seagrass to live in higher energy environments[81]. The seagrass habitats on the Lakshadweep are important, both for sustaining biological diversity and providing the local populace with ecosystem goods and services.
4.10. Trophic Interactions within the Food Webs
- Biomasses of planktonic components as well as bacterial and phytoplankton production and macro algae were quantified at three stations. Microphytoplankton, which dominated the total algal biomass and production (>82%), were characterized by the proliferation of several chain-forming diatoms. Microzooplankton was mainly composed of tintinnid (Tintinnopsis, and Favella) ciliates. Higher biomass of these protozoa was observed at lagoon, where large tintinnids were encountered. Mesozooplankton mainly represented by Calanoida (Acartia, Temora, Calanus and Paracalanus) and Cyclopoida (Oithona) copepods, exhibited higher and lower biomasses at lagoon and light house helipad respectively. Small heterotrophic flagellates and aloricate ciliates seemed to be the main controllers of bacteria. Microzooplankton has, however, a relatively low impact on microphytoplankton, as at light house and helipad. This implies that an important fraction of diatom production would be channeled by herbivorous meso-grazers to higher consumers at the lagoon where copepods were numerous. Most of the microalgal production would, however, sink, particularly at light house and helipad where copepods were scared. These different trophic interactions suggest different food web structures between stations. A multivorous food web seemed to prevail in non-coral areas, whereas microbial web was dominant in the lagoon. Food webs represent trophic interactions among species in communities. Those interactions both structure and are structured by species richness, ecological diversity, and evolutionary processes. This trophic pathway, which corresponds to a multivorous food web[10], can then contribute to an efficient carbon transfer to higher trophic levels in both stations. Conversely, in the lagoon biogenic carbon can reach higher consumers, mainly via the significant microzooplankton grazing on microbes. This trophic pathway, which corresponds to a microbial food web[82], seemed to be inefficient in carbon transfer, since small cells were not the main producers in the lagoon and thus the bulk of algal production would sink. Low abundance of microzooplankton and along with the concomitant occurrence of low mesozooplankton in the Lakshadweep suggests that there could be a general lack of planktonic grazers. This would result in a weak transfer of primary and bacterial carbon to higher trophic levels, eventually leaving behind much unconsumed basic food in the stations like Light house and helipad. Thus a major portion of the primary carbon either settles down or gets transported to the open waters. Our results indicate that there are two different planktonic food webs with the first information on phytoplankton and microzooplankton (heterotrophic flagellates, ciliates and dinoflgaellates) with their trophic interactions of the multivorous food web in the lagoon and the microbial food web in other stations.
5. Conclusions
- This study provides structure and the trophic interactions of the planktonic food web involving bacteria in the Kavaratti waters. Primary objectives were to relate the phytoplankton community composition to the physical variables of the ocean and explore potential links between the phytoplankton and zooplankton communities in the Kavaratti waters. However, both the phyto- and zooplankton communities appeared responsive to the physical environment; little correlation between the two trophic levels was evident. The study showed that phytoplankton community was distinctly divided into siliceous diatoms and dinoflagellates, while it was possible to predict the responses with respect to the changes in resource availability. Study revealed the influence of higher trophic grazers on phytoplankton was not significant as compared to the nutrient availability. The distinction between top-down and bottom-up influences is also important when considering the zooplankton community while this is less affected by changes in nutrients concentration whereas decrease or changes in pelagic consumers may have a large impact on this trophic level. The present study evidences that an abundant community of microzooplankton inhabit in Kavaratti lagoon waters seem to play a major role in the carbon cycling through the pelagic food web. However, at non-reef stations like the light house and helipad the major portion of the primary food may remain unutilized due to the low abundance of micro- and mesozooplankton. Being a productive coral reef ecosystem, both microzooplankton and heterotrophic bacterial abundance may be significant factors contributing to the plankton food web through microbial loop.
ACKNOWLEDGEMENTS
- The authors are grateful to Ministry of Earth Sciences, Government of India for the financial support during the study period. The help rendered by Dr. M.S. Syed Ismail Koya, Department of Science and Technology, Kavaratti, Union Territory of Lakshadweep by arranging boat facility for sampling purpose and other logistic supports, are specially remembered.