International Journal of Ecosystem

p-ISSN: 2165-8889    e-ISSN: 2165-8919

2011;  1(1): 1-9

doi:10.5923/j.ije.20110101.01

Study on Physico-Chemical Parameters of Waste Water Effluents from Taloja Industrial Area of Mumbai, India

Ram S. Lokhande1, Pravin U. Singare2, Deepali S. Pimple3

1Department of Chemistry, University of Mumbai, Santacruz, Vidyanagari, Mumbai, 400098, India

2Department of Chemistry, Bhavan’s College, Munshi Nagar, Andheri (West), Mumbai, 400058, India

3Department of Chemistry, R.J. College, Ghatkopar, Mumbai, 400086, India

Correspondence to: Pravin U. Singare, Department of Chemistry, Bhavan’s College, Munshi Nagar, Andheri (West), Mumbai, 400058, India.

Email:

Copyright © 2012 Scientific & Academic Publishing. All Rights Reserved.

Abstract

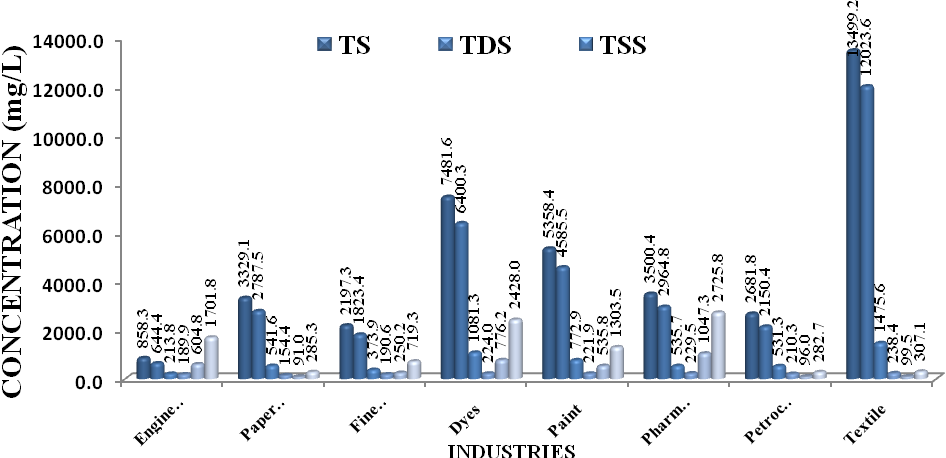
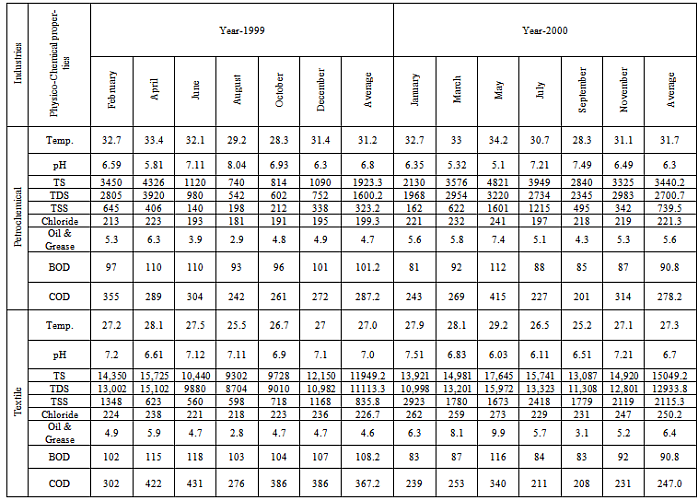
The present research work deals with the study of some of the important physico-chemical parameters of industrial waste water effluents collected from Taloja industrial belt of Mumbai. The study reveals that engineering, paper mill, fine chemical, dyes, paint, pharmaceutical, petrochemical and textile industries are some of the major industries responsible for polluting the surrounding aquatic environment. It was observed that pH values of effluent samples collected from paint, pharmaceutical and dyes industries were slightly above and below the limit of 6.5 to 8.5 by ISI and WHO. The effluent samples collected from textile industries shows extremely high Total Dissolved Soild (TDS) content of 12023.6 mg/L and correspondingly high Total Solid (TS) content of 13499.2 mg/L. The chloride content in the effluents from textile industries was 238.4 mg/L which was significantly high than acceptable limit of 200 mg/L set by WHO. The BOD values of effluent samples collected from pharmaceutical, dyes, engineering and paint industries were 1047.3, 776.2, 604.8 and 535.8 mg/L respectively which lie above the maximum permitted BOD content of < 100 to 300 mg/L. The COD values in the different industrial effluent samples were also very much higher than maximum permissible limit of 4.0 mg/L according to USPH Standard. The overall results highlight towards the discharge of highly polluted waste water effluent from industries of Taloja Industrial area of Mumbai. These industrial effluents have resulted in pollution of nearby Kasardi River thereby affecting the growth of vegetation and aquatic life. The results of the present investigation point out the need to implement common objectives, compatible policies and programmes for improvement in the industrial waste water treatment methods.

Keywords: Physico-Chemical Parameters, Water Pollution, Industrial Effluent, BOD, COD, Oil and Grease, Total Solid Content, TDS, TSS, Taloja Industrial Area, Mumbai

Cite this paper: Ram S. Lokhande, Pravin U. Singare, Deepali S. Pimple, Study on Physico-Chemical Parameters of Waste Water Effluents from Taloja Industrial Area of Mumbai, India, International Journal of Ecosystem, Vol. 1 No. 1, 2011, pp. 1-9. doi: 10.5923/j.ije.20110101.01.

1. Introduction

Waste management strategies adopted in India have failed to keep pace with the industrial growth and urbanization. The pollution impacts on marine communities[1,2] can be traced directly to the industrialized centers, which release an array of chemical contaminants to effluent systems. Of even greater concern have been the adverse environmental effects associated with waste disposal activities, particularly sewage sludge and dredged spoil dumping, oil spills and leakages as well as municipal and industrial waste water discharges. Most of the industries in India are situated along the river banks for easy availability of water and also disposal of the wastes. These wastes often contain a wide range of contaminants such as petroleum hydrocarbons, chlorinated hydrocarbons and heavy metals, various acids, alkalis, dyes and other chemicals which greatly change thephysico-chemical properties of water. The waste also includes detergents that create a mass of white foam in the river waters. All these chemicals are quite harmful or even fatally toxic to fish[1-3] and other aquatic populations[4]. It is found that one-third of the total water pollution in India comes in the form of industrial effluent discharge, solid wastes and other hazardous wastes.
Out of this, a large portion can be traced to the processing of industrial chemicals and to the food products industry. The surface water is the main source of industries for waste disposal. Untreated or allegedly treated effluents have increase the level of surface water pollution up to 20 times the safe level in 22 critically polluted areas of the country. It is found that almost all rivers are polluted in most of the stretches by some industry or the other[5,6]. Some of the previous studies in the Arabian Sea have shown that the petroleum hydrocarbons ranged from 1.8 to 11.1 mg/L in water, 1.84 to 5.81 mg/g dry wt in sediments and 0.33 to 3.67 mg/g wet wt in fish[7], while the total DDT in zooplankton samples in the Arabian Sea[8] varied from 0.083 to 0.563 mg/L.
Although all the Indian industries function under the strict guidelines of the Central Pollution Control Board (CPCB) but still the situation of environmental pollution is far from satisfactory. Different norms and guidelines are given for all the industries depending upon their pollution potentials. Most of the major industries have treatment facilities for industrial effluents. But this is not the case with small scale industries, which cannot afford enormous investments in pollution control equipment as their profit margin is very slender. Consequently, the water pollution problem particularly due to toxic heavy metals has become menacing concern. As a result in India there are sufficient evidences available related with the mismanagement of industrial wastes[9-14].
Previous data on water pollution along creeks and rivers [6,15-26] points out to the need of systematic and regular monitoring of pollution level for further improvement in the industrial waste water treatment methods. The day by day increasing tremendous industrial pollution in India has prompted us to carry the systematic and detail study of physico-chemical properties of industrial waste water effluent from the Taloja Industrial belt of Mumbai.

2. Materials and Methods

2.1. Area of Study

The study was carried at the Taloja industrial area which is one of the most rapidly developing and heavily polluted industrial belts of Mumbai. The industrial area is spread over 863.18 hectares of land consisting of about 600 large and medium scale industries like engineering units, steel processing industries, chemical units, paints, pharmaceutical units, textile industries etc. The study area lies between latitude 19°3'39"N longitudes 73°6'57"E. The main water source for the industrial consumption is Maharashtra Industrial Development Corporation. The industrial area utilizes about 45,000 m3/day of fresh water. The treated and untreated effluent discharge amounts to 28,750 m3/day i.e., 64% of the total industrial effluents. This has created health hazards not only for local population but also resulted in disturbances of aquatic life of the Kasardi River flowing near the industrial area[6].

2.2. Climatic Conditions

The weather of the study area is typical coastal sultry and humid. The average rainfall records from 1,500 mm to 2,000 mm. The place experiences the onset of the monsoon in the month of June and experiences monsoon till the end of September. The average temperature recorded varies from 25 to 42 degrees.

2.3. Requirements

All the glassware, casserole and other pipettes were first cleaned with tape water thoroughly and finally with de-ionized distilled water. The pipettes and burette were rinsed with solution before final use. The chemicals and reagent were used for analysis were of analytical reagent grade. The procedure for calculating the different parameters were conducted in the laboratory.

2.4. Industrial Effluent Sampling and Preservation

The industrial waste water effluent samples were collected randomly twice in a month in morning, afternoon and evening session from different industries like engineering industries, paper mills, fine chemical manufacturing industries, dyes industries, paint industries, pharmaceutical industries, petrochemical industries and textile industries of Taloja Industrial belt. For each type of industry three representative units was selected. The samples were collected every alternate month from February 1999 to November 2000. The sampling was done in three shifts i.e. morning shift between 07:00 a.m. to 09:00 a.m., afternoon shift between 02:00 p.m. to 04:00 p.m. and evening shift between 07:00 p.m. to 09:00 p.m. Polythene bottles of 2.5 L and 2.0 L were used to collect the grab water samples (number of samples collected, n = 19). The bottles were thoroughly cleaned with hydrochloric acid, washed with tape water to render free of acid, washed with distilled water twice, again rinsed with the water sample to be collected and then filled up the bottle with the sample leaving only a small air gap at the top. The sample bottles were stoppard and sealed with paraffin wax.

2.5. Physico-chemical Study

The samples were collected were analyzed for temperature, pH, Total Solids(TS), Total Dissolved Solids(TDS), Total Suspended Solids (TSS), chloride content, oil /grease, Biochemical Oxygen Demand (BOD) and Chemical Oxygen Demand(COD) values. The techniques and methods followed for collection, preservation, analysis and interpretation are those given by Rainwater and Thatcher[27], Brown et al[28], ICMR[29], Hem[30] and APHA[31].

3. Results and Discussion

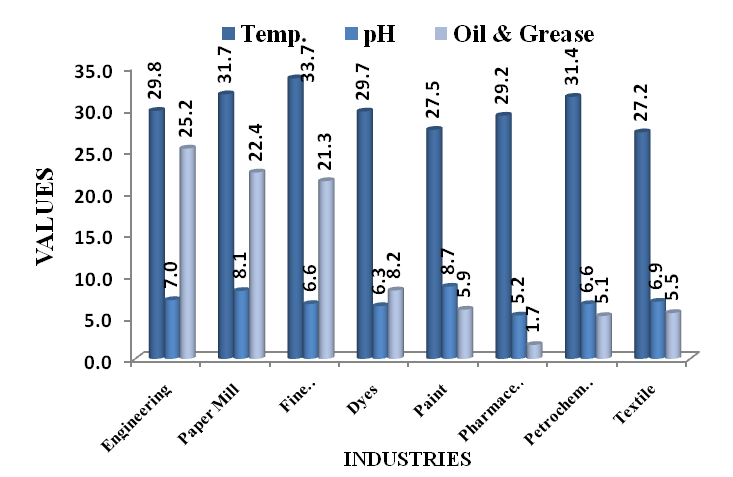
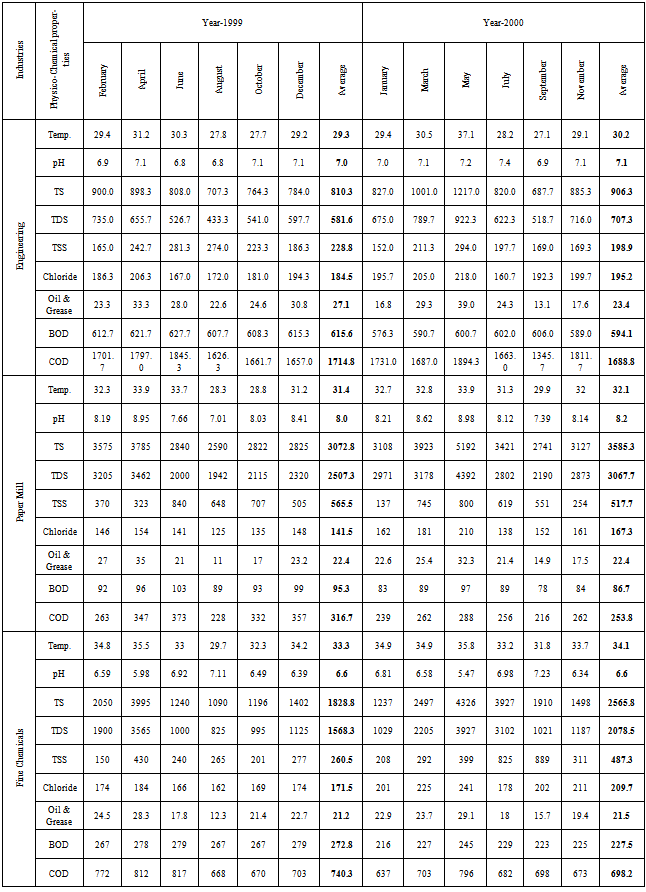
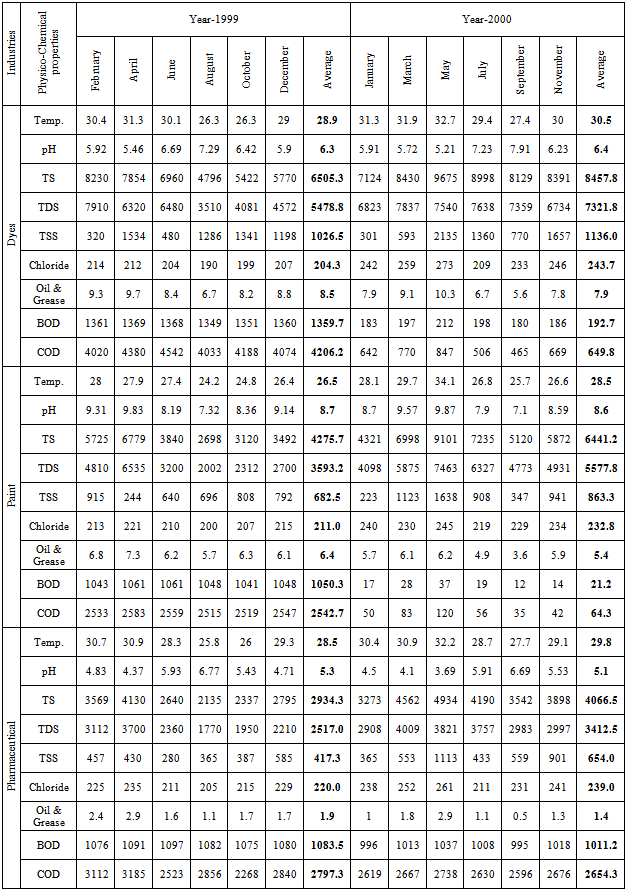
The experimental data on physico-chemical properties of water samples collected from different industries of Taloja industrial estate of Mumbai is presented in Tables 1, 2 and 3.
Temperature is one of the most important ecological features. It controls behavioural characteristics of organisms, solubility of gases and salts in water. The basis of all life functions is complicated set of biochemical reactions that are influenced by physical factors such as temperature. Disease resistance is also linked to temperature. Increase in temperature also increases the rate of microbial activity. Temperature increase may become barrier to fish migration and in this way seriously affect on reproduction of species. The major sources of thermal pollution are industrial cooling systems working in a manufacturing plant or a power plant. In the present study, the biyearly average temperature of industrial effluents varies between minimum of 27.2 ℃ for the effluents from textile industries and maximum of 33.7 ℃ for the effluents collected from fine chemical industries (Figure 1).
pH is a measure of the acidity or alkalinity of water and is one of the stable measurements. pH is a simple parameter but is extremely important, since most of the chemical reactions in aquatic environment are controlled by any change in its value. Anything either highly acidic or alkaline would kill marine life. Aquatic organisms are sensitive to pH changes and biological treatment requires pH control or monitoring. The toxicity of heavy metals also gets enhanced at particular pH. Thus, pH is having primary importance in deciding the quality of waste water effluent. Waters with pH value of about 10 are exceptional and may reflect contamination by strong base such as NaOH and Ca(OH)2[32]. The range of desirable pH of water prescribed for drinking purpose by ISI [33] and WHO[34] is 6.5 to 8.5. The biyearly average pH values of effluent samples collected from different industrial units vary between minimum 5.2 in the effluent collected from pharmaceutical industries and maximum of 8.7 in the effluent samples collected from paint industries. In both the cases, pH values were slightly below and slightly high above the permissible limit. The biyearly average pH value of the effluent sample collected from dyes manufacturing industries was observed to be 6.3 which lie slightly below the permissible limit (Figure 1).
Figure 1. Variation in average values of temperature, pH, oil and grease content in the effluent samples collected from industries of Taloja industrial area for the assessment year 1999-2000 (values of oil and grease are expressed in mg/L)
Figure 2. Variation in average values of total solids, chloride, BOD and COD content in the effluent samples collected from industries of Taloja industrial area for the assessment year 1999-2000
Table 1. Physico-Chemical Properties of Effluent Samples Collected from different Industries of Taloja Industrial Estate of Mumbai
     
Table 2. Physico-Chemical Properties of Effluent Samples Collected from different Industries of Taloja Industrial Estate of Mumbai
     
Table 3. Physico-Chemical Properties of Effluent Samples Collected from different Industries of Taloja Industrial Estate of Mumbai
     
Chloride occurs in all natural waters in widely varying concentrations. Excessive chloride in potable water is not particularly harmful and the criteria set for this anion are based primarily on palatability and its potentially high corrosiveness[35]. Chloride in excess (> 250 mg/L) imparts a salty taste to water and people who are not accustomed to high chlorides may be subjected to laxative effects. The chloride content in the river water samples ranged between 224 mg/L in downstream and 222 mg/L in upstream of the river (Figure 2). The results indicate maximum chloride content of 238.4 mg/L in the effluent samples collected from textile industries which was above the acceptable limit of 200 mg/L set by WHO, but within the limits of 250 mg/L set by ISI.
In the present investigation, the biyearly average oil and grease content varies between minimum (1.7 mg/L) in the effluent samples collected from pharmaceutical industries, and maximum (25.2 mg/L) in the effluents from engineering industries. The paper mill and fine chemical industries also shows significant oil and grease contribution of 22.4 mg/L and 21.3 mg/L respectively (Figure 1). It is important here to note that oil which forms a surface film on the river can coat plants and animals reducing oxygenation from the atmosphere above. The film of oil that floats over the water body affects the transmission of light through the water body there by disturbing the process of photosynthesis in the aquatic plants. In animals, oil coating can destroy the insulating properties of fur and feathers. Oil bioaccumulates in the higher animals and further enters the food chain. Detergents create frothing, and can harm invertebrates and fish; as they are a major source of phosphates.  Moreover, petroleum or grease spilled over water also produces chemicals that are extremely harmful for marine animals.
BOD may be defined as the rate of removal of oxygen by microorganisms in aerobic degradation of the dissolved organic matter in water over a 5-day period. Increases in BOD can be due to heavy discharge of industrial waste water effluent, animal and crop wastes and domestic sewage. BOD values have been widely adopted as a measure of pollution effect. It is one of the most common measures of pollutant organic material in water. It indicates the amount of putrescible organic matter present in water. Sources of BOD in aquatic environment include leaves and woody debris, dead plants and animals, animal manure, industrial effluents, wastewater treatment plants, feedlots, and food-processing plants, failing septic systems, and urban storm water runoff. According to UN Department of Technical Cooperation for Development the maximum permitted BOD content is < 100 to 300 mg/L. The experimental data of present investigation shows biyearly average BOD value of 1047.3 mg/L in effluent samples collected from pharmaceutical industries which were extremely higher than the permissible limit. The effluent samples collected from engineering, dyes and paint industries also show significantly high BOD values of 604.8 mg/L, 776.2 mg/L and 535.8 mg/L respectively (Figure 2). It is important here to note that low BOD content is an indicator of good quality water, while a high BOD indicates polluted water. BOD directly affects the amount of dissolved oxygen (DO) in rivers and streams. The greater the BOD, the more rapidly oxygen is depleted in the water. This means less oxygen is available to higher forms of aquatic life. The consequences of high BOD are the same as those for low DO: aquatic organisms become stressed, suffocate, and die.
All organic compounds with few exceptions can be oxidized by the action of strong oxidizing agents under acidic condition. The Chemical Oxygen Demand (COD) determination is a measure of the oxygen equivalent of that portion of the organic matter in a sample that is susceptible to oxidation by a strong chemical oxidant. During COD determination; oxygen demand value is useful in specifying toxic condition and presence of biologically resistant substances. It is an important, rapidly measured parameter for industrial waste water studies and control of waste treatments. COD test is used to measure the load of organic pollutants in the industrial waste water. The COD and BOD values both are a measure of the relative oxygen-depletion effect of a waste contaminant. Both have been widely adopted as a measure of pollution effect. COD is also one of the most common measures of pollutant organic material in water. COD is similar in function to BOD, in that both measure the amount of organic compounds in water. In the present investigation the biyearly average COD values lies between 2725.8 mg/L in the effluent samples collected from pharmaceutical industries and 282.7 mg/L in the effluents from petrochemical industries (Figure 2). It was observed that in all the effluents collected from different industries, the COD values are very much higher than 4.0 mg/L which is a maximum permissible limit according to USPH Standard.
TDS content in water is a measure for salinity. A large number of salts are found dissolved in natural waters, the common ones are carbonates, bicarbonates, chlorides, sulphates, phosphates, and nitrates of calcium, magnesium, sodium, potassium, iron, and manganese, etc. A high content of dissolved solid elements affects the density of water, influences osmoregulation of freshwater in organisms, reduces solubility of gases (like oxygen) and utility, of water for drinking, irrigational, and industrial purposes. Waters can be classified based on the concentration of TDS[29,36] as, desirable for drinking (up to 500 mg/L), permissible for drinking (up to 1,000 mg/L), useful for irrigation (up to 2,000 mg/L), not useful for drinking and irrigation (above 3,000 mg/L). In the present investigation, the biyearly average value of TDS lies in the range of 12023.6 mg/L in the effluents from textile industries and 644.5 mg/L in the effluent samples collected from engineering industries. The average value of TDS in the effluent samples from paper mill, fine chemical, dyes, paint, pharmaceutical and petrochemical industries were obtained to be 2787.5, 1823.4, 6400.3, 4585.5, 2964.8 and 2150.4 mg/L respectively (Figure 2). Based on the above classification, it was observed that other than effluents obtained from engineering industries; almost all other industrial effluents cannot be considered safe even for irrigation purpose. The effluents obtained from textile industries also shows high TSS and TS values of 1475.6 mg/L and 13499.2 mg/L respectively, while effluents from engineering industries shows low TSS value of 213.8 mg/L and corresponding low TS value of 858.3 mg/L (Figure 2).

4. Conclusions

Around the world as countries are struggling to arrive at an effective regulatory regime to control the discharge of industrial effluents into their ecosystems, Indian economy holds a double edged sword of economic growth and ecosystem collapse. The present experimental data indicates high level of pollution along Taloja Industrial belt of Mumbai. The experimental data suggests a need to implement common objectives, compatible policies and programmes for improvement in the industrial waste water treatment methods. It also suggests a need of consistent, internationally recognized data driven strategy to assess the quality of waste water effluent and generation of international standards for evaluation of contamination levels. The existing situation if mishandled can cause irreparable ecological harm in the long-term well masked by short term economic prosperity.

ACKNOWLEDGEMENTS

The authors are extremely thankful to SAP Productions for developing and maintaining the manuscript template.

References

[1]  A. Aghor, ‘Chemicals make Thane creek the worst polluted water body'. Daily DNA. August 14, 2007. Mumbai, India. [Online]. Available: http://www.dnaindia.com/mumbai/report_chemicals- make-thane- creek- the-worst- polluted-waterbody_1115439
[2]  D. Patil, ‘A lot's fishy about our creek and lake fish’. Daily Times of India. March 22, 2009. Mumbai, India. [Online].Available:http://timesofindia.indiatimes.com/city/thane/A-lots-fishy-about-our-creek-and-lake-fish/articleshow/4298566.cms
[3]  Kumar, A., 1996,Impact of industrial pollution on the population status of endangered Gangetic dolphin (Platanista gangetica) in the River Ganga in Bihar, India Pol. Arch. Hydrobiol., 18(4), 469-476
[4]  Chakravarty, R.D., Roy, P., Singh, S.B., 1959, Aquantitative study of the plankton and the physicochemical conditions of the River Jumna at Allahabad in 1954-55.,Indian J.Fish., 6(1), 186-203
[5]  Modak, D.M., Singh, K.P., Ahmed, S., and Ray, P.K.,1990, Trace metal ion in Ganga water system., Chemosphere, 21(1-2), 275-287
[6]  Lokhande, R.S., Singare, P.U., and Pimple, D.S., 2011, Quantification Study of Toxic Heavy Metals Pollutants in Sediment Samples Collected from Kasardi River Flowing along the Taloja Industrial Area of Mumbai, India., The New York Science Journal 4(9), 66-71
[7]  Sengupta, R., Fondekar, S.P., and Alagarsamy, R., 1993, State of pollution in the Arabian Sea after 1991 Gulf oil spill., Mar. Pollut. Bull., 27(1), 85-91
[8]  Shailaja, M.S., and Sengupta, R., 1990, Residues of dichlorodiphenyltrichloroethane and metabolites in zooplankton from the Arabian Sea., Curr. Sci., 59(19), 929-931
[9]  Rajaram, T., and Das, A., 2008, Water pollution by industrial effluents in India: discharge scenarios and case for participatory ecosystem specific local regulation., Futures, 40(1), 56-69
[10]  Khurshid, S., Abdul, B., Zaheeruddin, A., and Usman,S.M., 1998, Effect of waste disposal on water quality in parts of Cochin, Kerala., Indian J.Environ.Health, 40(1), 45-50
[11]  Pachpande, B.G., and Ingle, S.T., 2004, Recovery of the chromium by chemical precipitation from tannery effluent., Orient J. Chem., 20(1),117-123
[12]  Prabha, S., and Selvapathy, P., 1997, Heavy metal pollution in Indian Rivers., Indian J. Environ. Prot., 17(6), 641-649
[13]  Singare, P.U., Lokhande, R.S., and Jagtap, A.G., 2011,Water pollution by discharge effluents from Gove Industrial Area of Maharashtra, India: Dispersion of heavy metals and their Toxic effects., International Journal of Global Environmental Issues, 11(01), 28-36
[14]  Singare, P.U., Lokhande, R.S., and Jagtap, A.G., 2010, Study of Physico-chemical quality of the Industrial Waste Water Effluent from Gove Industrial Area of Bhiwandi City of Maharashtra, India., Interdisciplinary Environmental Review, 11(4), 263-273
[15]  Sasamal, S.K., Rao, K.H., and Suryavansi, U.M., 2007, Sewage and industrial pollution in and around Thane Creek, Mumbai using high resolution IRS data., International Journal of Remote Sensing, 28(19), 4391-4395
[16]  Jha, S.K., Krishnamoorthy, T.M., Pandit, G.G., and Nambi, K.S.V., 1999, History of accumulation of mercury and nickel in Thane Creek, Mumbai, using 210Pb dating technique., Science of the total environment, 236(1), 91-99
[17]  Sahu, S.K., Ajmal, P.Y., Pandit, G.G., and Puranik, V.D.,2009, Vertical distribution of polychlorinated biphenyl congeners in sediment core from Thane Creek area of Mumbai, India., Journal of hazardous materials, 164(2-3), 1573-1579
[18]  ha, S.K., Chavan, S.B., Pandit, G.G., Negi, B.S., and Sadasivan, S., 2002, Behaviour and Fluxes of Trace and Toxic Elements in Creek Sediment near Mumbai, India., Environmental Monitoring and Assessment, 76(2), 249-262
[19]  Singare, P.U., Lokhande, R.S. and Naik, K.U., 2010, A Case Study of Some Lakes Located at and Around Thane City of Maharashtra, India, with Special Reference to Physico-Chemical Properties and Heavy Metal content of Lake Water., Interdisciplinary Environmental Review, 11(1), 90-107
[20]  Singare, P.U., Lokhande, R.S., and Pathak, P.P., 2010, Soil Pollution along Kalwa Bridge at Thane Creek of Maharashtra, India., J. Environmental Protection, 1(1), 121-128
[21]  Singare, P.U., Lokhande, R.S., and Pathak, P.P., (2010), Study on Physico-Chemical properties and Heavy Metal Content of the Soil Samples from Thane Creek of Maharashtra, India., Interdisciplinary Environmental Review, 11(1), 38-56
[22]  Lokhande, R.S., and Kelkar, N., 1999, Studies on heavy metals in water of Vasai Creek, Maharashtra., Indian J. Environ. Protect., 19(9), 664-668
[23]  P.U.Singare, Heavy metal -- in and around the lakes-Pollution due to toxic heavy metals at the Jail Talav and Kalwa Lakes of Thane City, EurekAlert!-Atmospheric Science – Sunday, August 7, 2011. [Online].Available: http://www.worldweatherpost.com/2011/08/07/india-heavy-metal-in-and-around-the-lakes
[24]  P.U.Singare, Thane lakes high on metal content: Study, Daily Times of India. August 10, 2011. Mumbai, India. [Online].Available: http://timesofindia.indiatimes.com/city/mumbai/Thane-lakes-high-on-metal contentStudy/articleshow/9547159.cms
[25]  Singare, P.U., Lokhande, R.S., and Bhattacharjee, S.S., 2011, Physico-Chemical Analysis of the Sediment Samples collected from Thane Creek of Maharashtra, India., Interdisciplinary Environmental Review, 12(2), 95-107
[26]  Report on Mithi River Water Pollution and Recommendations for Its Control, Survey Conducted By Klean Environmental Consultants Pvt. Ltd., Mumbai, As Submitted To Maharashtra Pollution Control Board, Mumbai. Ref.No.0407/Mpcb Mithi River Survey/ 109, July 10, 2004
[27]  Rainwater, F.H., and Thatcher, L.L., 1960, Methods for Collection and Analysis of Water Samples, U.S. Geol. Surv. Water Supply Papers, 1454, 1–301
[28]  E. Brown, M.W. Skougstad, M. J. Fishman, ‘Methods for collection and analysis of water samples for dissolved minerals and gases’, Techniques of Water Resources Investigations of the U.S. Geological Survey, Vol. 160, Book 5, Chapter A1 (1970)
[29]  Indian Council of Medical Research (ICMR) Manual of Standards of Quality for Drinking Water Supplies, (1975)
[30]  J.D.Hem, ‘Study and Interpretation of Chemical Characteristics of Natural Water’, 3rd ed., U.S. Geological Survey, Washington (1985)
[31]  American Public Health Association (APHA) Standard Methods for Estimation of Water and Wastewater, 19th ed., American Water Works Association, Water environment Federation, Washington, (1995)
[32]  D. Langmuir, Aqueous Environmental Chemistry, Prentice-Hall, Inc., New Jersey, (1997)
[33]  ndian Standard Institute (ISI), ‘Drinking Water Specification’ (1991)
[34]  World Health Organization (WHO), Guidelines for Drinking Water Quality. Health Criteria and other Supporting Information, 1, WHO, Geneva, (1984)
[35]  Bhujangaiah, N.S., and Nayak, P.V., 2005, Study of ground water quality in and around Shimoga City, Karnataka., J. Ind. Coun. Chem., 22(1), 42-47
[36]  L.V. Wilcox, Classification and Use of Irrigation Waters, 966, US Dept. of Agricultural Science, Grc. (1955)