
-
Paper Information
- Paper Submission
-
Journal Information
- About This Journal
- Editorial Board
- Current Issue
- Archive
- Author Guidelines
- Contact Us
International Journal of Construction Engineering and Management
p-ISSN: 2326-1080 e-ISSN: 2326-1102
2026; 15(2): 42-60
doi:10.5923/j.ijcem.20261502.03
Received: Oct. 20; Accepted: Nov. 5, 2026; Published: Nov. 7, 2026

Transportation Cost as a Driver of Selected Construction-Material Prices under Currency Instability: Evidence from Sudan in 2021
 Abstract
 Reference
 Full-Text PDF
 Full-text HTML
Elkhider B. E. Mohamed1, Ahmed E. A. Badi2
1Department Name of Civil Engineering, Elnasr University, Khartoum, Sudan
2Department Name of Civil Engineering, University of Science and Technology, Khartoum, Sudan
Correspondence to: Elkhider B. E. Mohamed, Department Name of Civil Engineering, Elnasr University, Khartoum, Sudan.
| Email: |  |
Copyright © 2026 The Author(s). Published by Scientific & Academic Publishing.
This work is licensed under the Creative Commons Attribution International License (CC BY).
http://creativecommons.org/licenses/by/4.0/

Construction-material prices in developing economies are influenced by transportation expenses, in addition to being affected by inflation and exchange-rate fluctuations; however, the transport component is rarely isolated. This study estimates the contribution of transport expenses to the prices of five essential construction materials in Sudan, a year of exchange rate unification, fuel subsidy removal, and annual inflation above 400%. Monthly selected materials prices and delivery costs for aggregate, sand, red brick, reinforcing steel, and cement (January–December 2021; 60 material months) were based on the modal pricing from 27 suppliers across five Sudanese states, with each component specified for the same trading unit. These prices were converted from Sudanese pounds (SDG) to US dollars using a market-reflective exchange-rate series, as the pound fluctuated excessively to be considered a stable unit of measurement. Descriptive statistics, transport ratio evaluation, Pearson, Spearman, and Kendall correlation evaluations, ordinary least squares and logarithmic elasticity models, a merged fixed effect model, a fuel-subsidy model test, and exchange-rate sensitivity analysis were applied with Holm correction of the p-values for the five analysed materials. Transport represented 54.6% of the delivered cost of red brick, 49.3% for aggregate, 33.8% for sand, 9.1% for cement, and 1.2% for steel. In US dollar currency terms, transport cost was extremely correlated with material price for sand (r = 0.94) and aggregate (r = 0.91), strongly for cement (r = 0.68), and not significantly for red brick or steel. The merged elasticity of material price to transport cost was 0.57 (p < 0.001). The mean transport cost in the seven months after the June 2021 fuel-subsidy removal was 29.1% higher than in the prior five months in nominal pounds, compared to 8.7% higher in US dollars, a trend consistent with a significant currency factor in the nominal increase. Conversion at the official rate probably generated unexpected reductions of 60–87%. Due to of the limited number of monthly observations in each series, these results should be interpreted cautiously as relationships, not as proof of correlation. This paper provides evidence from Sudan that differentiates the transport (cost-push) channel of exchange from the currency channel at the material level. Thus, in economies with multiple exchange rates, the choice of a standard conversion rate can significantly affect the results. It also proposes a transport indexed price adjustment formula for contract estimation and pricing in unstable economies.
Keywords: Transportation cost, Construction materials, Price escalation, Exchange rate, Inflation, Sudan
Cite this paper: Elkhider B. E. Mohamed, Ahmed E. A. Badi, Transportation Cost as a Driver of Selected Construction-Material Prices under Currency Instability: Evidence from Sudan in 2021, International Journal of Construction Engineering and Management , Vol. 15 No. 2, 2026, pp. 42-60. doi: 10.5923/j.ijcem.20261502.03.
Article Outline
1. Introduction
- The construction industry is a major driver of economic growth, employment and infrastructure provision. The output that results from this is highly sensitive to the cost of the inputs associated with it. The price changes of building materials individually account for usually 35-60% of the total cost of construction and directly results in budget deviations, claims and disputes [1]. The cost overrun is a perennial problem for the developed and developing countries. According to Flyvbjerg, Holm and Buhl [2], costs were under-estimated in the most nine out of ten public works projects. Fluctuations in the prices of materials have been identified as a factor in inadequate cost performance in studies in Vietnam and the Gaza Strip [3], [4]. The prices of materials are affected by a number of interrelated factors—supply and demand, energy and raw-material costs, labor, exchange rates, import duties, inflation, and, notably, transport [5]. The value of construction materials is low compared to their weight and volume; consequently, the cost of transporting them from quarry, kiln, or factory to site constitutes a large and often hidden proportion of the amount that contractors actually pay [6]. For natural aggregates, the cost at point of delivery is currently shown to double every 25–35 miles from the point of production [7] (cited in [8]). Transport costs thus create a cost-push channel that transfers fuel prices and transportation tariffs to construction budgets. Sudan in 2021 provides an illuminating setting in which to examine this channel. The country launched the year with a dual exchange-rate regime, whereby the parallel-market rate proved almost five times the official rate [9]. On 21 February 2021, the Central Bank of Sudan (CBoS) harmonised the rates by moving the official rate from SDG 55 to SDG 375 for each US dollar [10], [11]. On 8 June 2021 the government eliminated remaining fuel subsidies, more than doubling the pump price of diesel from SDG 125 to SDG 285 per liter [12], and transport tariffs increased by more than 85% [13]. Annual inflation, which was 269% at the end of 2020, peaked at 422.78% in July 2021 [14], [15]. In this case, prices expressed in Sudanese pounds are a mix of real cost changes and the loss of the purchasing power of the currency. For this reason all prices in this study are given in US dollars: the Sudanese pound was sufficiently unstable during 2021 that nominal SDG prices failed to be stable enough to compare month by month.Previous studies have mainly focused on the determination of the relation between the general inflation and the material prices [16]–[18] or the prediction of the material prices based on macroeconomic indicators [19]–[21]. Transport, a component of delivered cost, is usually aggregated rather than divided at the level of specific materials, and data from Sudan are rare [22]. This study aims to examine the effect of transportation cost on five building materials (aggregate, sand, red brick, reinforcing steel, and cement) pricing in Sudan in 2021. The specific aims are to: (i) express the monthly material prices and transport costs in US dollars utilizing a market-reflective exchange-rate series; (ii) express the proportion of transport in the delivered cost of each material; (iii) assess the strength and direction and elasticity of the relationship between transport cost and material price; (iv) assess the effect of the fuel-subsidy removal of June 2021 on transport cost; (v) assess the sensitivity of the conclusions to the exchange-rate basis; and (vi) develop practical recommendations for estimators, clients, and policy-makers. The paper provides an empirical, material-by-material deconstruction of supplied cost for a fragile, high-inflation economy. It demonstrates methodologically that, in an economy with multiple exchange rates, the translation of prices at the official rate may reverse the sign of the observed cost increase. It effectively transforms the observed transport shares into an index-based price adjustment algorithm for transport.
2. Literature Review
- Due to construction materials being substantial and of low unit value, transport forms a significant—and frequently hidden—part of the cost of material purchases [6]. Logistics expenses increase significantly with the demand for materials and the frequency of vehicle movements [31], and for aggregates, the transportation distance rapidly represents the primary factor in the total supplied cost [7] (quoted in [8]). The cost of generating transportation services is contingent upon labour, vehicles, fuel, and infrastructure. Brumbaugh et al. [32] determined, using United States statistics that petroleum products account for approximately 36.7% of the input expenses for for-hire transportation in aviation, while petrol and motor oil represent 22.0% of home transportation expenditures. The costs of petrol, No. 2 diesel, jet kerosene and railway diesel fluctuate in unison due to their dependency on crude oil as a shared resource: they surpassed US$3.00 a gallon in 2008, plummeted during the 2007–2009 economic downturn, rebounded post-2011, decreased from 2013 to 2016, and escalated in 2017. Fuel costs fluctuate geographically due to taxes, refinery placements, supply, and regulations; in 2017, the average petrol price in the US was US$2.53 per gallon, ranging from US$2.30 on the Gulf Coast to US$2.95 on the West Coast. From 2004 to 2017, the producer price index (PPI) for rail transport services increased by 60.4%, for air transport by 35.0%, for trucking by 30.3%, and for water transport by 28.1%, in contrast to the PPI for transport equipment, which escalated across all modes except for light vehicles. Escalating expenses for equipment and fuel therefore permeate supply chains, influencing the pricing of commodities reliant on transportation. The transportation of building materials incurs an ecological cost. Utama et al. [33] estimated that in 2009, Indonesia had 549,708 non-passenger vehicles used throughout the construction industry, producing about 2.9 million tonnes of CO₂-equivalent, with an average transport distance of 233.2 km. Among four scenarios – business as usual, Jatropha curcas biodiesel, palm methyl ester (PME) biodiesel, and natural-gas vehicles (NGV) – PME exhibited approximately 79.5% reduced CO₂ emissions compared to diesel, while NGV demonstrated around 18% lower emissions; the expense of converting a vehicle to NGV, estimated at US$3,000, was anticipated to decrease to about US$2,600 by 2040 due to learning effects. Fuel transitions thus influence both the expenses and the emissions associated with material transportation.
2.1. Inflation: Concept, Causes and Economic Consequences
- Inflation is a sustained rise in the general level of prices for goods and services, and therefore a fall in the purchasing power of money [23]. Sustainable growth is an essential goal of economics; hence, accurate measurement and prediction of inflation are crucial for monetary policy. Uncertainty measurement and prediction of inflation are crucial for monetary policy; uncertainty over the inflation trajectory undermines the legitimacy of policy choices. Interest rates, potential production, exchange rate, money supply, wage rates, trade openness, and inflation expectations are the metrics that require further observation [1]. There is a growing interest in the subject: the number of inflation-related studies indexed has been increasing since the mid-twentieth century, reaching 3,628 in 2018 [1]. Three main factors that cause inflation are identified. Demand-pull inflation occurs when overall demand is increasing more rapidly than the ability of the economy to produce, leading to a positive output gap and squeezing scarce resources. Cost-push inflation occurs when companies raise prices to protect their profit margins from escalating input costs, including energy, labor, and transportation. Regulated pricing is government decisions about utility rates, petrol prices, and taxes. The money supply, currency rate, gross domestic product (GDP), and foreign exchange reserves also influence inflationary pressure. The transport channel studied here is a cost-push mechanism, while the removal of fuel subsidies in Sudan in 2021 is an obvious illustration of an administered-price shock. Nusair [24] discovered that the rise in oil prices has a significant positive effect on inflation in the six Gulf Cooperation Council countries, with this impact being more pronounced in the foreseeable future than in the short term; additionally, the response to increases and decreases in oil prices is not symmetrical, as increases in oil prices have a larger impact on inflation. The macroeconomic effects of oil-price shocks depend on the nature of the impact [25]. The inflation-growth correlation is also non-linear: inflation levels above a certain threshold hinder growth for the ASEAN-5 countries [27]. Inflation erodes the value of companies' liquid assets and discourages investment in research and technology, with consequences for productivity.
2.2. Inflation, Cost Escalation and the Construction Industry Page Style
- Construction projects are long and very capital intensive, priced in advance and so particularly vulnerable to inflation. The process of implementation often sees budgets being altered, as the costs of materials, the wages of the labour force and rates for renting equipment vary in response to inflation with a lag, creating a gap between the initial and final costs. Construction inflation is not consistent, it varies from market to market and material to material. Add in contractors and suppliers mark-up and things get even more complicated. Clients also can face a risk premium in the face of unexpected future inflation. There is empirical evidence that links inflation with commodity prices. Musarat et al. [18] indicated a significant correlation between inflation and the costs of essential construction materials in Malaysia. In Nigeria, Ogun, Ogunsina, and Ugochukwu [16] discovered that cumulative inflation forecasted the costs of cement, reinforcement, sharp sand, and concrete blocks, despite the absence of granite or emulsion paint – indicating that inflation influences materials inconsistently and that additional factors, notably importation, are significant. Akanni, Oke, and Omotilewa [17] observed the continuous increase in construction material expenses in Lagos State and its implications for project execution. Inflation also impacts the workforce: Tang [28] has shown that real wages and inflation affect labour productivity in Malaysia, with inflation having an adverse effect. A study conducted in Sudan among 85 engineers identified economic inflation as the primary factor contributing to cost overruns in railway projects [22]. Collectively, these investigations indicate that inflation, material expenses, and cost overruns create a loop that can only be disrupted if budgets explicitly include price increases.
2.3. Determinants of Construction-Material Prices
- Windapo and Cattell [5] developed a theoretical framework whereby material prices are influenced by supply and demand, market dynamics, transportation expenses, energy expenditures, raw material costs, labour expenses, crude oil prices, currency exchange rates, import tariffs, and inflation. Transport expenses and crude oil prices were ranked as the main factors by quantity surveyors in evaluating contractors, quantity surveyors and suppliers. Transport, labour and inflation were closely in line with actual price changes. Quantitative forecasting research demonstrates the importance of macroeconomic and energy variables. Additional research applied time-series techniques to model construction-material prices. Ashuri and Lu [19] modelled the Engineering News-Record construction cost index; Ilbeigi, Ashuri, and Joukar [29] forecasted prices of asphalt and cement; Faghih and Kashani [20] applied vector error-correction models to estimate the short- and long-run prices of asphalt, steel, and cement in the United States; and Shiha, Dorra, and Nassar [21] forecasted construction-material prices in Egypt using neural networks based on macroeconomic indicators. For economies that depend on imported fuel or intermediate inputs, the exchange rate is an additional factor. In developed economies, the transmission of exchange-rate changes to import prices is frequently insufficient [30]. In cases where local vendors price in foreign currency, as in the parallel market in Sudan, a change to local currency pricing could potentially be rapid and nearly complete. Whenever considering nominal prices, it is essential to distinguish the effect of transport expenses from the effect of currency depreciation.
2.4. The Sudanese Macroeconomic Context
- In November 2020, the parallel market rate (approximately SDG 250–260 per US$) was almost five times higher than the official rate of SDG 55 [9], [14]. By the end of January 2021, the parallel rate had dropped to approximately SDG 315 per US$ [14], and by mid-February, to SDG 380-385 [34]. On 21 February 2021, the CBoS established the rates at an indicative SDG 375 per US$ [10], [11] and moved to a managed float in which most transactions were within approximately 10 per cent of the indicative rate, which gradually ranged between about SDG 430 and 447 [9], [35]. Inflation moved from 269.33% in December 2020 to 363% in April 2021, 378.79% in May, and a high of 422.78% in July 2021 [13]–[15], [35]. On 8 June 2021, fuel subsidies were removed, and the price of diesel rose from SDG 125 to SDG 285 per liter and gasoline from SDG 150 to SDG 290 [12]. On 1 July, the price was further adjusted to SDG 305 for diesel and SDG 320 for gasoline [36]. Transport tariffs increased by over 85% in Khartoum and across the country [13].
2.5. Research Gap and Hypotheses
- The existing research shows that inflation and energy and transport costs are factors affecting material prices; however, there are three gaps: (i) the transport component is measured separately for each material very rarely; (ii) there is very little evidence from Sudan and other fragile multiple-exchange-rate economies; and (iii) the role of the conversion basis in measuring price escalation is not currently studied. The study thus examines four hypotheses:• H1: There is a positive and significant relationship between transport cost and material price when each is measured in US dollars.• H2: Association and elasticity are higher for low-value bulk materials (aggregate, sand, red brick) than manufactured materials (cement, steel).• H3: Cost of transport substantially increased after the removal of the fuel subsidy in June 2021.• H4: The measured magnitude of transport cost escalation is significantly dependent on the conversion basis (nominal SDG, market-reflective US$ or official-rate US$).
3. Research Methodology
3.1. Research Design
- A quantitative, longitudinal case study methodology was used. The analytical component is the material-month: five materials monitored during the twelve months of 2021, resulting in a balanced panel of 60 observations per variable. The study was developed in four stages shown in Figure 1: (1) identification of the problem and literature examination resulting in hypotheses H1–H4; (2) gathering and verification of primary and secondary data, encompassing the development of the exchange-rate series; (3) conversion to US dollars and statistical evaluation across four concurrent modules; and (4) testing of hypotheses, interpretation, conclusions, and recommendations.
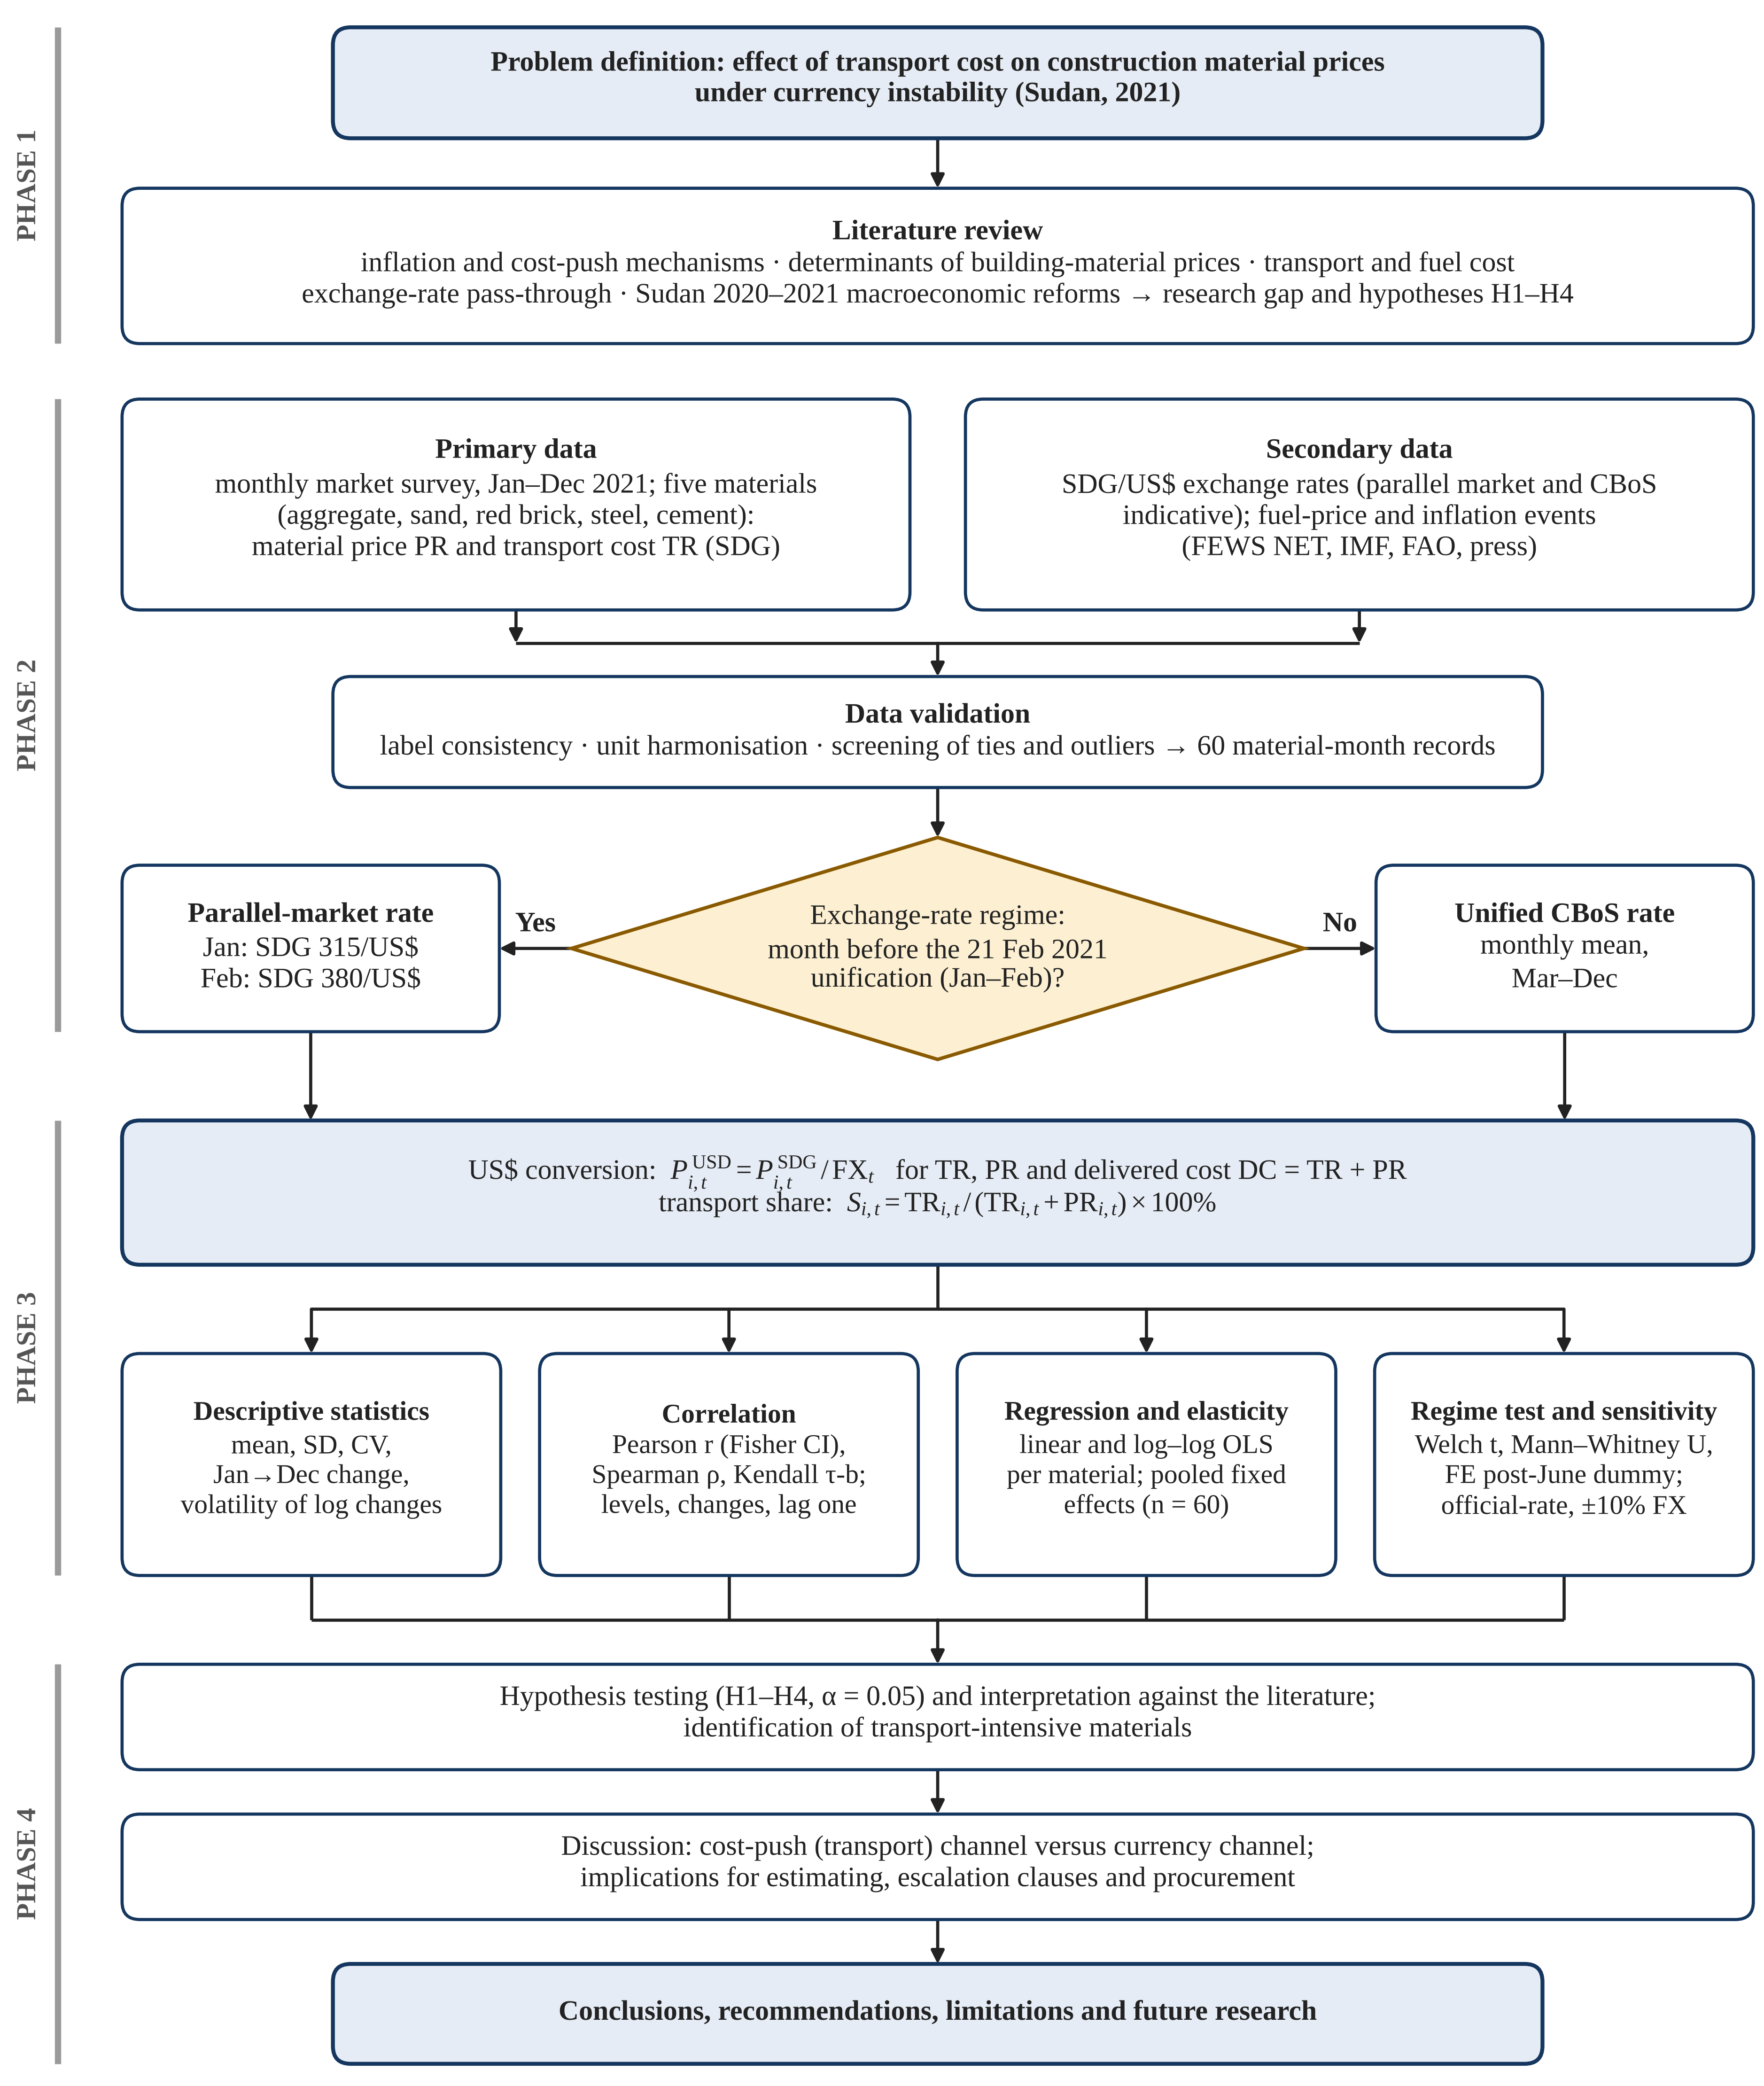 | Figure 1. Research methodology flowchart |
3.2. Data Collection and Validation
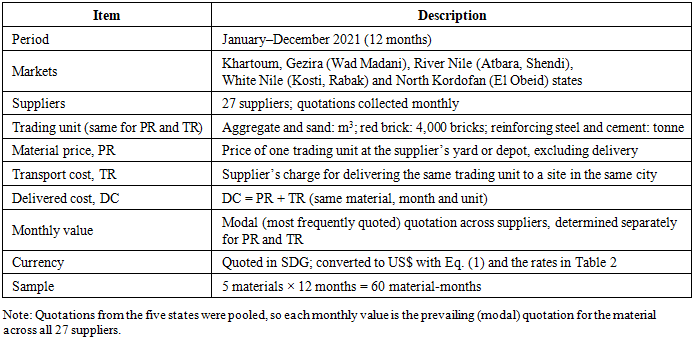
- Monthly prices were collected from January to December 2021 for five materials chosen to span the range of value densities used in Sudanese building construction: two natural bulk materials (aggregate and sand), one locally manufactured material (red brick) and two industrial materials that depend on imported inputs (reinforcing steel and cement). For each material and month two variables were recorded: the material price at source or supplier, excluding delivery (PR), and the transport cost of delivering one trading unit to site (TR). Prices were obtained from Sudanese local markets in Sudan from different cities, and the materials units are: aggregate and sand per meter cube, red brick per 4000 blocks number, steel and cement per tons and the number of supplier was 27 from different locations in Sudan. The analytical results are independent of the unit of measurement due to ratios, correlations, elasticities and percentage changes.The data were checked for completeness, internal consistency and labelling. The column labels in the aforementioned working tables were organised to ensure that TR always denotes transport cost and PR the material price; the delivered cost was calculated as DC = TR + PR. Several series fluctuate in steps and remain flat for several months, as is typical for quoted prices in informal markets. This process generates tied values that were treated with tie-corrected rank statistics.
|
3.3. Exchange-Rate Data and Conversion to US Dollars
- The Sudanese pound was highly unstable in 2021: it was subject to a step devaluation from SDG 55 to SDG 375 per US$ on 21 February, continued depreciation thereafter, and annual inflation of 300–420%. Nominal SDG prices therefore combine real changes in cost with changes in the value of the currency, and a price that is unchanged in pounds may in fact have fallen substantially in real terms. To obtain a stable unit of account, every transport cost and material price was converted into US dollars:
 | (1) |
 | (2) |
3.4. Statistical Analysis
- Descriptive statistics. For each series the mean, standard deviation (s), minimum, maximum, January-to-December percentage change and coefficient of variation were computed, together with volatility measured as the standard deviation of month-on-month logarithmic changes:
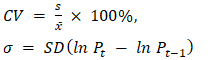 | (3) |
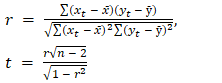 | (4) |
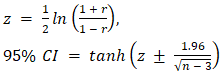 | (5) |
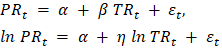 | (6) |
 | (7) |
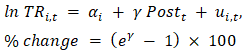 | (8) |
 | (9) |
4. Results
4.1. Exchange-Rate Path in 2021
- The exchange-rate series are shown in table 2 and figure 2. The market reflective rate depreciated from SDG 315 per US$ in January to SDG 437.45 in December (+38.9%), with the highest value recorded at SDG 448.03 in July and a coefficient of variation of 9.9%. The official rate climbed +691% (coefficient of variation 39.8%) during the same period, due almost entirely to the February unification. The two series are the same from March onwards.
|
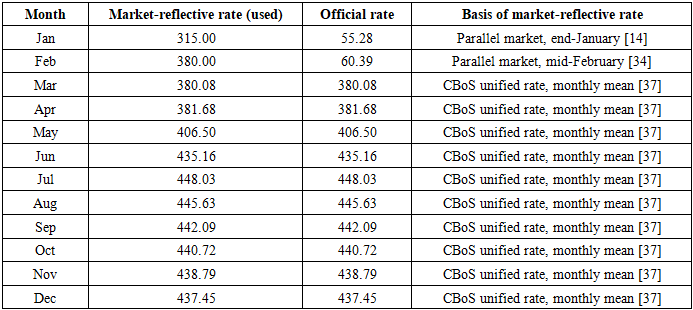
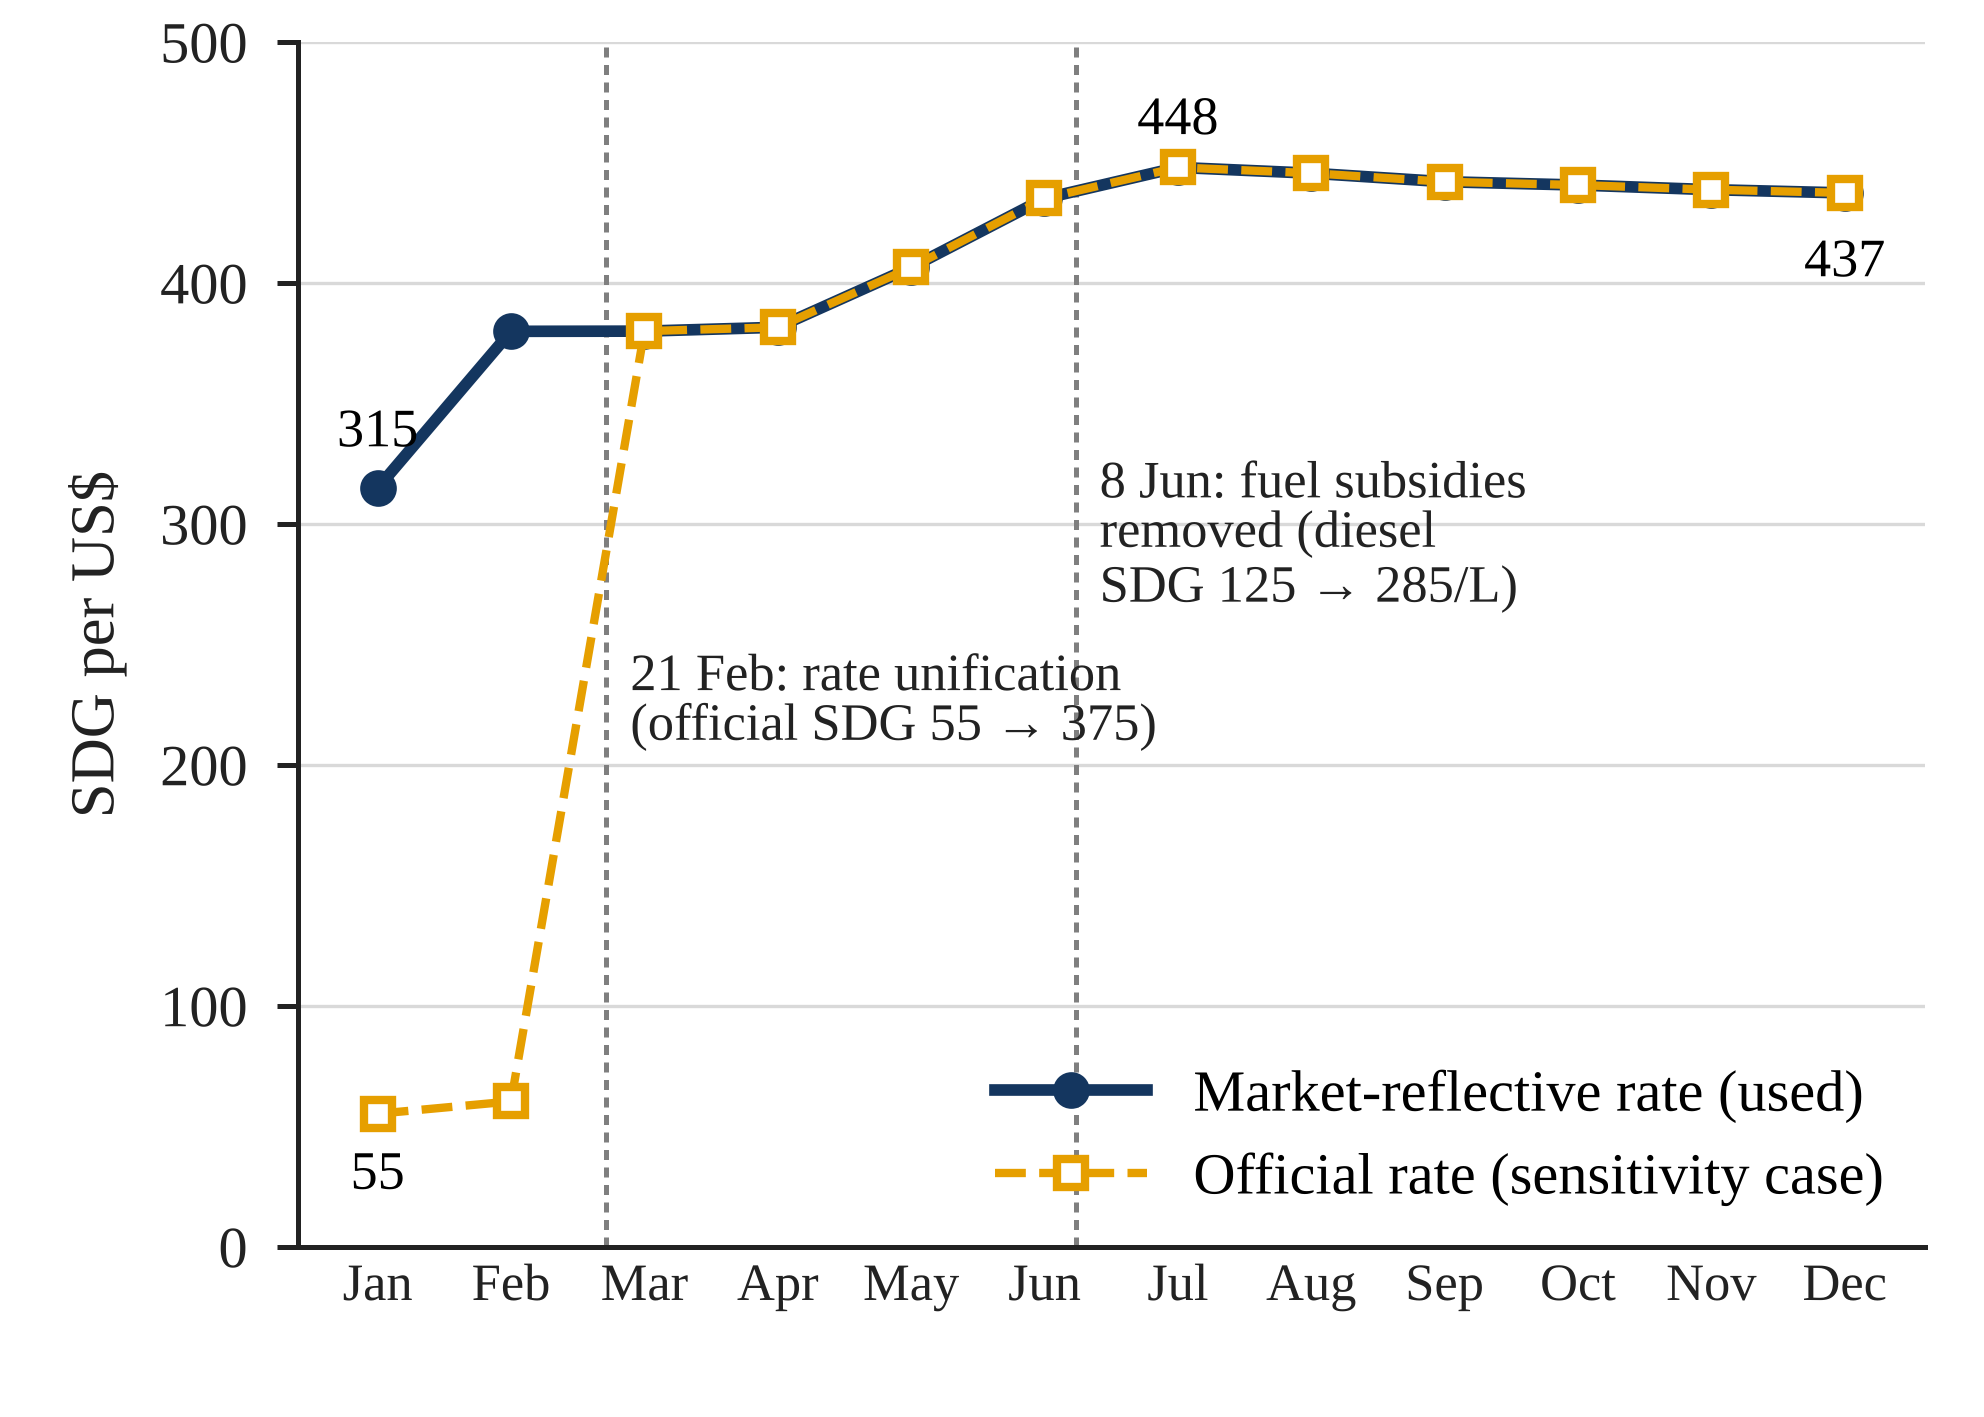 | Figure 2. SDG per US$ in 2021: market-reflective series used in this study and official series (the two coincide from March) |
4.2. Transport Cost in US Dollars
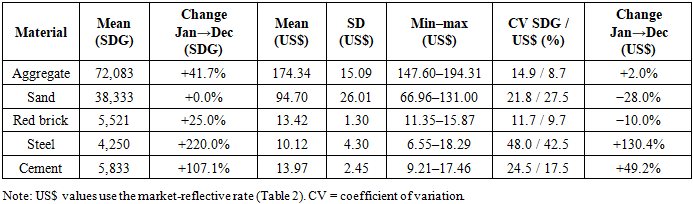
- Figure 3 presents the monthly transport cost of each material in US dollars, and Table 3 compares the SDG and US$ statistics. Expressed in dollars, the transport cost of steel more than doubled (+130.4%) and that of cement rose by +49.2%, while aggregate was almost unchanged (+2.0%), red brick fell by 10.0% and sand by 28.0%. In nominal pounds, by contrast, every material except sand showed large increases (aggregate +41.7%, red brick +25.0%, cement +107.1%, steel +220.0%). Conversion to US$ also reduced the dispersion of transport cost over the year for four of the five materials (coefficient of variation: aggregate 14.9% → 8.7%, red brick 11.7% → 9.7%, steel 48.0% → 42.5%, cement 24.5% → 17.5%), confirming that much of the nominal variation reflected the currency rather than haulage itself. Sand is the exception: its nominal transport cost ended the year where it started, so conversion added the effect of depreciation (21.8% → 27.5%).
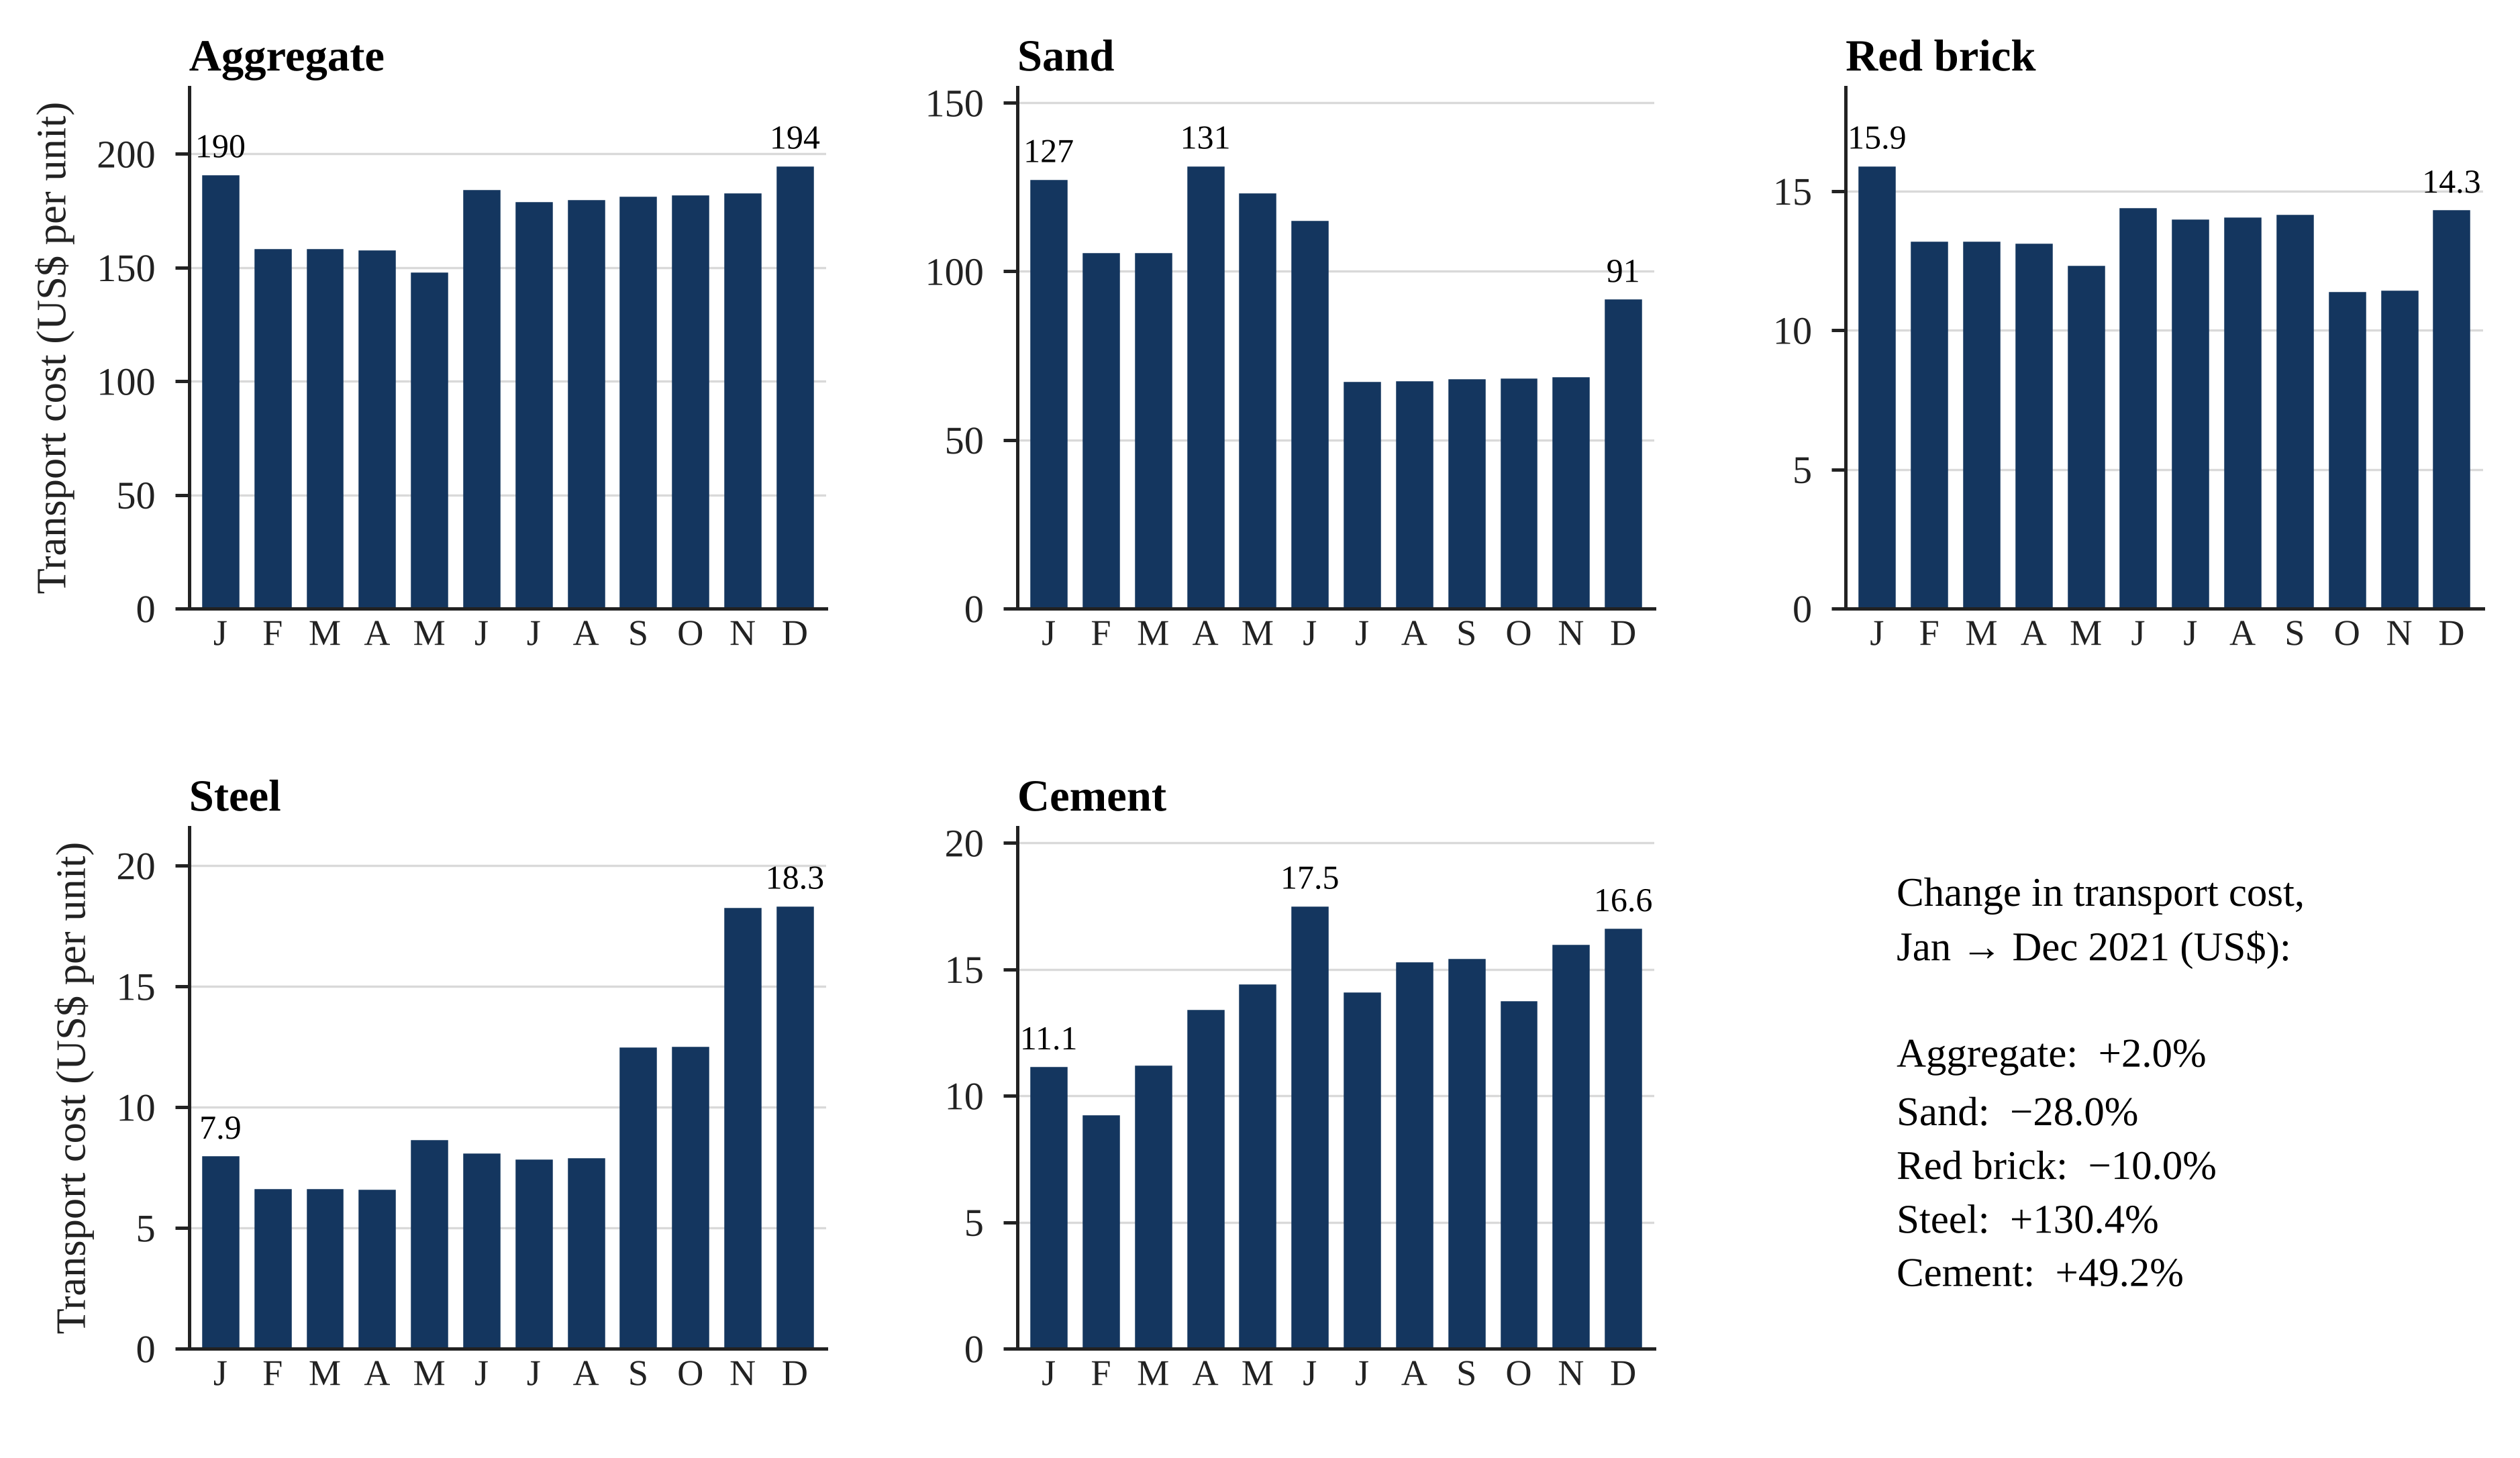 | Figure 3. Monthly transport cost of each material in US$ per trading unit, 2021 (market-reflective rate) |
|
4.3. Material Prices in US Dollars
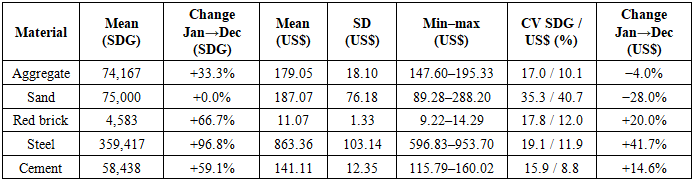
- Table 4 summarises material prices. In US$, the price of steel rose by +41.7% (from US$596.83 to US$845.82 per unit, peaking in Aug), red brick by +20.0% and cement by +14.6%, whereas aggregate was broadly stable (−4.0%) and sand fell by 28.0%. Sand was the most volatile series (monthly log-change SD 32.4%), with a sharp fall between July and September followed by a recovery in December.
|
4.4. Share of Transport in Delivered Cost
- Transport intensity differed by more than an order of magnitude between materials as demonstrated in Table 5; Figures 4 and 5. Transport accounted for 54.6% of the delivered cost of red brick, 49.3% for aggregate and 33.8% for sand, however only 9.1% for cement and 1.2% for steel. For red brick and aggregate, transportation cost was on average roughly equal to or larger than the price of the materials (TR/PR ratios of 1.20 and 0.97). The proportion was stable for aggregate (48.5–51.5%) but nevertheless increased for sand to 42.9% in July–September, when the material price dropped faster than transportation, and for cement it peaked at 10.9% in June, the month of the fuel subsidy removal. For steel the proportion increased from 1.3% in January to 2.1% in December but instead remained marginal.
|
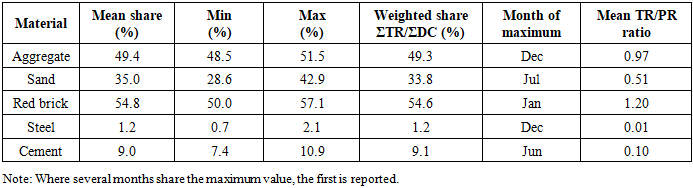
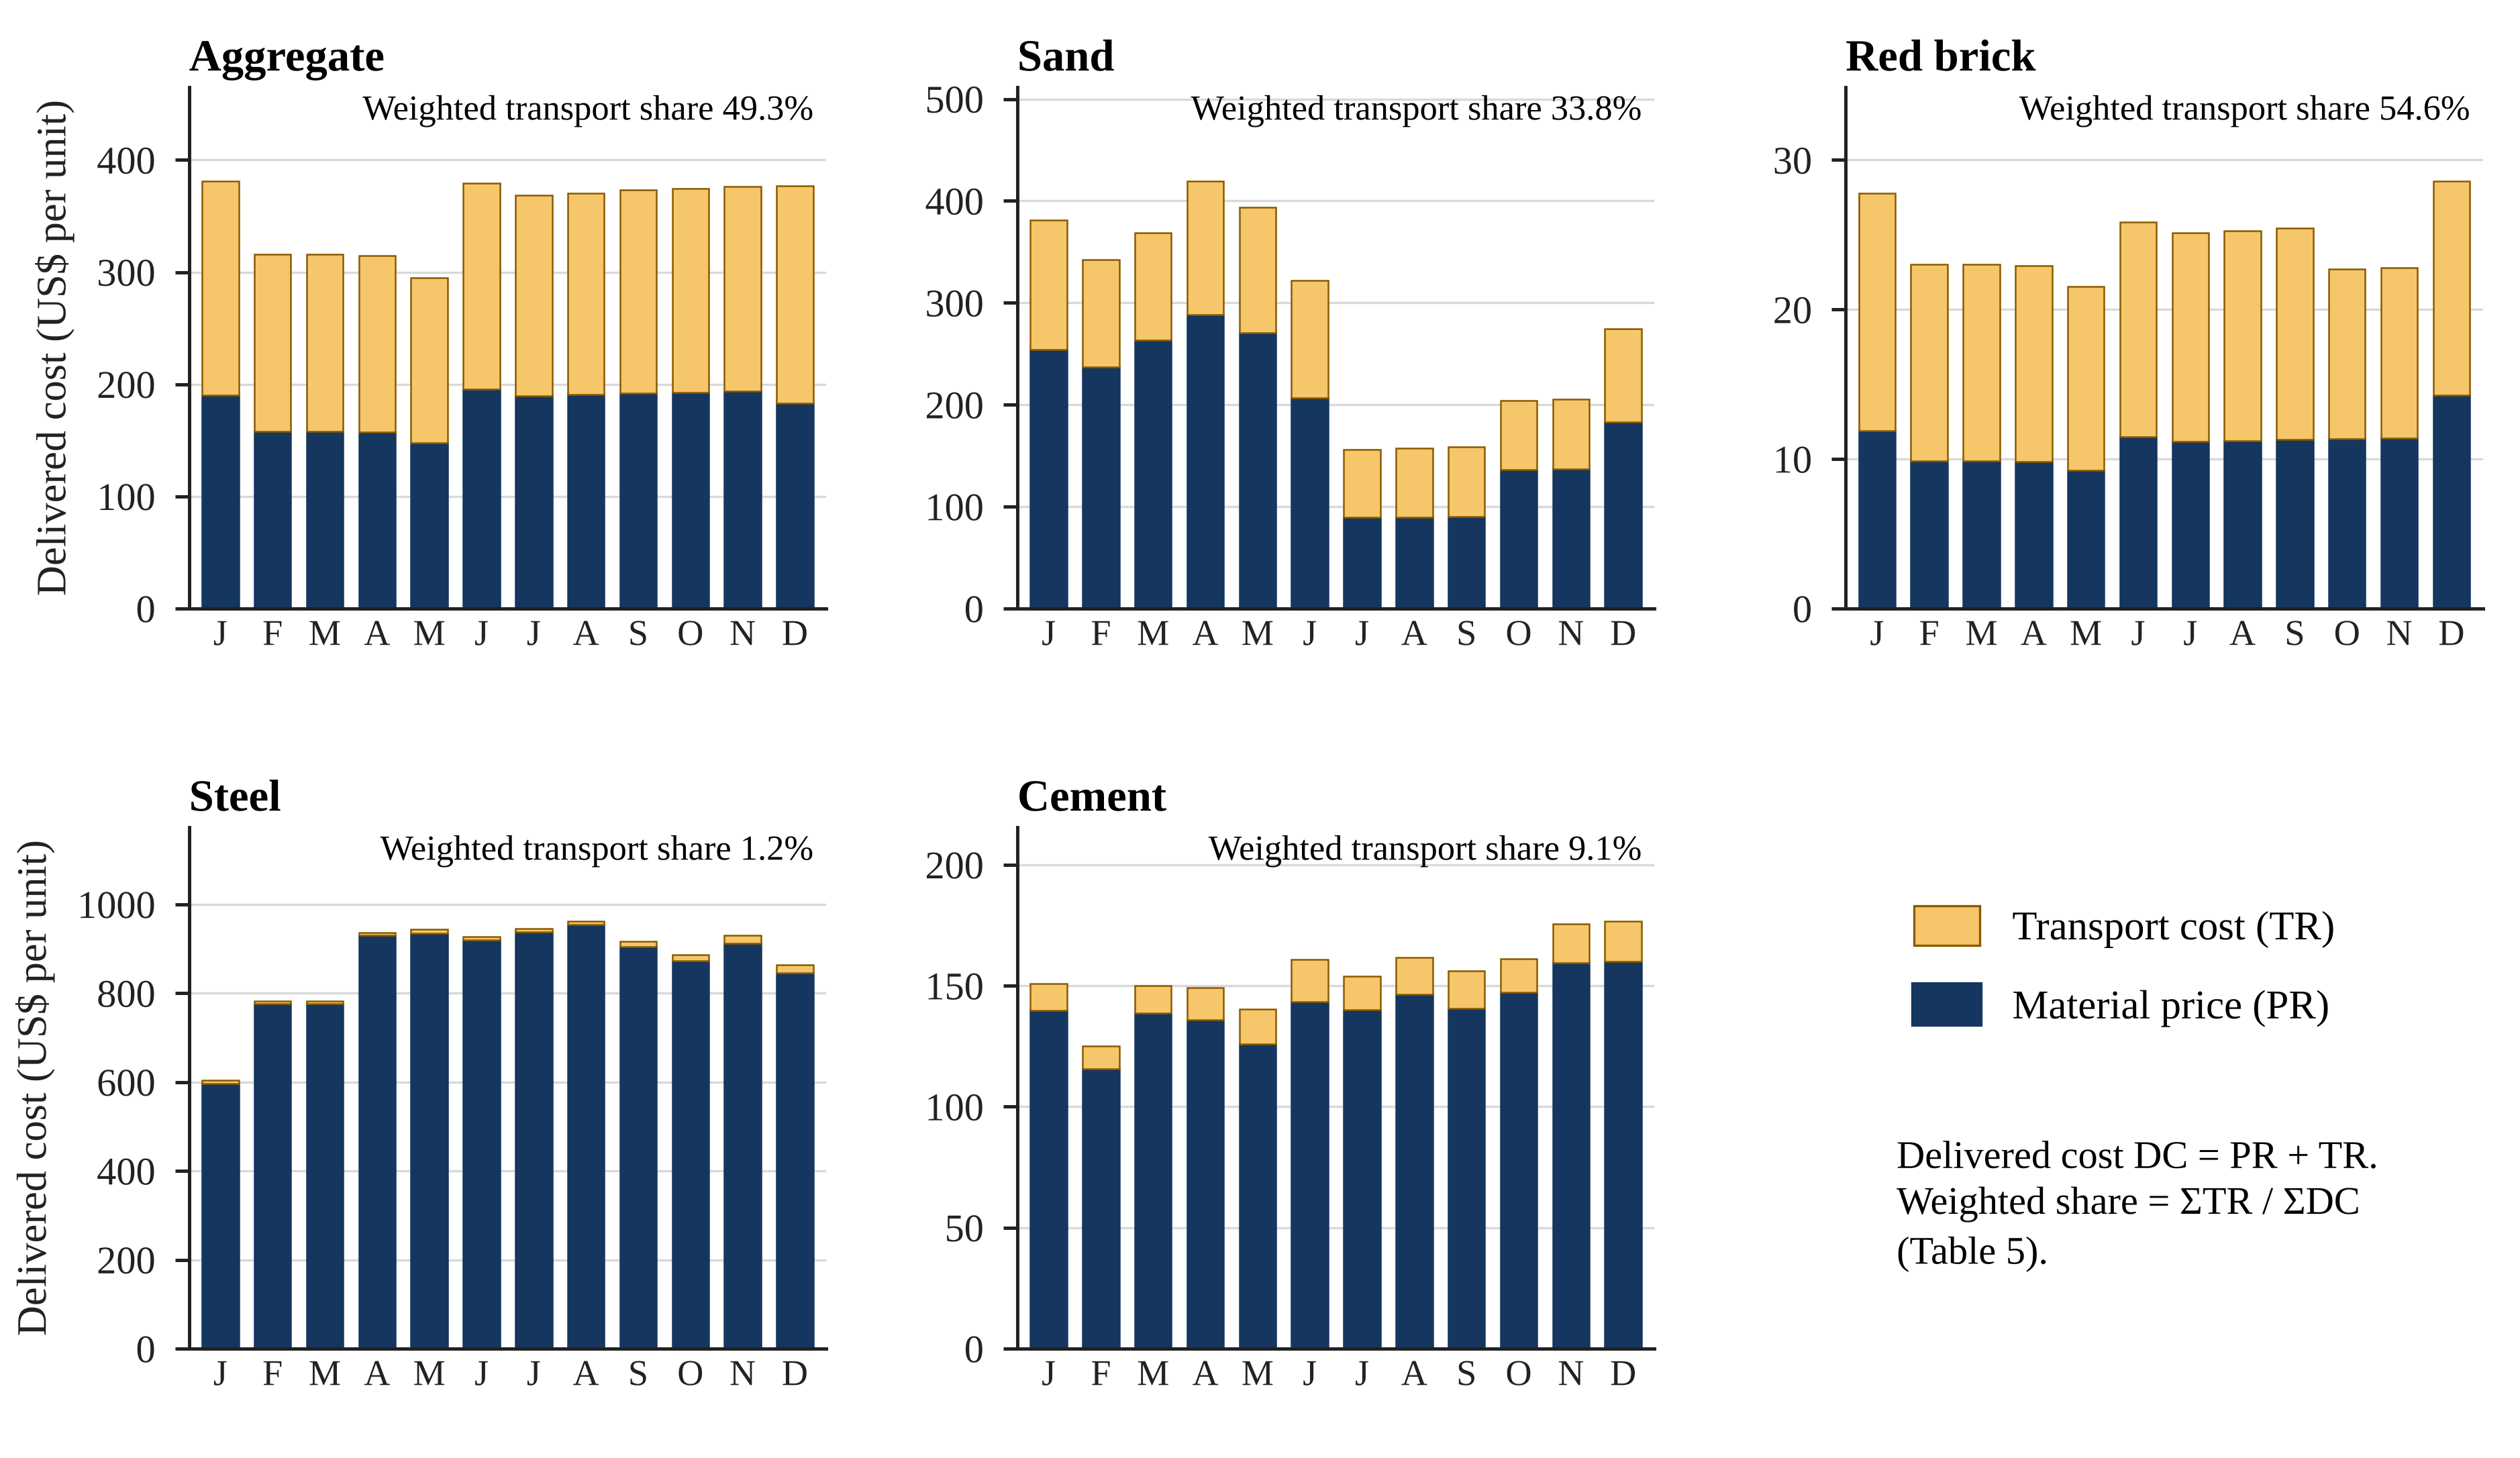 | Figure 4. Composition of delivered cost (material price + transport cost) in US$ per trading unit, 2021 |
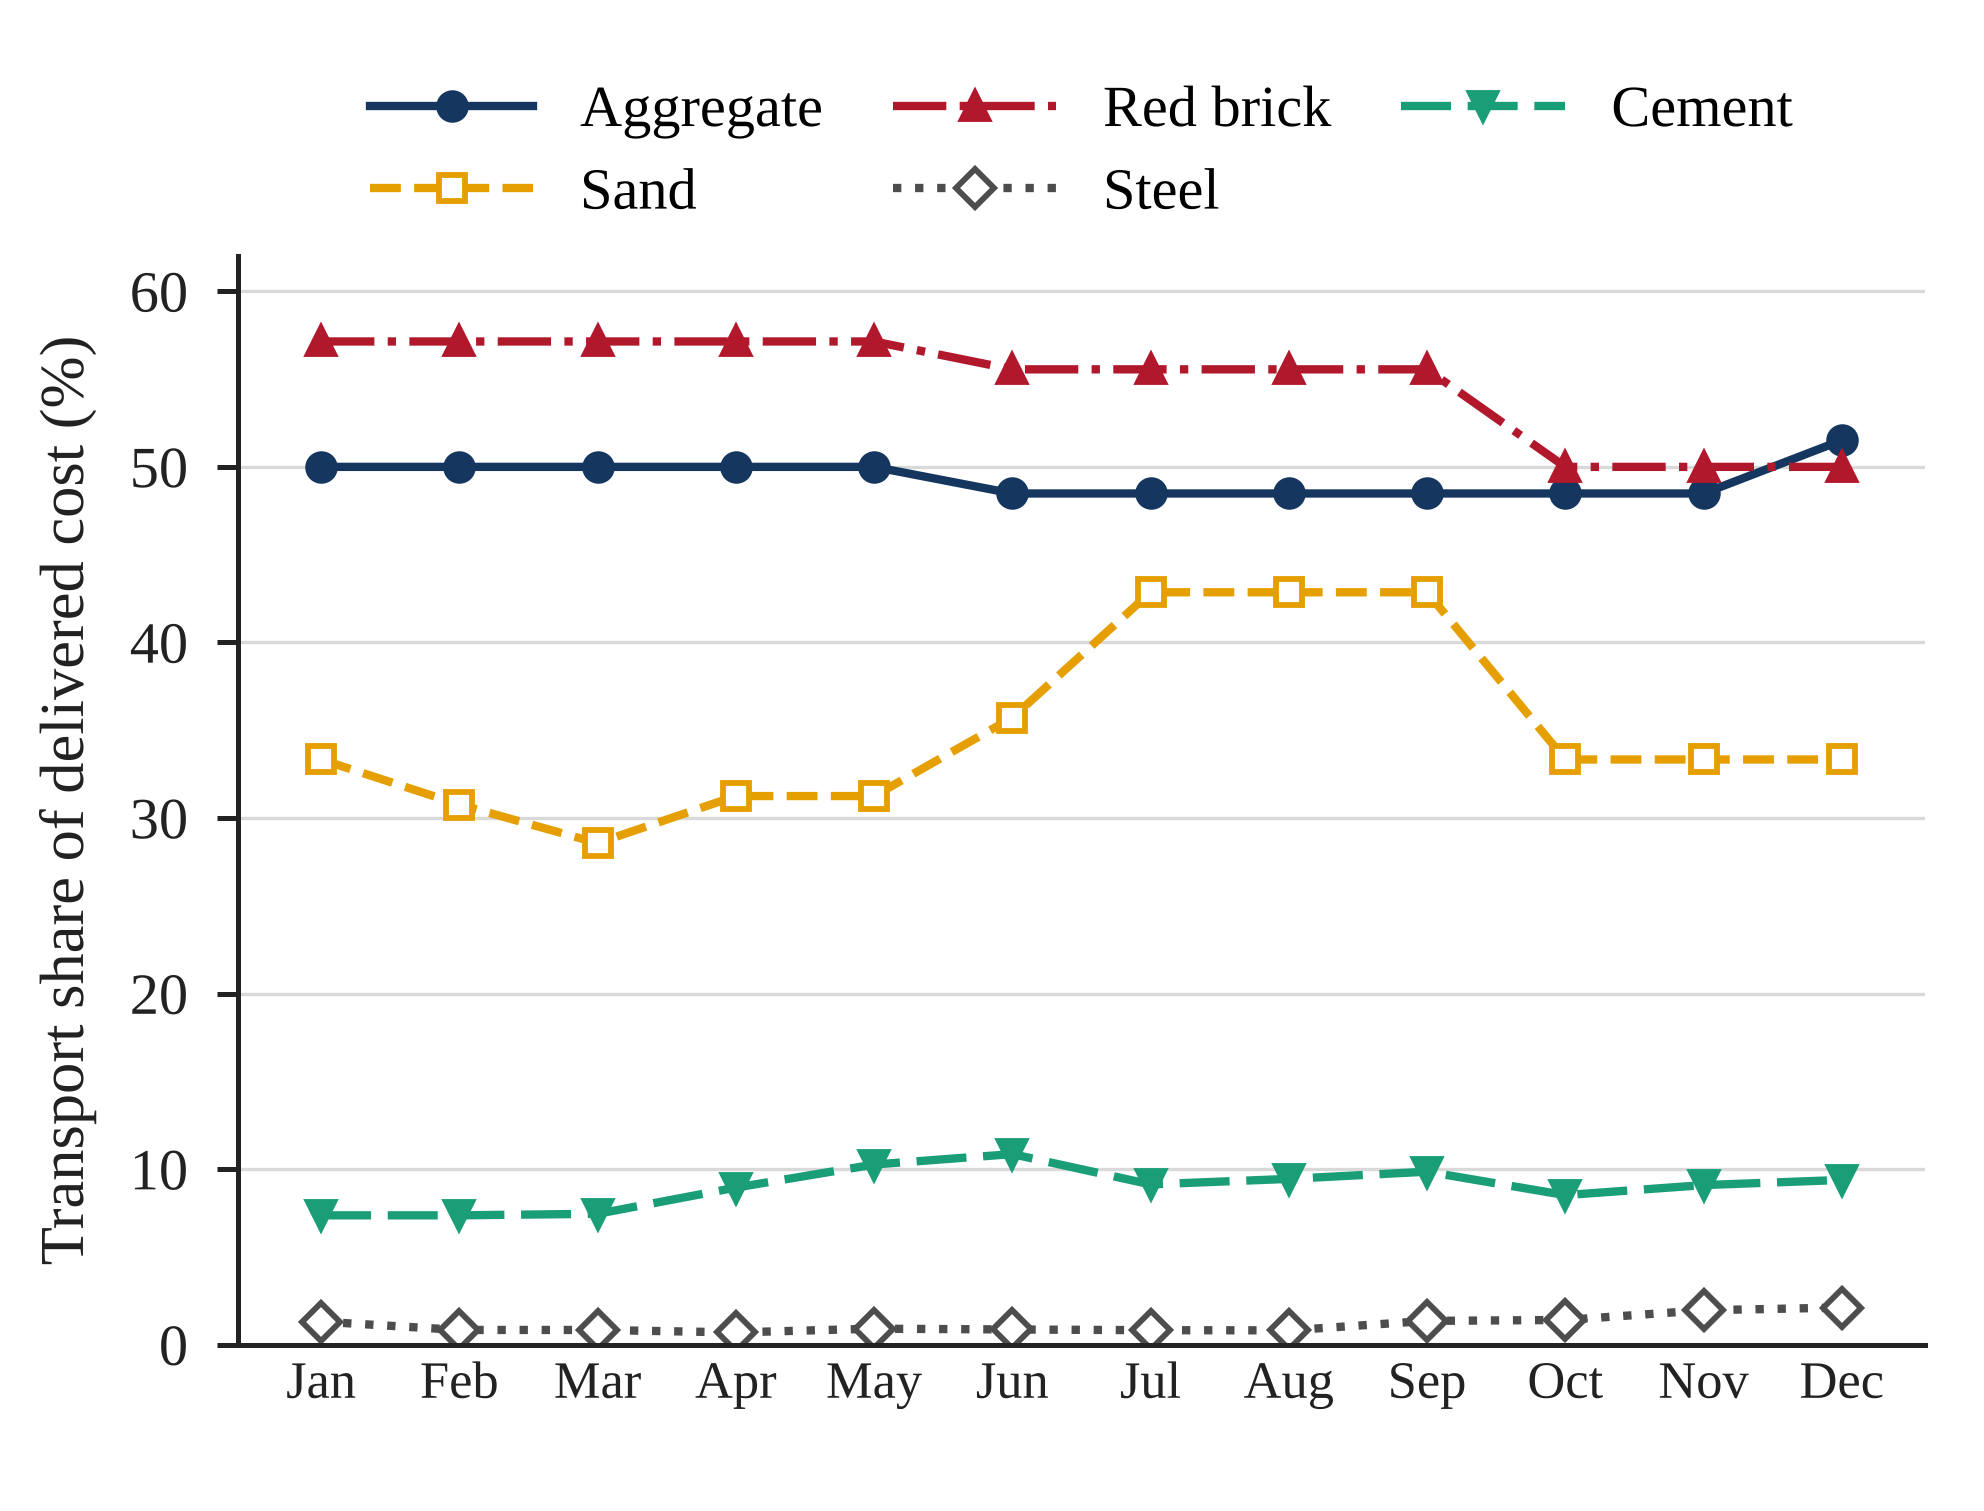 | Figure 5. Monthly transport share of delivered cost by material, 2021 |
4.5. Nominal versus US$ Escalation of Transport Cost
- Figure 6 indexes transport cost to January = 100 in SDG and in US$. In every case the US$ index lies below the SDG index for most of the year, and the gap widens after the February unification. For aggregate, the nominal index rose to 141.7 in December, however the US$ index returned to 102.0: the 33% nominal step in June merely restored the dollar value of haulage that had been eroded by depreciation. For cement and steel, by contrast, the US$ index also rose substantially, indicating a genuine increase in real haulage cost.
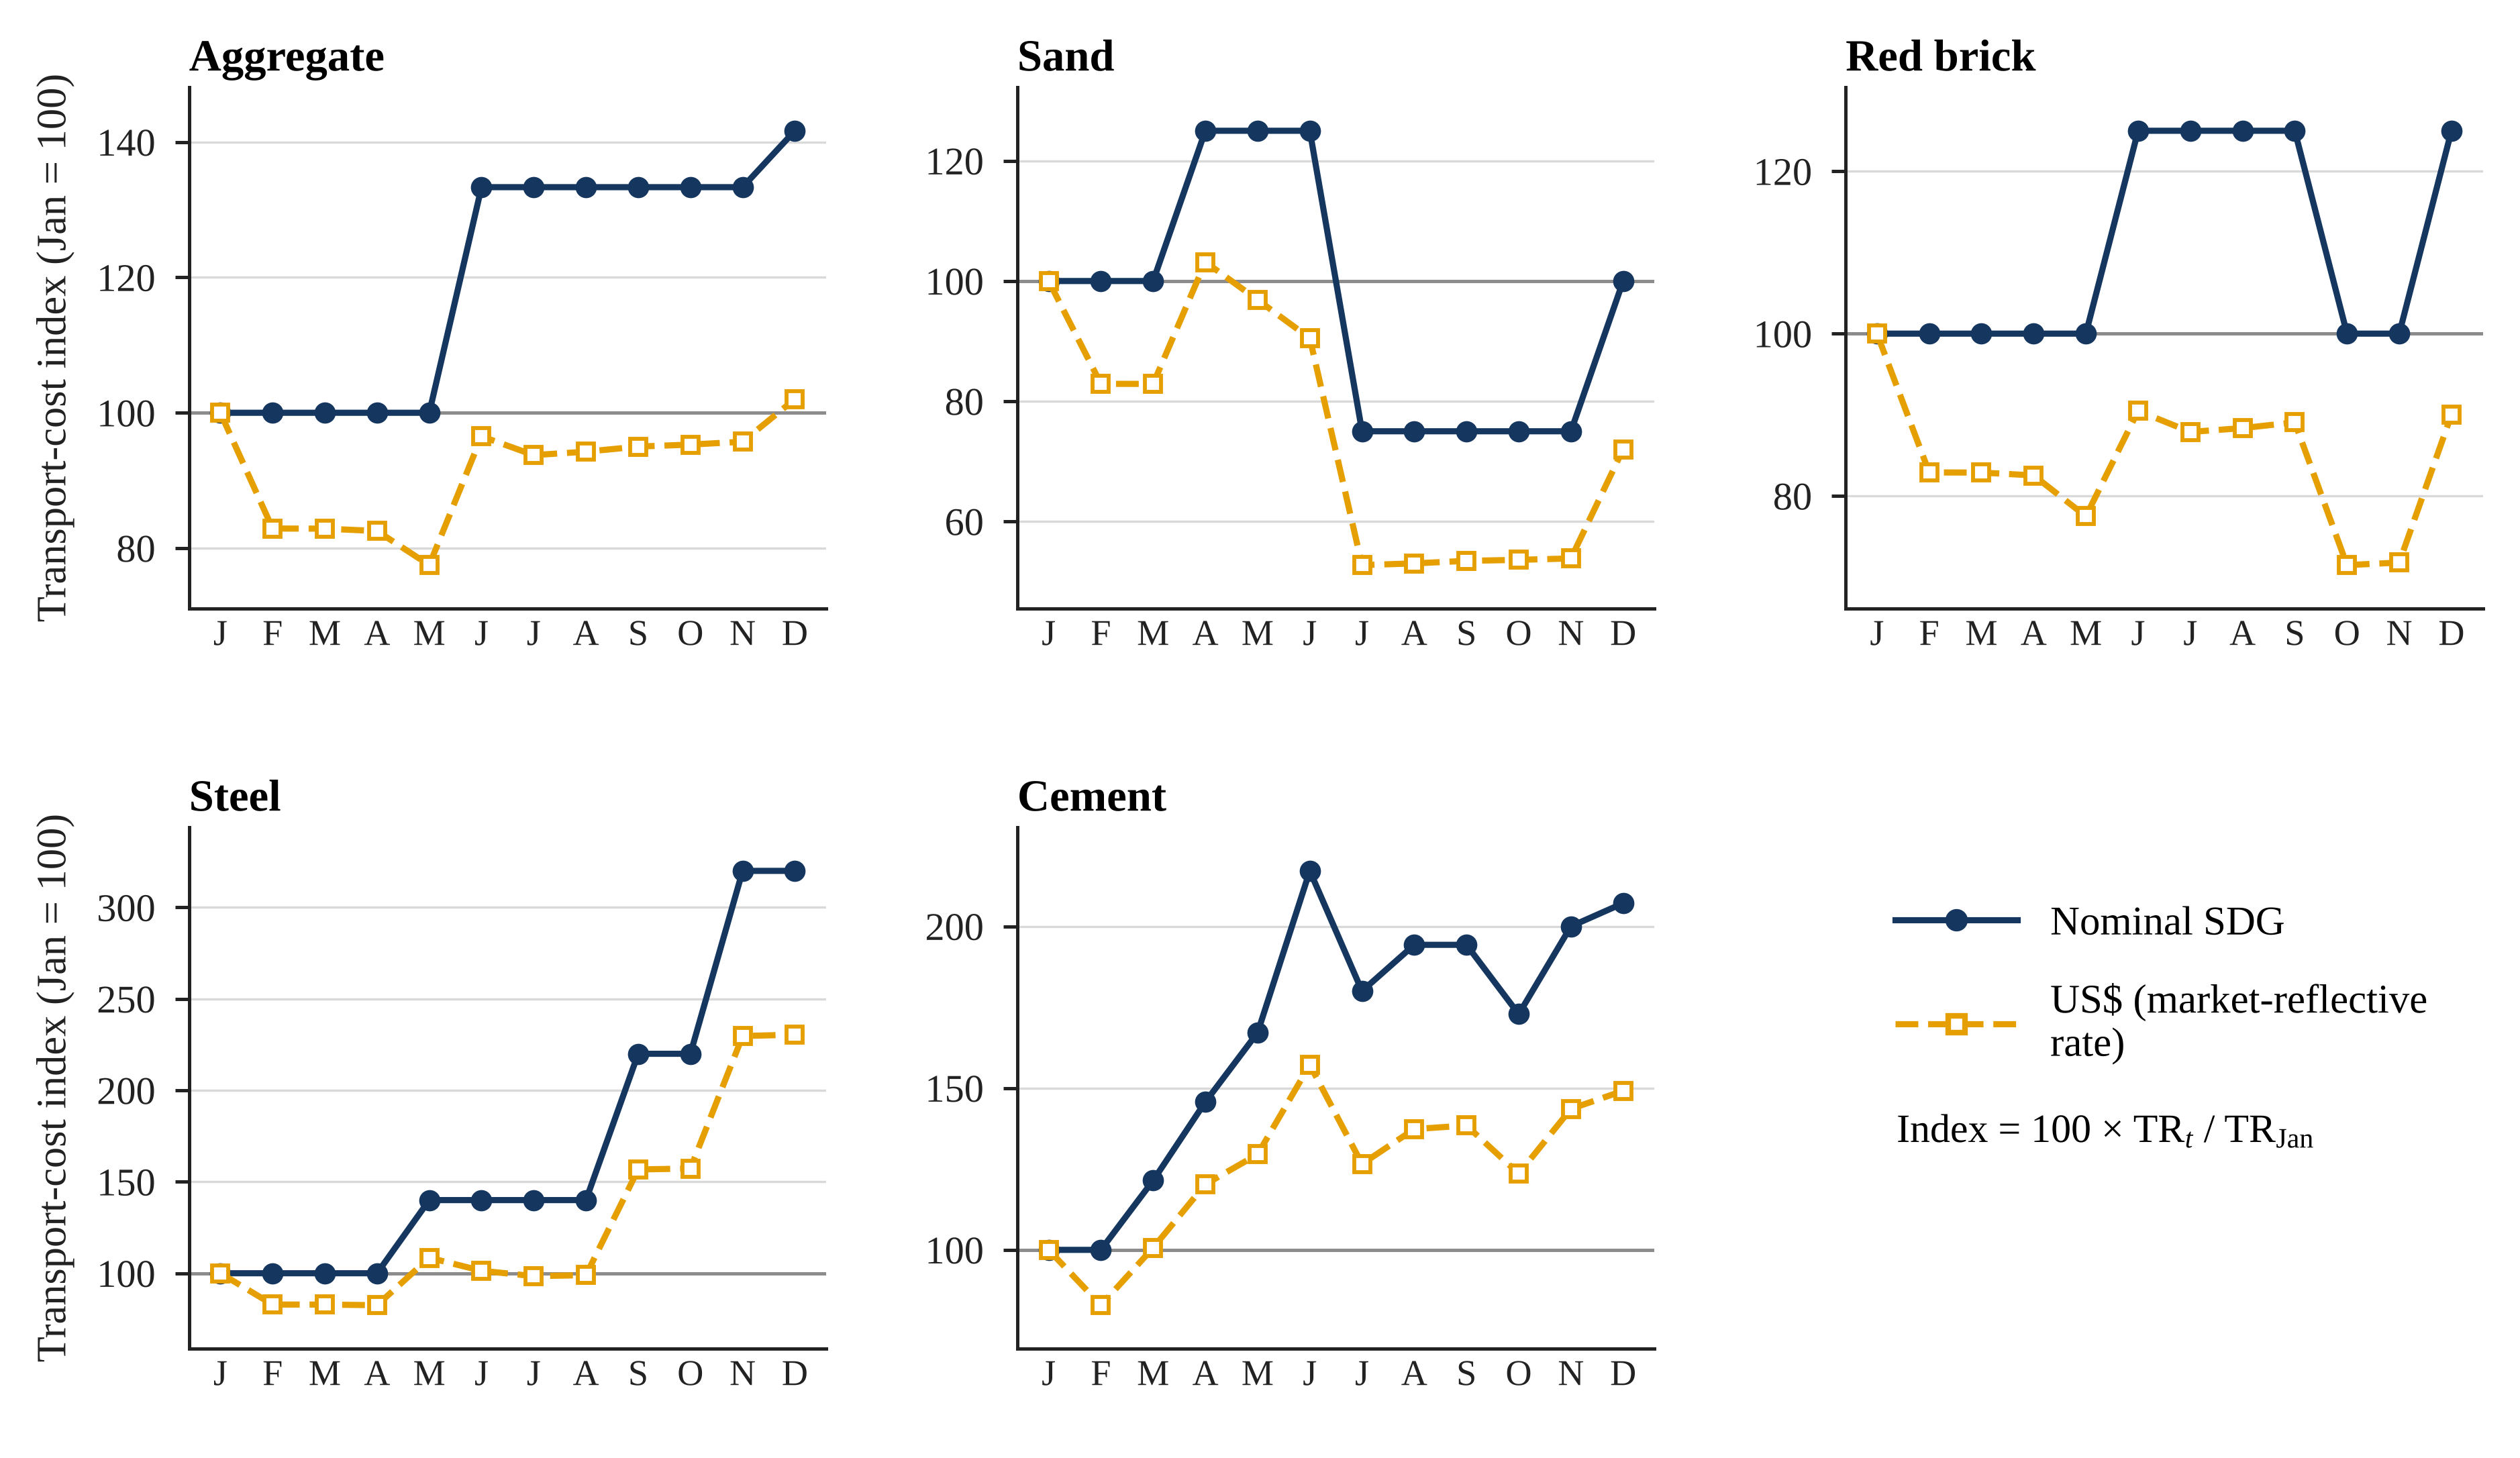 | Figure 6. Transport-cost index (January = 100) in nominal SDG and in US$, 2021 |
4.6. Correlation between Transport Cost and Material Price
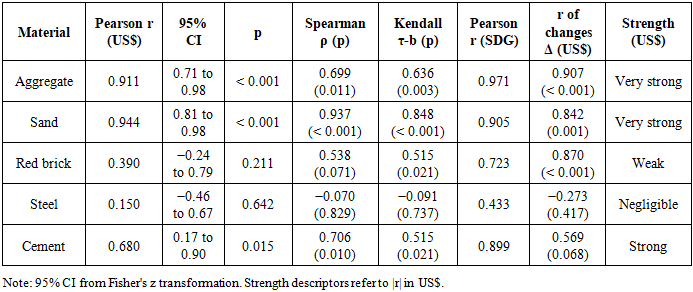
- Table 6 and Figures 7 and 8 report the correlation results. In US$ terms, the relationship between transport cost and material price was very strong and significant for sand (r = 0.944, p < 0.001) and aggregate (r = 0.911, p < 0.001), strong and significant for cement (r = 0.680, p = 0.015), weak and non-significant for red brick (r = 0.390, p = 0.211) and negligible for steel (r = 0.150, p = 0.642). The rank-based coefficients confirm the pattern (Spearman ρ = 0.937 for sand, 0.699 for aggregate, 0.706 for cement), and Kendall's τ-b is significant for all materials except steel.
|
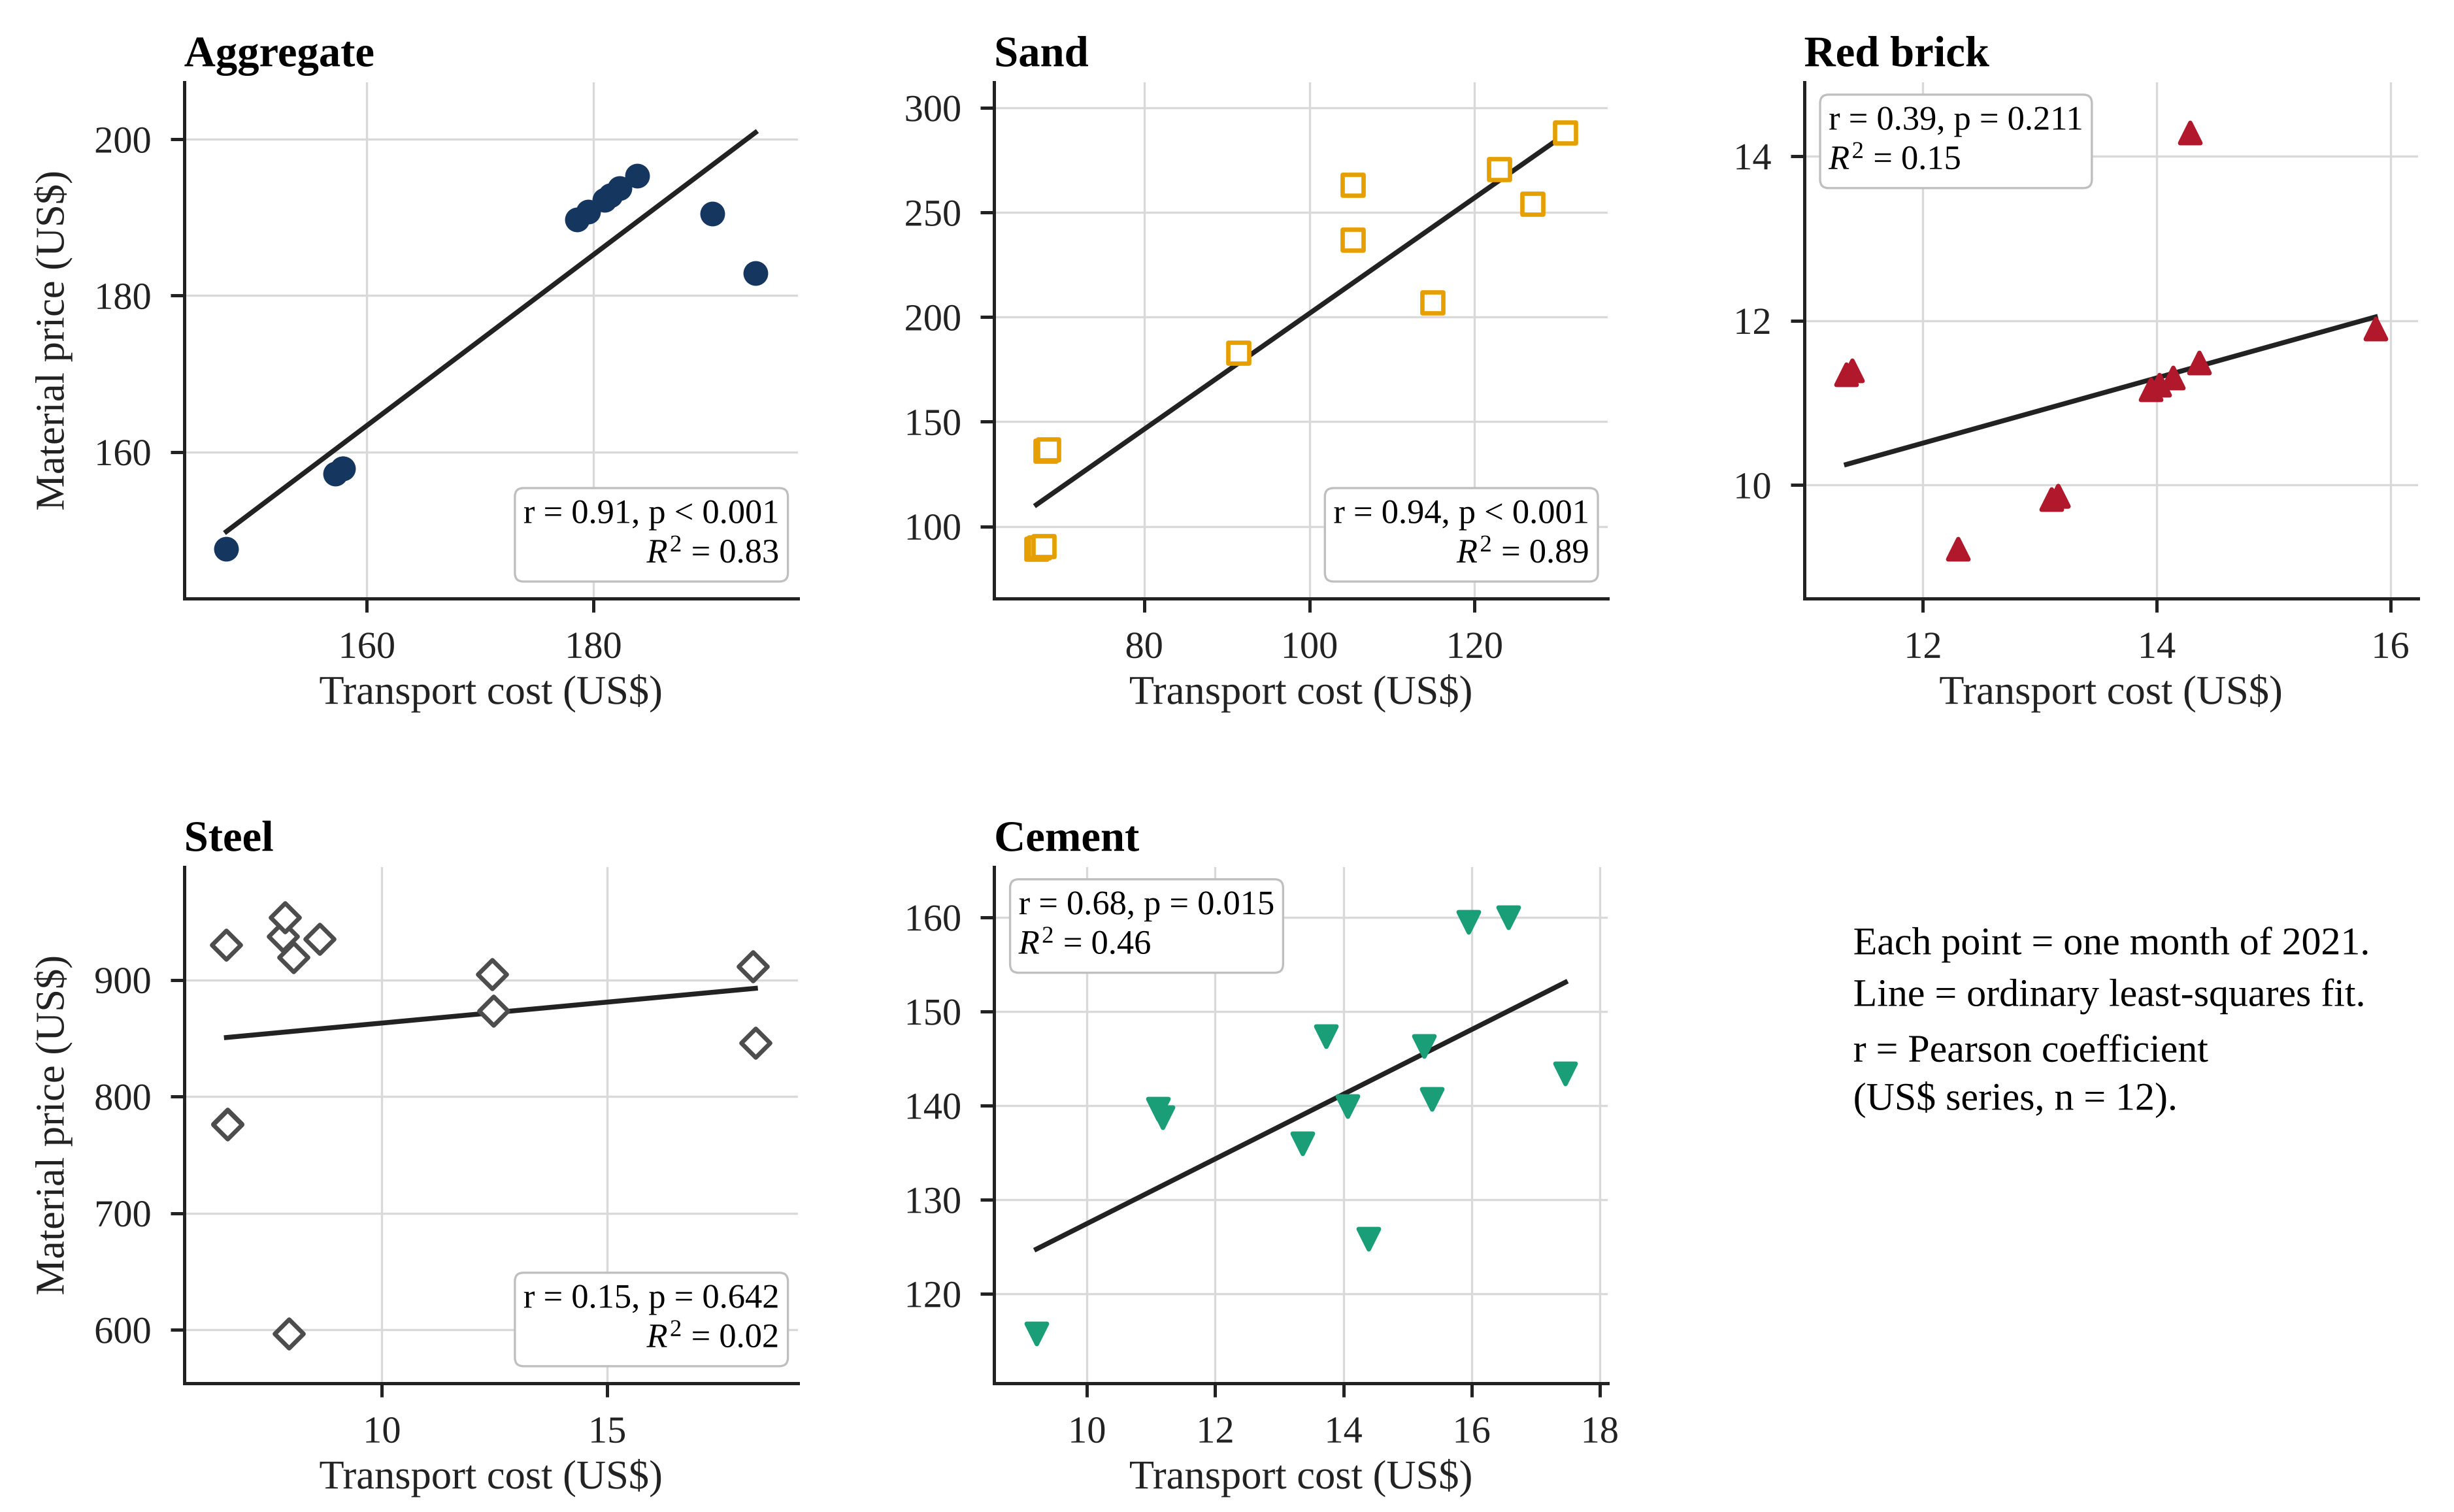 | Figure 7. Material price versus transport cost in US$ with ordinary least-squares fit, 2021 |
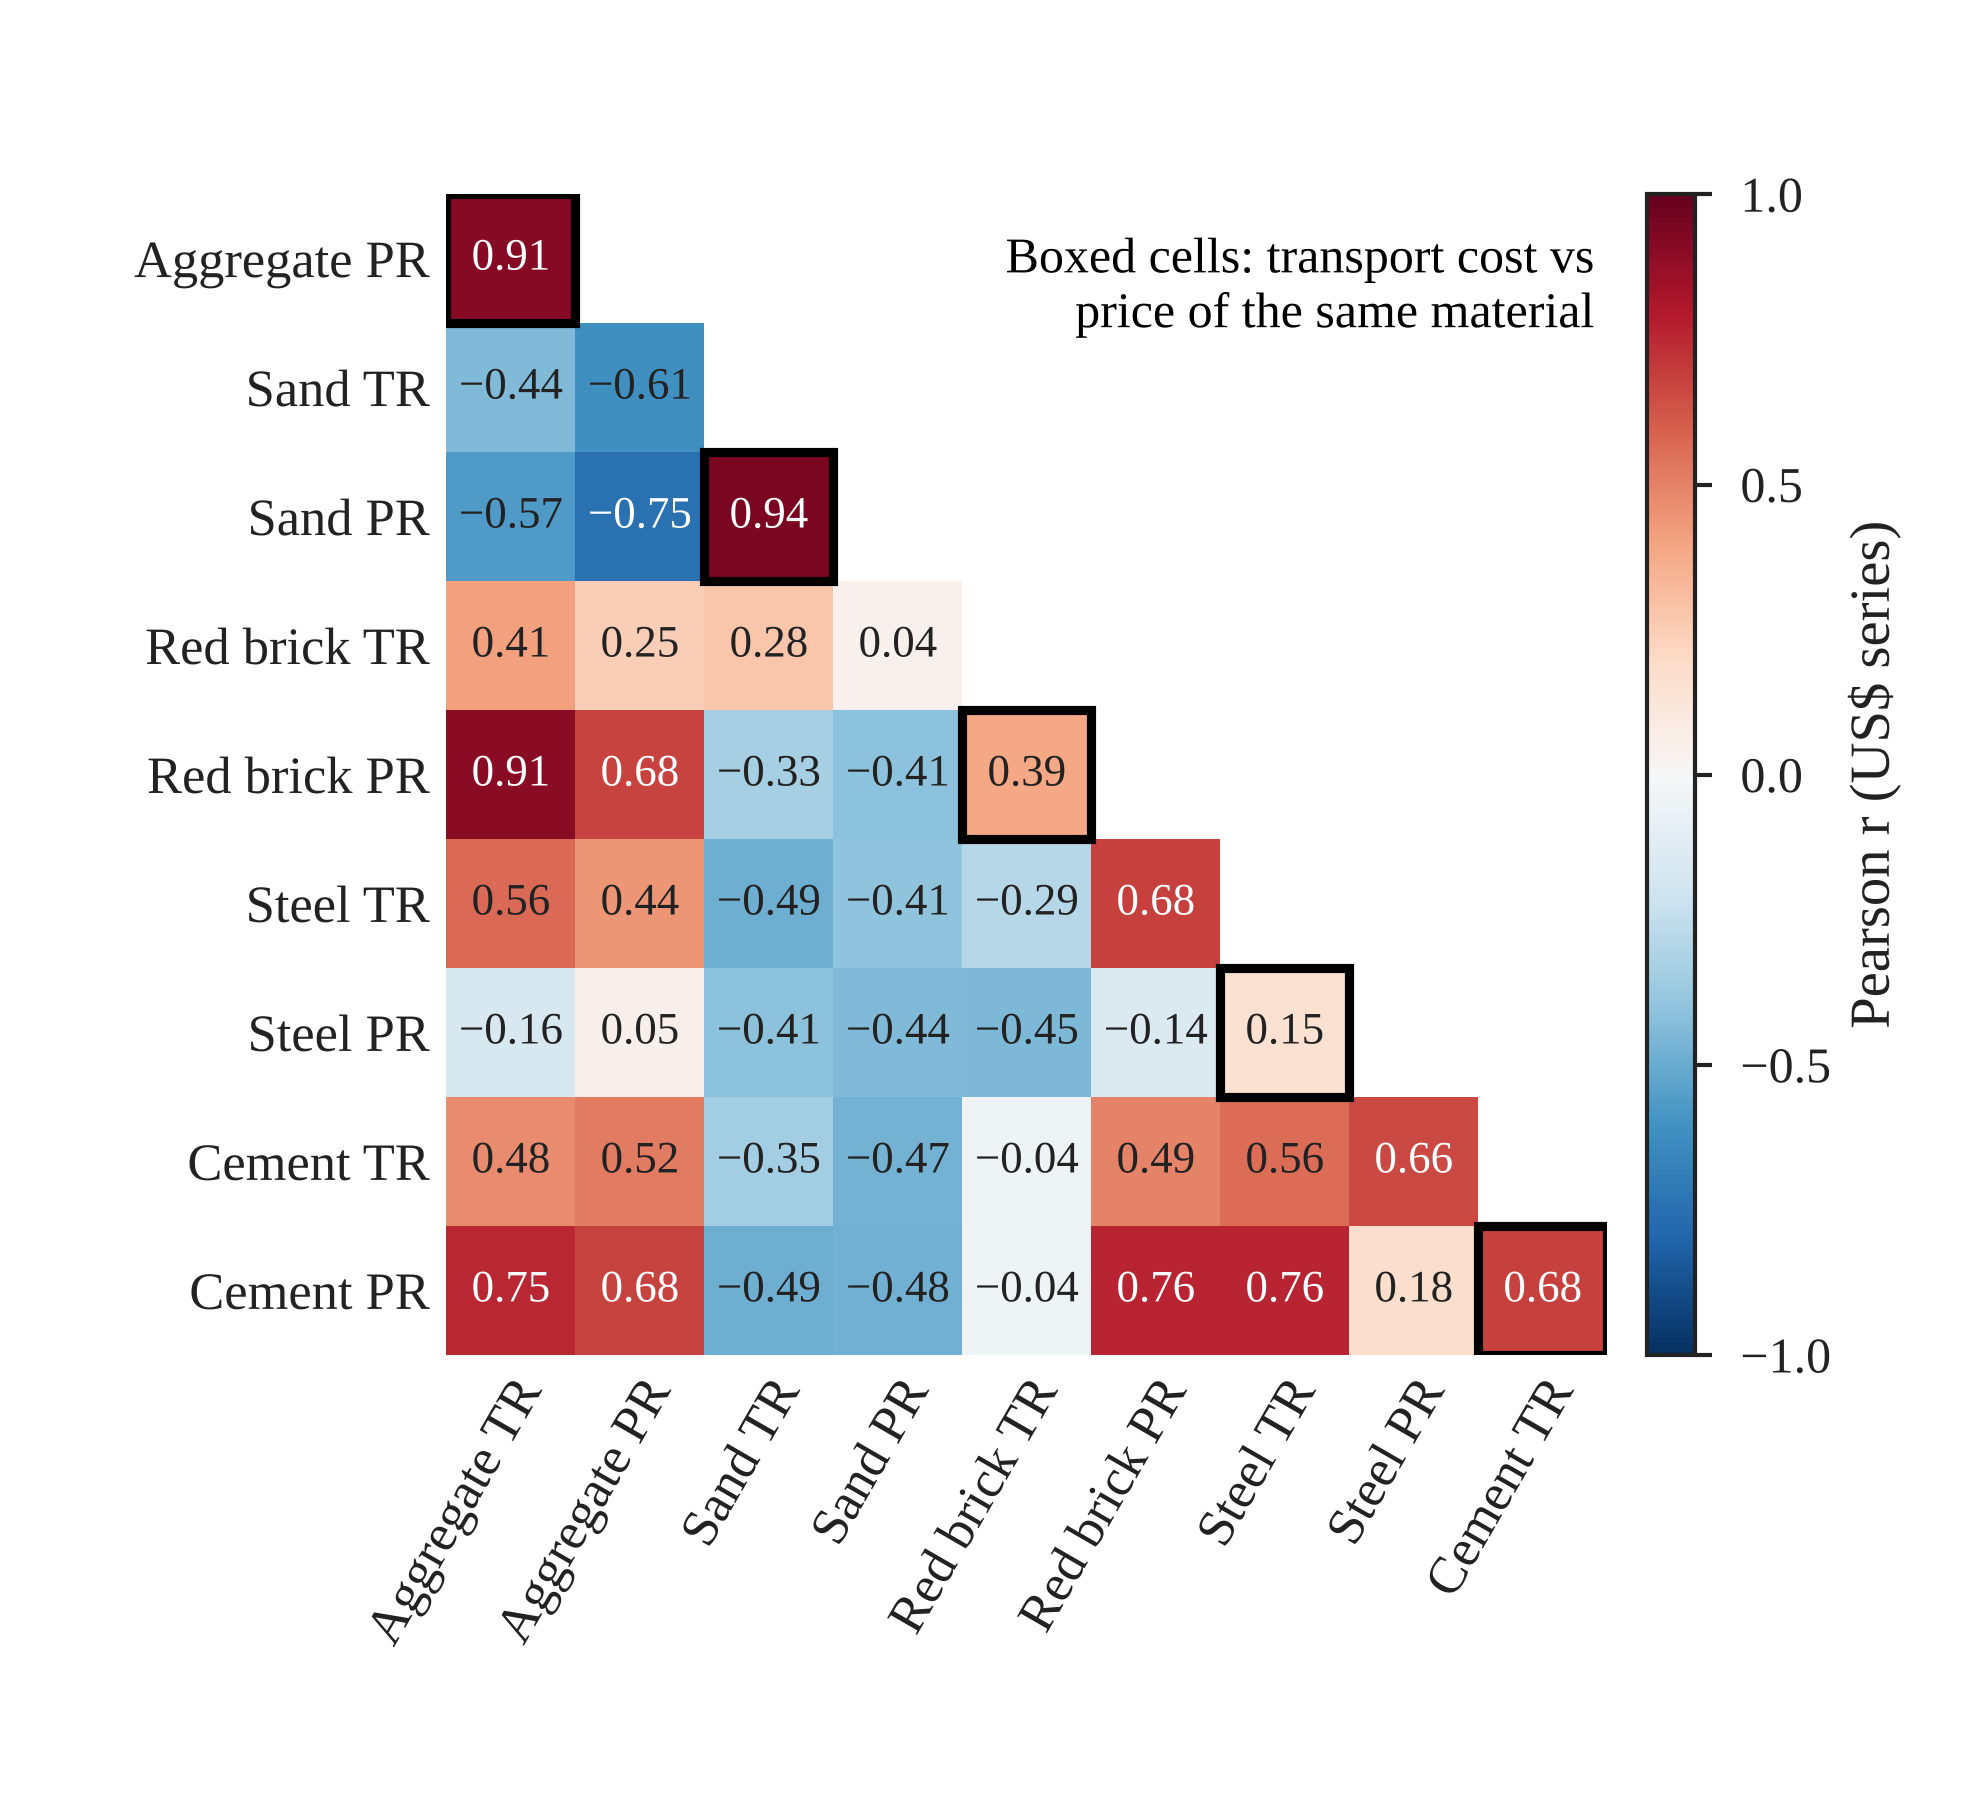 | Figure 8. Pearson correlation matrix of all transport-cost and material-price series in US$ |
4.7. Regression and Elasticity
- The regression results are in Table 7 and Figure 9. Each additional US dollar of transport cost was associated with US$1.09 of additional aggregate price (R2 = 0.83) and US$2.77 of additional sand price (R2 = 0.89). The elasticity was 1.53 for sand, 1.10 for aggregate (indicating that a 10% increase in transportation cost coincided with approximately 15% and 11% increases in material price), and 0.33 for cement (p = 0.012). The elasticities of red brick (0.44) and steel (0.06) were neither statistically significant. The fixed-effects elasticity averaged across all 60 material months was 0.565 (SE 0.109, t = 5.21, p < 0.001; within R² = 0.334): a 10% rise in transport expenses was associated with an average 5.7% rise in material prices.
|
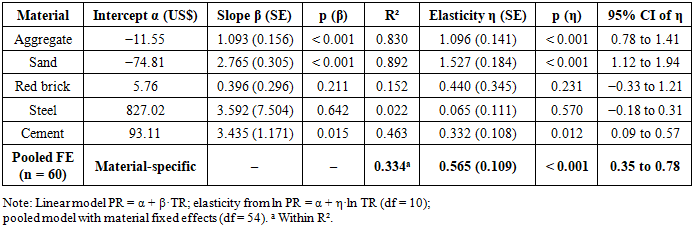
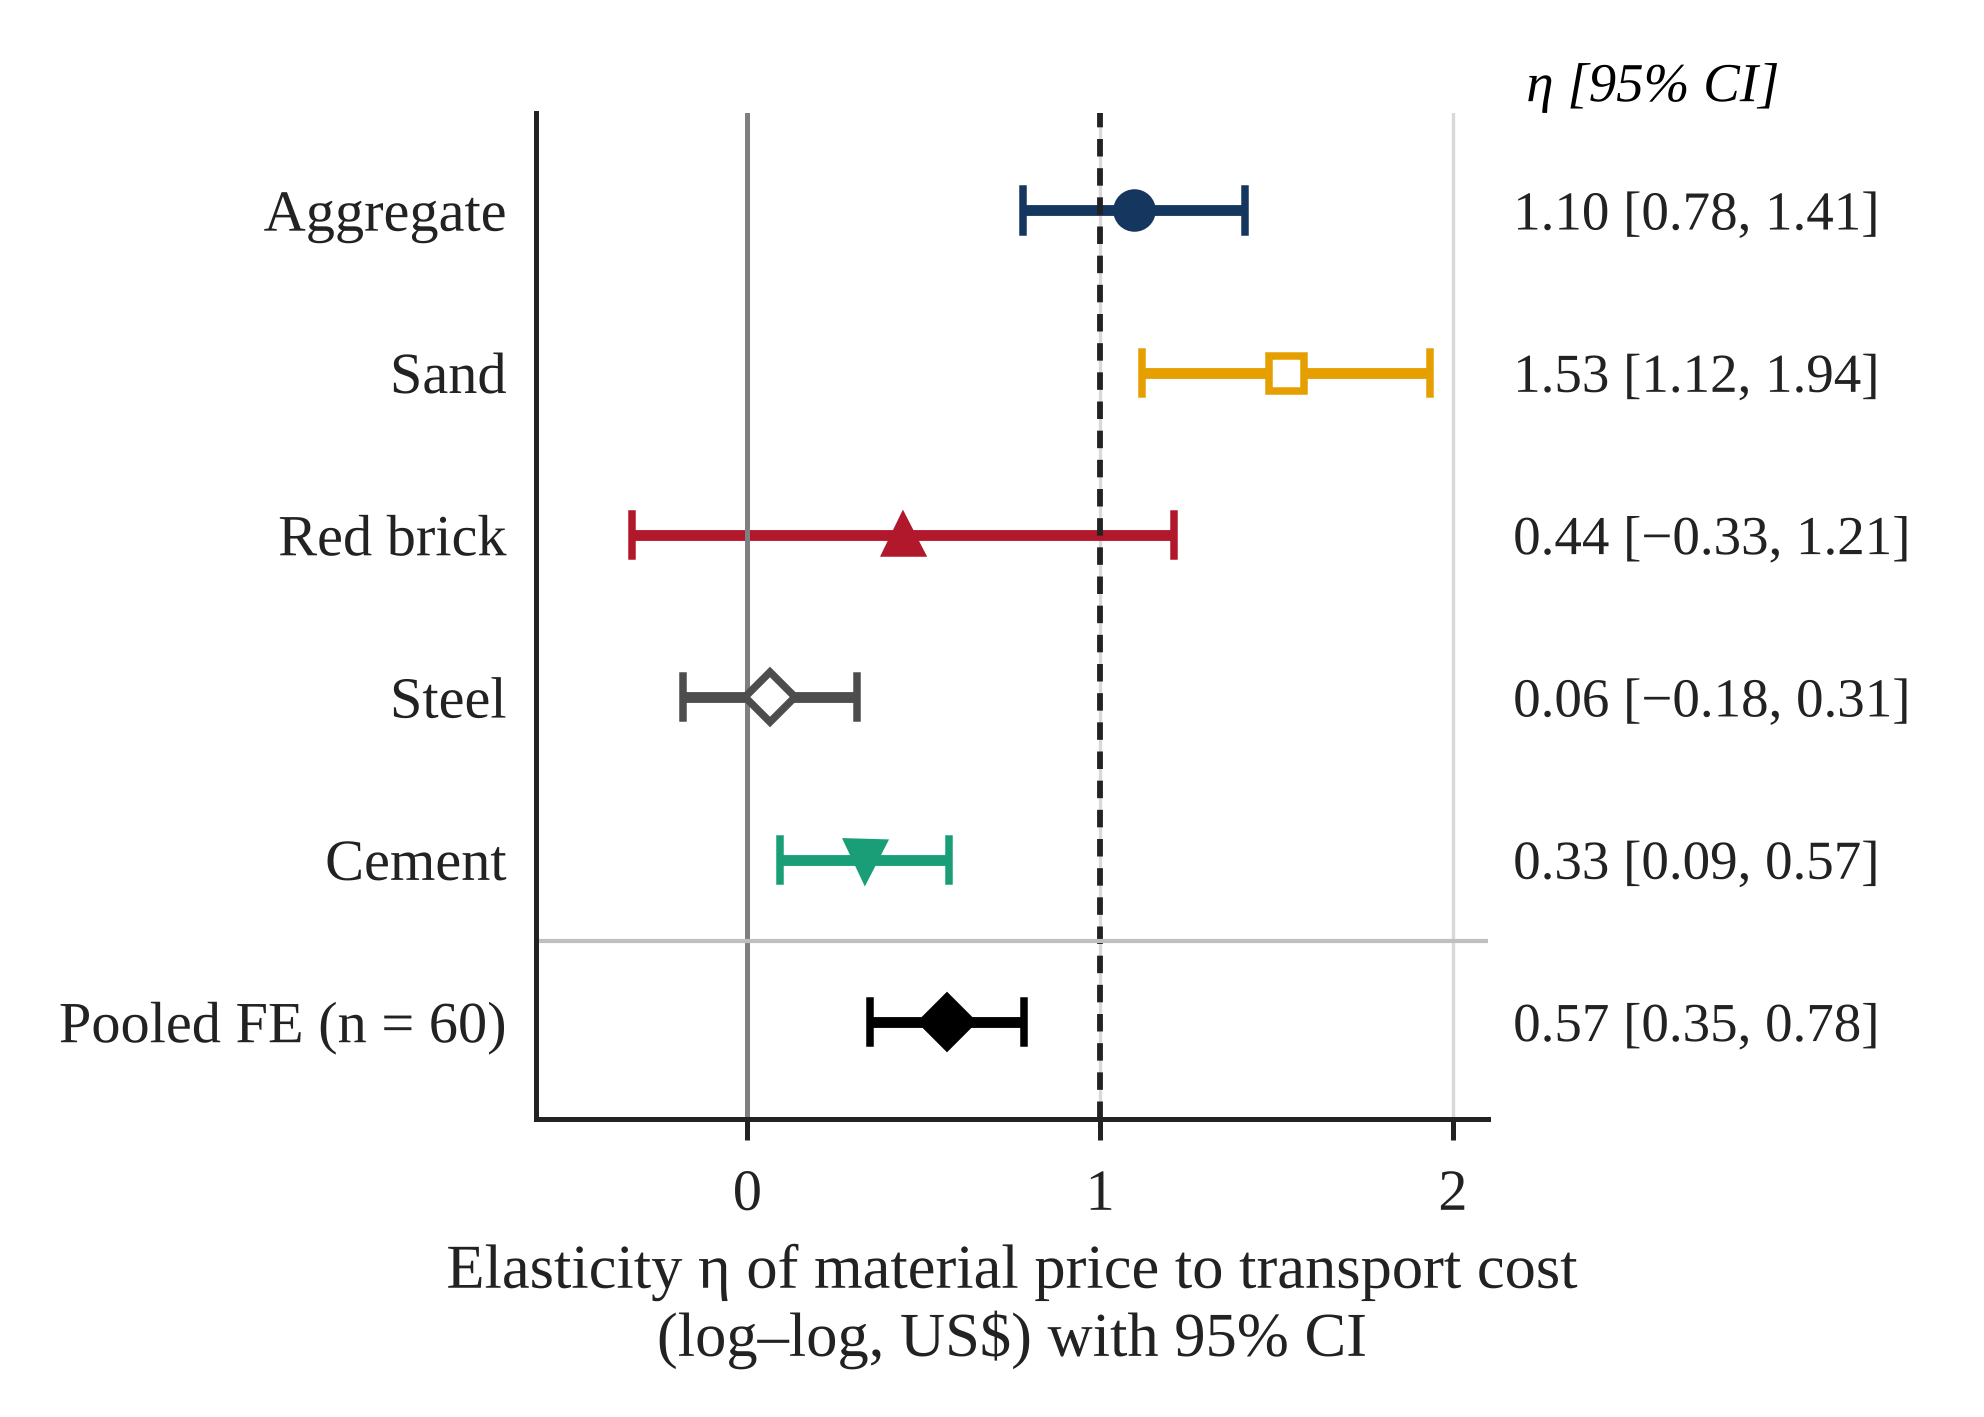 | Figure 9. Elasticity of material price with respect to transport cost (log–log, US$) with 95% confidence intervals; the dashed line marks unit elasticity |
4.8. Effect of the June 2021 Fuel-Subsidy Removal
- The comparison of transport costs prior to and after termination of the subsidy is shown in Table 8 and Figure 10. The cumulative fixed-effects model suggests a 29.1% increase in nominal pounds (p < 0.001). In US dollars the cumulative increase was negligible at exclusively 8.7% (p = 0.177) as the Sudanese pound depreciated between the two periods. However, the effect was additionally heterogeneous: in US$, mean transport cost increased substantially for steel (+67.8%, Welch p = 0.031), cement (+30.7%, p = 0.012), and aggregate (+12.8%, p = 0.045, Mann–Whitney p = 0.073), remained stable for red brick, and decreased for sand (−34.2%), whose haulage rate decreased from July onwards. Following the Holm adjustment, the increase in cement and the decrease in sand remain significant at the 5% level. Because the study is a before-after comparison without a control period, these differences cannot be entirely attributed to the effect of aid elimination; depreciation continued, construction activity fluctuated, and the US$ material price for steel actually increased by 41.7% over the year, as shown in Table 4.
|
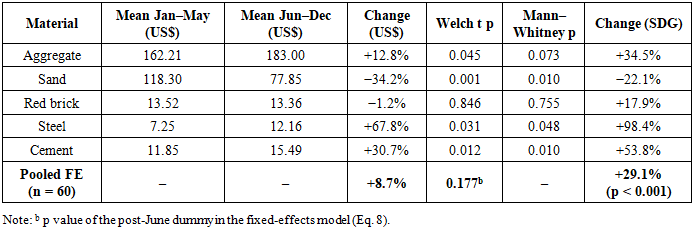
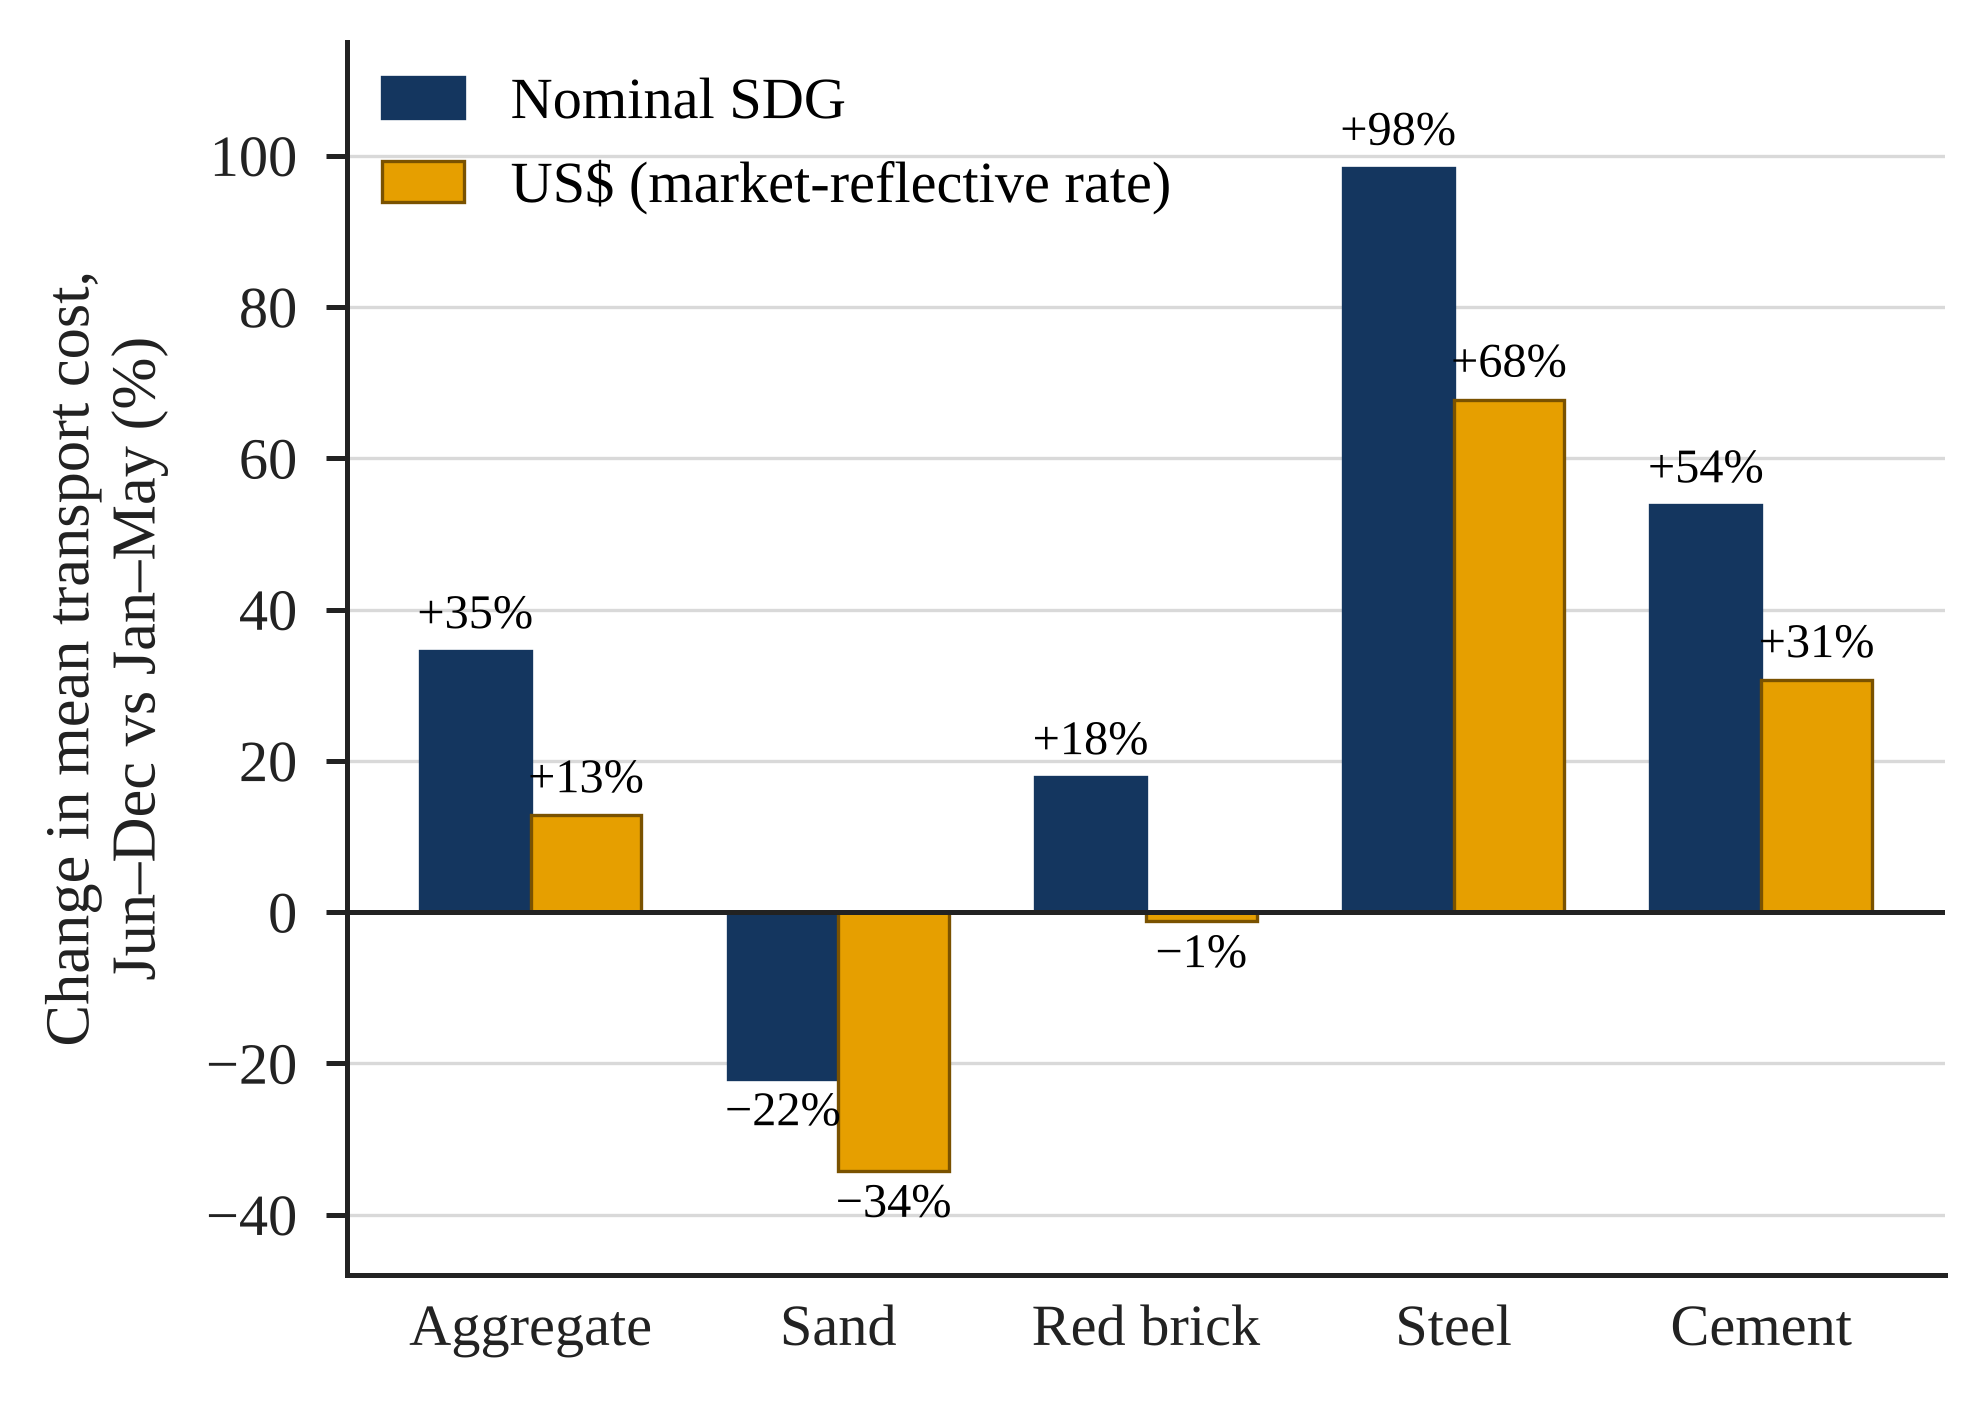 | Figure 10. Change in mean transport cost after the fuel-subsidy removal (Jun–Dec vs Jan–May), nominal SDG and US$ |
4.9. Decomposition and Sensitivity Analysis
- Table 9 breaks down the January-to-December change in delivered cost and reports the sensitivity of the transport-cost change to the conversion basis. Transport contributed 4.0% to the US$259.35 increase in the delivered cost of steel, 21.2% to the US$25.80 increase in the delivered cost of cement, and 33.3% to the US$ decrease in the delivered cost of sand. For aggregate and red brick, the net change in delivered cost was relatively close to zero as transport and material moved in opposite directions; consequently, percentage contributions are hardly meaningful. As per Eq. (9), the change in US$ is equal to the change in SDG, which is lower than the depreciation of the pound (Δln FX = 0.328).
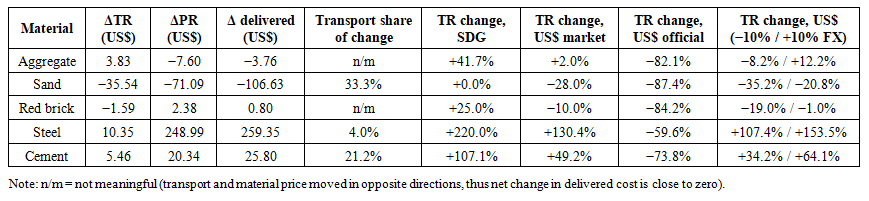 | Table 9. Decomposition of the Jan→Dec Change and Sensitivity of the Transport-Cost Change to the Conversion Basis |
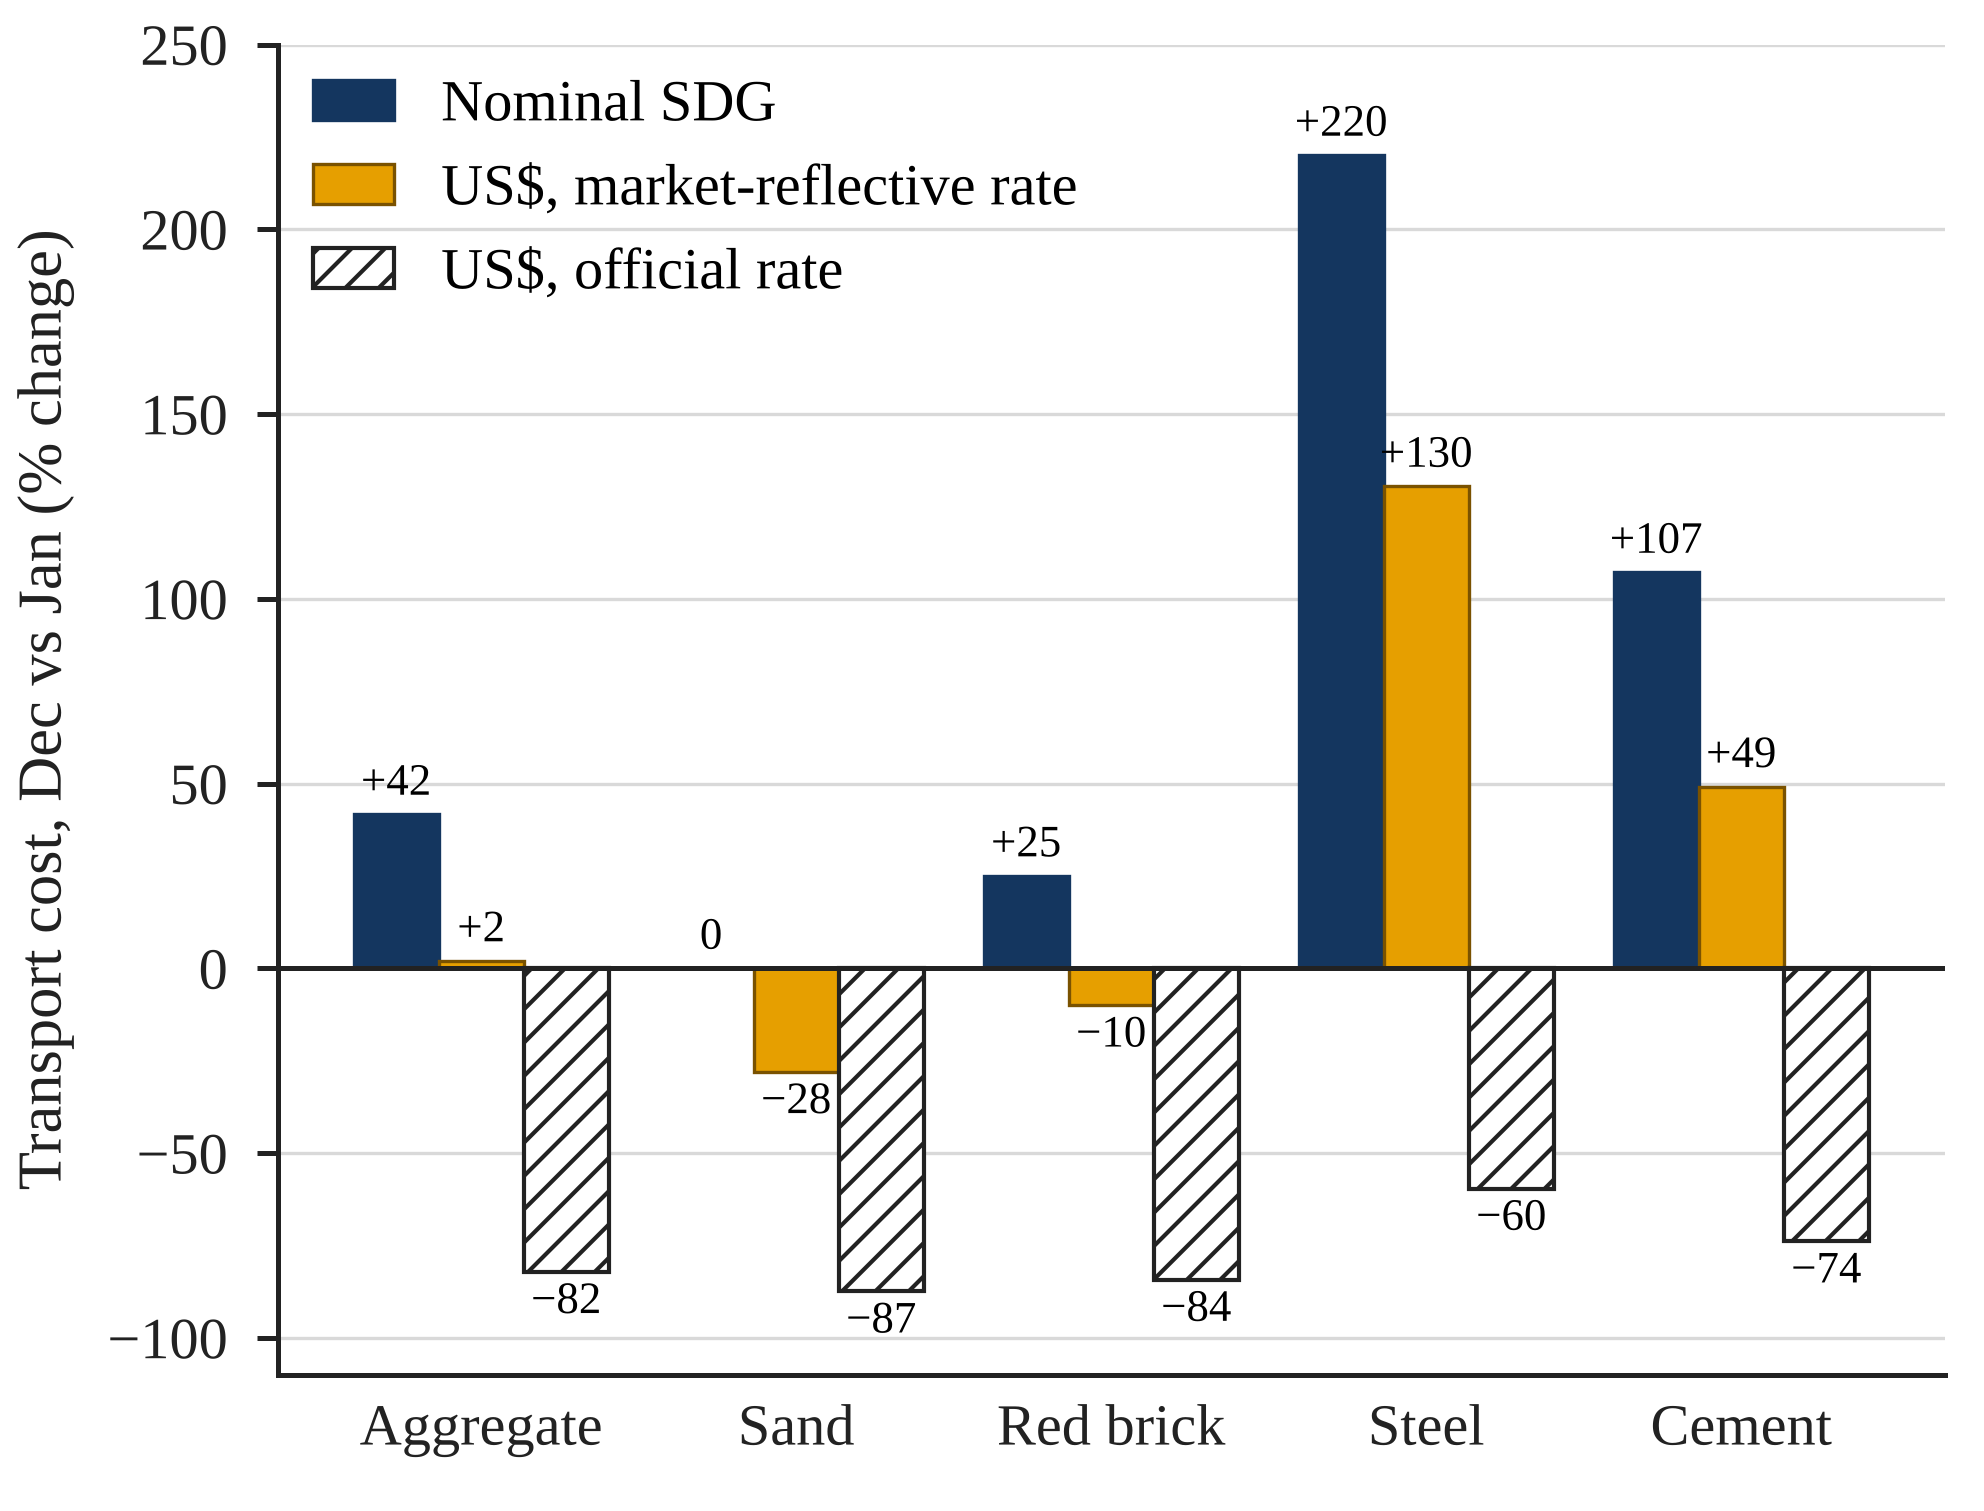 | Figure 11. January-to-December change in transport cost under three conversion bases |
4.10. Robustness to Multiple Testing
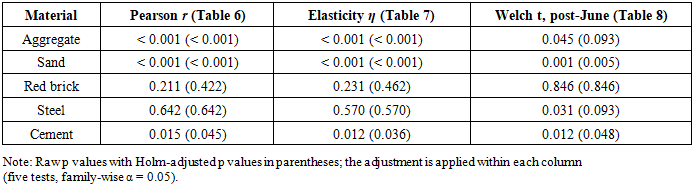
- The p-values in Tables 6–8 were modified with Holm’s procedure (Table 10) due to each material-level test requiring only 12 observations, and a similar test is repeated for five materials. The correlations and elasticities for sand, aggregate, and cement remain significant after modification (cement: adjusted p = 0.045 for r and 0.036 for η), while red brick and steel are still non-significant. The sole variations that remain deemed to be significant for the before–after comparative analysis are the decrease in sand (adjusted p = 0.005) and the increase in cement (adjusted p = 0.048). The variations for steel and aggregate (adjusted p = 0.093 for both) are still not statistically significant. The adjustment thus confirms the overall pattern for the bulk materials and cement; however, the material-level differences around the subsidy removal, particularly for steel and aggregate, should be treated as preliminary.
|
5. Discussion
5.1. Transport Intensity Follows Value Density
- The results indicate a straightforward hierarchy: the lower the value of a material per unit weight, the greater the contribution of transport to the delivered cost and the closer the correlation between transportation and price. For red brick, aggregate, and sand, transport was one-third to more than one-half of the delivered cost, consistent with the concept that transport is a major hidden cost of low-value, high-volume materials [6] and that aggregate costs increase rapidly with haul distance [8]. For aggregate and sand, the price elasticity of demand in relation to a haulage cost was greater than one; transport is a minor component of the value of steel and cement; therefore, prices are mostly driven by production costs, imported inputs, and the exchange rate, rather than the cost of transporting the goods. This finding is consistent with the ranking of transport and crude-oil costs as among the most influential determinants of material prices; however, it requires the important qualification that their influence is concentrated in bulk materials.
5.2. The Currency Channel versus the Transport Channel
- A key outcome is that a considerable part of the apparent increase in transport cost in Sudanese pounds was a currency effect. After the subsidy elimination in June 2021, the nominal transportation rates increased by an average of about 29%, which is less than the >85% increase in general transport rates reported nationally [13]. This outcome is possible due to the survey being for material transportation rather than for passenger and general cargo rates. In hard-currency terms, the average increase was less than 9% and insignificant. Evidence at the material level is more complex: transportation expenses for steel and cement have proven to be significantly higher in dollar terms, while the June increase of 33% in nominal haulage for aggregate only restored its earlier dollar value. Thus, analysts and contractors interpreting the nominal SDG prices without depreciation will overstate real cost escalation, and studies applying an official rate in a multiple-exchange-rate economy may even reverse the sign of measured escalation. This extends the pass-through research [30] to the construction context: in an economy where traders price in hard currency, local-currency prices for materials and haulage closely follow parallel exchange rates. These before-after differences are correlations. The study has no control group in place, and the removal of the subsidy occurred alongside ongoing depreciation and seasonal changes in construction activity; consequently, it is unable to separate the underlying impact of the subsidy removal on transport cost.
5.3. Seasonality and Co-Movement of Sand
- Sand behaved differently from the other materials: price and transportation rate dropped sharply between July and September and recovered in December, showing the highest correlation (r=0.94) and an elasticity above one. This joint movement is more consistent with an unexpected change in common demand or supply than with transportation expenses affecting prices. One explanation might involve the reduction of construction activity during the main rainy season (roughly June to September in central Sudan) and the selling of sand by operators on a delivered basis. Testing these interpretations with data on construction activity and market structure is essential. They show that a strong correlation between transport cost and price does not by itself establish causation.
5.4. Implications for Estimating and Contract Pricing
- The measured transport shares can be used directly in price-adjustment (escalation) clauses. Instead of a single inflation index, the adjusted price of a material can be linked separately to a transportation index, a material index and the exchange rate:
 | (10) |
6. Conclusions
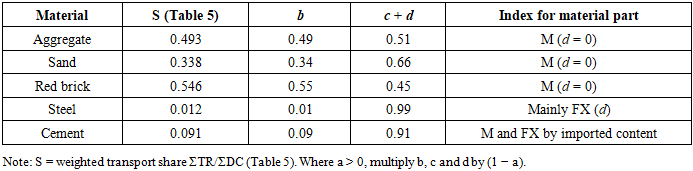
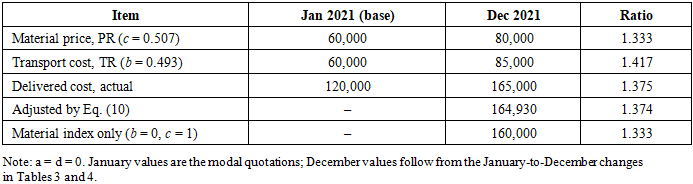
- This study examined a correlation between the cost of transport and the prices of five construction materials in Sudan in 2021. All prices were analysed in US dollars (hard-currency equivalent terms) due to the Sudanese pound was not stable enough to provide a reliable basis for comparison. The key results, which are associations based on 12 monthly observations per material and are to be interpreted with caution, are:(1) Transport is a dominant component of the delivered cost of bulk materials: 54.6% for red brick, 49.3% for aggregate and 33.8% for sand, compared with 9.1% for cement and 1.2% for steel.(2) In US$ terms, transport cost and material price were very strongly correlated for sand (r = 0.94) and aggregate (r = 0.91), strongly for cement (r = 0.68), and not significantly for red brick or steel; for red brick, monthly changes were nevertheless very strongly correlated (r = 0.87); the correlations for sand, aggregate and cement remain significant after Holm adjustment.(3) Across all materials, a 10% increase in transport cost was associated with a 5.7% increase in material price (pooled elasticity 0.57, p < 0.001); elasticities exceeded one for sand and aggregate.(4) In US$ terms, transport cost rose most for steel (+130.4%) and cement (+49.2%) between January and December 2021, was nearly unchanged for aggregate, and fell for red brick and sand.(5) Mean transport cost after the fuel subsidy removal in June 2021 was 29.1% higher in nominal SDG but only 8.7% higher (not significant) in US$ than before it occurred, which indicates that a large part of the nominal increase reflected currency depreciation; since other variables fluctuated at similar times, this difference is unable to be attributed exclusively to the subsidy removal.(6) The choice of exchange rate is decisive: conversion at the official rate would have shown spurious falls of 60–87% in transport cost, whereas nominal SDG figures overstate real escalation.(7) In a price-adjustment formula, the transport weight ought to correspond to the base-date transport share (about 0.49 for aggregate, 0.34 for sand, 0.55 for red brick, 0.09 for cement, and 0.01 for steel); in the worked scenario for aggregate, this formula simulated the December 2021 delivered cost to within 0.1%, whereas indexing to the material price alone recovered only 89% of the increase.
7. Recommendations
7.1. For Contractors and Cost Estimators
- (1) Estimate bulk materials (aggregate, sand, red brick) on a delivered-cost basis, pricing haulage explicitly by distance and diesel price rather than as a fixed percentage.(2) Prepare estimates, and update cost data, in a stable reference currency (US$) or index SDG rates to the market exchange rate during periods of currency instability.(3) Reduce exposure to haulage shocks by sourcing bulk materials from the nearest quarries and kilns, consolidating deliveries, and buying ahead of announced fuel-price revisions where storage allows.
7.2. For Clients, Consultants and Contract Drafters
- (1) Adopt multi-index price-adjustment formulas (Eq. 10) with separate transport, material and exchange-rate components weighted as explained in Section 5.4 (Tables 11 and 12), using the base-date breakdown of yard price and delivery charge.
|
|
7.3. For Policy-Makers and Statistical Agencies
- (1) Publish a monthly construction-material and haulage price index for Sudan, in both SDG and US$, to support estimating and contract adjustment.(2) Phase fuel-price reforms and accompany them with measures for freight transport, such as improved haul roads and rail freight for bulk materials, to limit cost-push effects on construction.(3) Consider cleaner and cheaper haulage options, including alternative fuels and fleet renewal, which can lower both transport costs and emissions [33].
8. Limitations and Future Research
- The study has several limitations. The statistical power is limited due to each material collection being limited to twelve monthly observations from a single year. The study additionally avoids formal time-series tests that include cointegration tests or Granger causality tests. The results are sensitive to particular months. Prices were measured as stepwise changes in quoted market prices. This method resulted in ties. The monthly values are modal quotes and therefore cannot represent the variation of prices across suppliers and states, and the five states were combined rather than analyzed individually. TR only includes intra-city delivery; the transport from the quarry, kiln, or factory to the supplier yard location is reflected in PR; therefore, the transport percentages are lower bounds of the total transport content. The exchange rates for January and February are point quotations from the parallel market, rather than monthly averages; nevertheless, sensitivity analysis demonstrates that the key findings are robust to changes of ±10%. Haul distances, vehicle types, and diesel consumption were not collected; consequently, transport costs were unable to be separated into distance and fuel components. Correlation does not imply cause and effect, and the before–after comparison conducted close to the subsidy removal lacks a sufficient control group. Lastly, the data cover markets in five states in one year of exceptional changes, and the Sudan situation has fluctuated dramatically since the start of armed conflict in April 2023.Future research should extend the series over several years and markets, record haul distances and diesel prices to estimate distance-based haulage models, apply vector autoregressive or error-correction models linking diesel prices, exchange rates and material prices, and examine how the conflict since 2023 has reshaped construction supply chains and transport costs in Sudan and neighbouring countries.
DECLARATIONS
- Funding. This research received no specific grant from any funding agency in the public, commercial or not-for-profit sectors – authors to confirm.Declaration of competing interest. The authors declare that they have no known competing financial interests or personal relationships that could have appeared to influence the work reported in this paper – authors to confirm.Authorship contribution statement. Elkhider B. E. Mohamed: Conceptualization, Methodology, Formal analysis, review & editing. Ahmed Elrashied: Investigation, Writing – original draft.