-
Paper Information
- Paper Submission
-
Journal Information
- About This Journal
- Editorial Board
- Current Issue
- Archive
- Author Guidelines
- Contact Us
International Journal of Construction Engineering and Management
p-ISSN: 2326-1080 e-ISSN: 2326-1102
2025; 14(4): 116-130
doi:10.5923/j.ijcem.20251404.02
Received: Nov. 10, 2025; Accepted: Dec. 3, 2025; Published: Dec. 13, 2025

Assessing the Impact of Risks on Mortgage-Financed Construction Projects in Kenya
 Abstract
 Reference
 Full-Text PDF
 Full-text HTML
Julius Muigai Mungai, Shadrack Mutungi Simon, Gerryshom Munala, James Maina Kiambigi
Department of Construction Management, Jomo Kenyatta University of Agriculture and Technology
Correspondence to: Julius Muigai Mungai, Department of Construction Management, Jomo Kenyatta University of Agriculture and Technology.
| Email: |  |
Copyright © 2025 The Author(s). Published by Scientific & Academic Publishing.
This work is licensed under the Creative Commons Attribution International License (CC BY).
http://creativecommons.org/licenses/by/4.0/

Mortgage-financed construction projects (MFCPs) in Kenya are critical for economic growth and housing development, yet they frequently suffer from cost overruns, delays, and quality defects. This study investigates the risks affecting the performance of MFCPs, focusing on market, financial, planning, construction, legal, and environmental risks. Data was collected from 122 developers using a cross-sectional survey and analyzed through descriptive statistics and correlation analysis. The findings indicate that construction risks, particularly material cost fluctuations and project delays, have the most significant negative impact on project performance. Legal and regulatory risks, such as permit delays and design flaws, also marginally affect outcomes. Market, financial, planning, and environmental risks show negative but statistically non-significant correlations, suggesting indirect influence. The strong intercorrelations among risk categories highlight the need for integrated risk management. The study recommends proactive risk identification, holistic mitigation strategies, and further research into mediation effects to improve the success of MFCPs in Kenya.
Keywords: Construction Project Performance, Mortgage Finance, Survey Research, Kenya
Cite this paper: Julius Muigai Mungai, Shadrack Mutungi Simon, Gerryshom Munala, James Maina Kiambigi, Assessing the Impact of Risks on Mortgage-Financed Construction Projects in Kenya, International Journal of Construction Engineering and Management , Vol. 14 No. 4, 2025, pp. 116-130. doi: 10.5923/j.ijcem.20251404.02.
Article Outline
1. Introduction
- Kenya's construction industry significantly contributes to the nation's economic growth, providing infrastructure and housing essential for development. Within this sector, mortgage financing plays a crucial role in enabling individuals and developers to undertake construction projects, thereby stimulating economic activity and addressing the growing demand for housing. However, construction projects, particularly those financed through mortgages, are inherently complex and exposed to numerous risks that can adversely affect their performance, leading to delays, cost overruns, and quality defects [1].Mortgage-financed construction projects in Kenya (MFCPs) have been associated with dismal performance. These projects have been riddled with cost and schedule overruns, among other challenges. This has been reported in numerous studies [2], [3], [4], [5]. According to [6], schedule and cost overruns have been the norm rather than the exception. [7] found out that 88% of projects in the Kikuyu constituency suffered delays, 12% of the projects were on time, while no project (0%) was ahead of schedule. [8] reported schedule overruns of 33.3%. According to [9], on average, 35-73% of construction projects in Kenya overrun their schedule. In another study, [10] reported cost overruns of up to 24.92%. There is also further evidence that the time and cost performance of projects is to the extent that over 70% of projects initiated are likely to escalate with time by more than 50% and over 50% of projects are likely to escalate in cost by more than 20% [8].Risk management is a critical process that involves identifying, assessing, and mitigating potential threats to a project's objectives [11]. Effective risk management enables project teams to proactively address challenges, minimize negative impacts, and maximize opportunities for success [12]. In the context of construction projects, risk management encompasses a wide range of factors, including financial risks, design risks, construction risks, environmental risks, and regulatory risks [13], [14].Despite the recognized importance of risk management, its implementation in the Kenyan construction industry, particularly in mortgage-financed projects, remains inadequate. Many construction firms lack the necessary knowledge, tools, and techniques to effectively manage risks, leading to poor project outcomes. This deficiency is further compounded by a lack of standardized risk management frameworks tailored to the specific needs and challenges of the Kenyan construction industry.Several factors contribute to the inadequate implementation of risk management in Kenyan construction projects. First, there is a lack of awareness and understanding of the benefits of risk management among project stakeholders [15]. Many stakeholders view risk management as a costly and time-consuming exercise, rather than a value-added process that can improve project outcomes. Second, there is a shortage of skilled risk management professionals in the Kenyan construction industry [16]. This scarcity of expertise limits the ability of construction firms to effectively identify, assess, and mitigate risks. Third, there is a lack of data and information on past project performance, making it difficult to accurately assess the likelihood and impact of potential risks [17].The absence of a comprehensive risk management framework for mortgage-financed construction projects in Kenya has significant implications for the performance of the construction industry and the broader economy. Project delays and cost overruns can lead to financial losses for developers, contractors, and homeowners, as well as increased borrowing costs and reduced investment in the construction sector [18]. Quality defects can result in costly rework, safety hazards, and dissatisfied clients. Ultimately, these negative impacts can undermine the sustainability and competitiveness of the Kenyan construction industry. The objectives of this paper included evaluating the performance of MFCPs, establishing risks associated with MFCPs, and determining their impact on the performance of MFCPs.
2. Research Methodology
2.1. Research Design
- A research design establishes a framework for data gathering and analysis. This study adopts the cross-sectional survey research design described by [19] and [20]. Bryman [19] describes a cross-sectional survey as one that studies multiple cases at a single point in time by measuring quantifiable data with the aim of identifying patterns of association. The aim of studying multiple cases was to enable the detection of variations among the selected cases, while the single-point time perspective provides meaning to the comparisons of the multiple cases. The advantage of data quantification is that it provides a consistent benchmark to the researcher and at the same time makes it possible to understand relationships between variables [19].
2.2. Sampling Methods and Sample Size
- In this study, the population includes all construction projects financed through mortgages throughout the country. This study focuses on the 1,063 mortgages initiated during the 2021/2022 financial year, as per the annual banking report by the [21]. The sample size was calculated based on the following formulae from [22] and [23].
 Where: -• 𝑛0= required return sample size• 𝑡 = alpha level value (0.01 = 2.576 for sample size of 120 or more; the alpha level of .01 indicates the level of risk the researcher is willing to take that the true margin of error may exceed the acceptable margin of error.) 2.576 is the z-score for a 99% confidence interval.• 𝑠 = estimated standard deviation in population for 7-point scale (1.167; estimate of variance deviation for 7-point scale calculated by using 7 [inclusive range of scale] divided by 6 [number of standard deviations that include almost all (approximately 98%) of the possible values in the range]).• 𝑒 = acceptable level of error for the mean being estimated (0.21; number of points on primary scale × acceptable margin of error; points on primary scale = 7; acceptable margin of error = .03 [error researcher is willing to accept]).Therefore;
  However, since this sample size exceeds 5% of the population (1,063×5%=53), the following [22] correction formula was used to estimate the final sample size.
 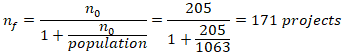 Where;• 𝑛f = final sample size• 𝑛0 = original sample size• Population = target populationThis study adopted simple random sampling as its choice of selecting the sample size from the population. According to [24], this sampling method is also known as chance sampling or probability sampling because each item in the population has an equal chance of being included in the sample and each of the possible samples, in the case of a finite universe, has the same probability of being chosen. An ideal sample is one that meets the requirements of efficiency, representativeness, dependability, and adaptability.
2.3. Data Collection
- According to [25], structured interviews and questionnaires are the two most common research methods associated with survey research design. Both were adopted in this study as the methods of collecting data. The measured indicators were derived from previous literature and refined so that they would not only be appropriate for the respondents but also generate enough data for hypothesis testing. The questionnaires were self-administered, and the majority of the questions were closed-ended. This makes the collected data easily compatible with statistical analysis, which is the preferred method of data analysis in this study. A few open-ended questions were also included in order to get additional information, which was used to understand the behaviour of the statistical data.
2.4. Data Analysis
- The collected quantitative data were subjected to descriptive analysis. Descriptive statistics were used mostly to describe the distribution of variables. Measures of frequency (percent, count), measures of central tendency (mean), measures of variation/dispersion (range, kurtosis, skewness, standard deviation, variance) are among the descriptive statistics that were performed. While the majority of these metrics were used to examine data obtained for the various variables, kurtosis and skewness were employed to ensure that the data distribution is normal. Pearson Correlation was carried out to establish the underlying bivariate relationships.
2.5. Validity and Reliability
- To ensure the questionnaire's validity, expert reviews were conducted to establish face and content validity. Five experts, including three from academia (thesis supervisors) and two from the industry, all with a combined experience of 112 years, gave suggestions on how to improve the data collection instrument. Further, a pilot test was performed with a subset of the target audience to identify issues. In addition, factor analysis was used to confirm that the questionnaire measured the intended construct. To ensure questionnaire reliability, clear and unambiguous questions were used. Additionally, a pilot test was also conducted. Internal consistency (Cronbach's Alpha) was used to test the reliability, whereby all the constructs achieved values exceeding 0.7, as recommended by [25]. Minor revisions were made following suggestions from the experts and the pilot study participants.
2.6. Ethical Considerations
- All professions are governed by a code of ethics that has changed over time to reflect the evolving ethos, values, requirements, and expectations of people involved in the professions. The research process is no different. According to [26], ethics in research is defined as a researcher's behaviour toward research participants or persons affected by the research. [27] on the other hand, feels that ethics should include rules or concepts relevant to effective professional activity. The following ethical issues were observed while carrying out this investigation. At the onset of the questionnaire administration, informed consent was obtained from each respondent. The respondents were also made aware of how long it would take to fill the questionnaire. Further, data collected from the respondents was treated with utmost confidentiality and was used for academic purposes only. The researcher also ensured that no harm befell the respondents during the data collection exercise. Finally, the researcher ensured correct and unbiased reporting of the findings as advised by [28]. Approval was secured from both the Jomo Kenyatta University of Agriculture and Technology (JKUAT) Graduate School and the National Commission for Science, Technology and Innovation (NACOSTI).
3. Findings and Discussion
- This section presents the empirical findings of the study based on data collected from developers engaged in MFCPs in Kenya. The results are structured into three main categories: background information about the respondents and their project characteristics, risks affecting MFCPs, and the effect of the risks on the performance of MFCPs across five key indicators: budget adherence, schedule adherence, quality, safety, and cash flow.
3.1. Background Information
- Five aspects of background information were considered in the data collection tool. These were: level of education, professional background, type of project, project value, and project duration. Their results have been presented in the following sections.
3.1.1. Level of Education
- Results presented in Figure 1 showed that 52.5% (n=64) of the respondents had a Bachelor's degree, while 36.1% (n=44) had a Master's degree. Together, these two categories account for 108 out of 122 respondents (approximately 89%). This suggests that the sector is largely comprised of highly educated professionals. This could be attributed to the fact that most financial institutions prefer to give mortgages to salaried individuals who tend to be educated professionals. 5.7% (n=7) had a Diploma while only 3.3% (n=4) were PhD holders. The low number of Doctorates was expected, given that only a small percentage (probably only those in academia) of professionals advance beyond a master's degree. The least represented group was the post-secondary certificate holders, 2.4% (n=3).
 | Figure 1. Level of Education (Source: Author’s analysis (2025).) |
3.1.2. Professional Background
- Given the expected diverse backgrounds of the respondents (developers), the question on their professional background was framed in an open-ended format. The results have been presented in the form of a word cloud as demonstrated in Figure 2. A significant proportion of respondents have backgrounds in construction-related disciplines. These included Construction Management, Civil Engineering, Quantity Surveying, Structural Engineering, Architecture, and Mechanical Engineering, among others. A number of developers come from finance and banking backgrounds. This is expected since bank officials are well exposed to the various mortgage financing options available in the market. As expected, the range of professions was very wide, as demonstrated in Figure 2.
 | Figure 2. Professional Background (Source: Author’s analysis (2025).) |
3.1.3. Type of Projects
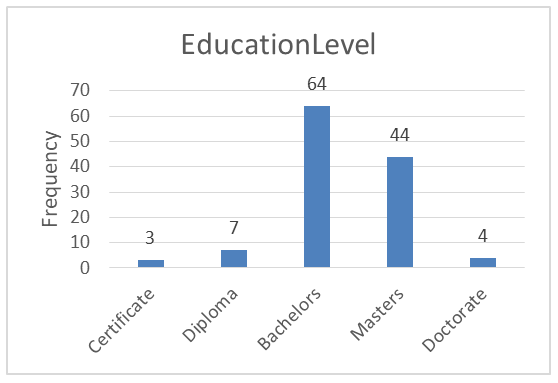
- The respondents were asked to indicate the type of project they were currently undergoing, and which was mortgage-financed. Results presented in Figure 3 showed that residential houses were the most commonly mortgage-financed, with a frequency of 68.3% (n=82). They were followed by distantly mixed-use development 13.3% (n=16) and commercial buildings 11.7% (n=14). Office buildings and industrial houses were the least mortgage-financed types of construction projects, each with a frequency of 3.3% (n=4).
 | Figure 3. Type of Project (Source: Author’s analysis (2025).) |
3.1.4. Project Value
- The respondents were asked to indicate the value of the construction project they were currently undertaking. Figure 4 presents interesting results where the extremes recorded the highest frequencies. The results assumed an inverted bell curve. The majority of the construction projects (n=62, 51.2%) undertaken had a value of “up to 20 million” Kenyan shillings, followed by those with a value of “above 120 million” Kenyan shillings (n=32, 26.4%). Projects worth KShs. 81 – 100 million had a frequency of 9.1% (n=11), while those worth KShs. 21 – 40 million had a frequency of 8.3% (n=10). Projects worth KShs. 41 – 60 million and KShs. 61 – 80 both came last with a frequency of 2.5% (n=3).
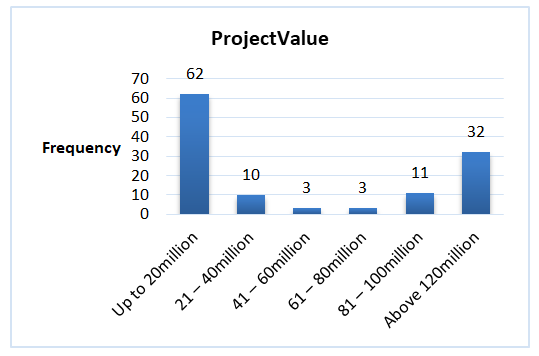 | Figure 4. Project Value (Source: Author’s analysis (2025).) |
3.1.5. Project Duration
- The project duration was measured in weeks. This was done based on intervals of 12 weeks. Results in Figure 5 showed a fair distribution across all groups. Projects with a duration of “above 72 weeks” were the most with a frequency of 24.8% (n=30). Projects with a duration of “61-72 weeks” had the least representation with a frequency of 5.0% (n=6). Short-duration projects of “less than 12 weeks” had a frequency of 9.1% (n=11).
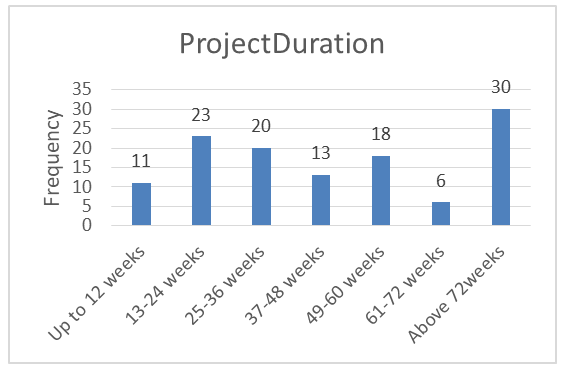 | Figure 5. Project Duration (Source: Author’s analysis (2025).) |
3.2. Performance of MFCPs
- Five aspects were used to evaluate the performance of MFCPs. These were: budget adherence, schedule adherence, project quality, safety standards, and project cash flow. The results have been presented in the following sections.
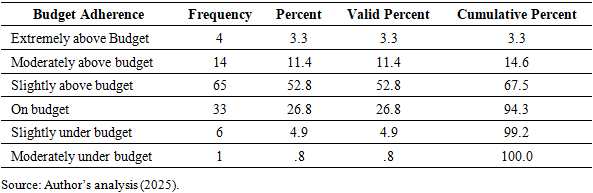
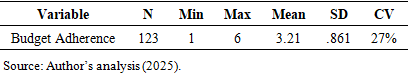
3.2.1. Budget Adherence
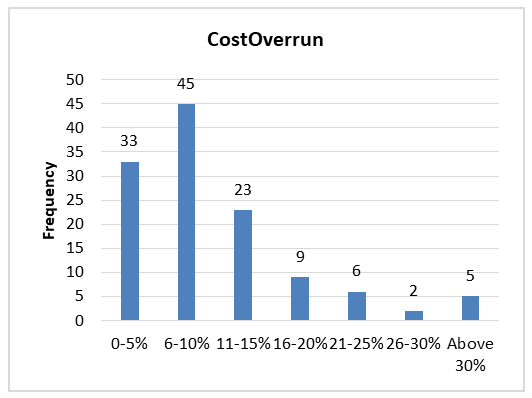
- Respondents were asked to what extent the project was currently adhering to the set budget. Seven options were presented to them, ranging from “extremely above budget” to “extremely under budget”. As presented in Table 1(a), the largest group, 52.8%, reported being slightly above budget. This suggests that while many projects exceed their budgets, the overruns are generally modest. Combining all categories above budget (extremely, moderately, and slightly above) accounts for 67.5% of projects. This indicates that two-thirds of projects experience cost overruns, which can impact financing costs. About 26.8% (n=33) of projects are reported as on budget, reflecting effective cost control in a quarter of the cases. A small minority (5.7%, n=7) is under budget, which may indicate efficient management or conservative budgeting.
|
|
 | Figure 6. Cost Overruns of MFCPs (Source: Author’s analysis (2025).) |
3.2.2. Schedule Adherence
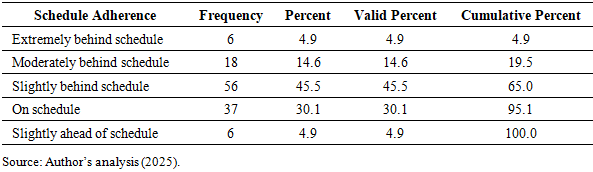
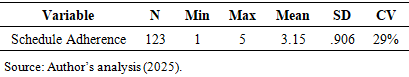
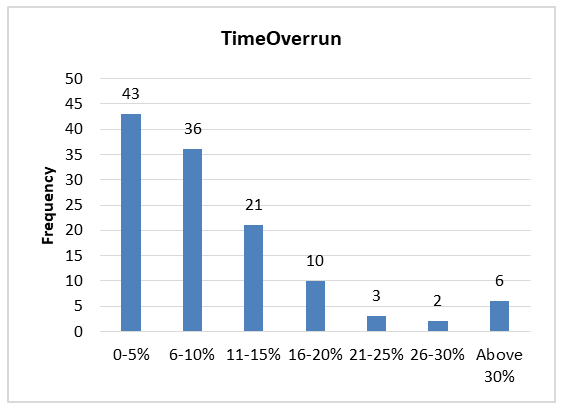
- Respondents were asked to what extent the project was currently adhering to the initial schedule. Seven options were presented to them, ranging from “extremely behind schedule” to “extremely ahead of schedule”. As presented in Table 2(a), 65% of projects (4.9% “extremely” + 14.6% “moderately” + 45.5% “slightly”) were behind schedule, with nearly half (45.5%) reporting slight delays. Only 30.1% are on schedule, and a mere 4.9% are slightly ahead. 19.5% of projects (4.9% “extremely” + 14.6% “moderately behind”) face significant delays, which can jeopardize stakeholder confidence and financial viability. Slight delays (45.5%) may stem from manageable issues such as weather disruptions or minor administrative bottlenecks. These are often mitigated through contingency planning. Severe delays (19.5%) likely reflect systemic challenges, such as poor contractor performance, design changes, or funding gaps.
|
|
 | Figure 7. Time Overruns of MFCPs (Source: Author’s analysis (2025).) |
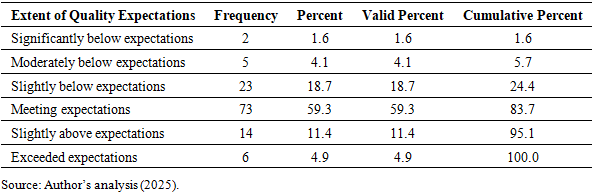
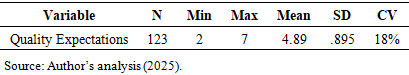
3.2.3. Project Quality
- Respondents were asked to rate the extent to which the project was meeting the expected quality. Seven options were presented to them, ranging from “not acceptable” to “exceeded expectations”. As seen in Table 3(a), a significant majority, 59.3%, report that their projects are meeting quality expectations. An additional 16.3% (11.4% “slightly above” + 4.9% “exceeded”) indicates that projects are performing above expectations. This suggests a generally positive perception of quality standards in MFCPs in Kenya. Meeting or exceeding quality expectations is critical for client satisfaction, regulatory compliance, and long-term asset value [34].About 24.4% of projects fall below expectations (1.6% “significantly below” + 4.1% “moderately below” + 18.7% “slightly below”). This sizeable minority highlights challenges in maintaining consistent quality across all MFCPs. Causes of quality shortfalls may include inadequate materials, poor workmanship, insufficient supervision, or budget constraints [35]. Quality deficiencies can lead to costly rework, delays, and reduced market confidence.
|
|
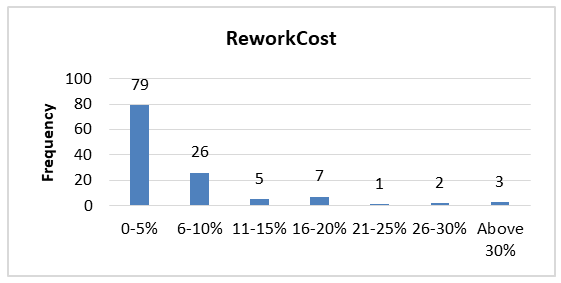 | Figure 8. Rework Cost of MFCPs (Source: Author’s analysis (2025).) |
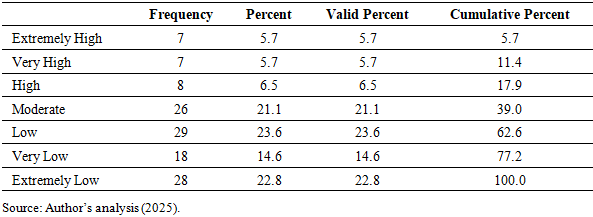
3.2.4. Project Safety Standards
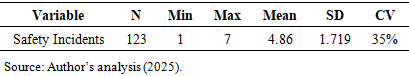
- Respondents were asked to describe the seriousness of the safety incidents and accidents reported in the project. Seven options were presented to them, ranging from “extremely high” to “extremely low”. As seen on Table 4(a), the majority of respondents (61.0%) reported safety incidents as Low, Very Low, or Extremely Low in seriousness (23.6% + 14.6% + 22.8%). About 17.9% reported incidents as High or above seriousness (5.7% extremely high + 5.7% very high + 6.5% high). The remaining 21.1% rated incidents as Moderate in seriousness.The data suggests that while most projects experience safety incidents that are not severe, a notable minority (nearly 18%) face serious safety issue. This distribution is consistent with global construction industry trends, where minor incidents are common, but serious accidents, though less frequent, have significant consequences [36], [37], [38]. The presence of severe incidents signals the need for improved safety management, training, and enforcement of safety protocols [39], [40]. Construction sites in Kenya often face challenges such as inadequate safety training, limited use of personal protective equipment (PPE), and enforcement gaps [41]. Economic pressures and informal labour practices may contribute to higher-risk environments, increasing the likelihood of serious incidents [42].
|
|
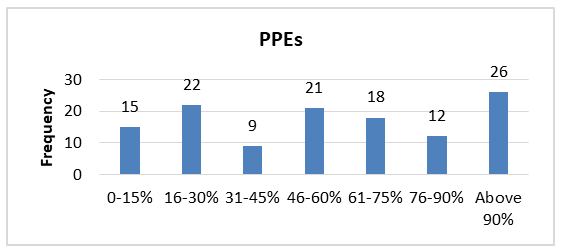 | Figure 9. Number of Workers with PPEs (Source: Author’s analysis (2025).) |
3.2.5. Project Cashflow
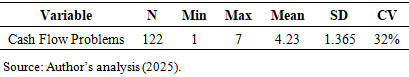
- Respondents were asked to indicate the extent to which they experienced cash flow problems during the project. Seven options were presented to them, ranging from “extremely high” to “extremely low”. Results in Table 5(a) show that moderate cash flow problems were the most common, reported by 41% (n=50) of respondents. High or greater (High, Very High, Extremely High) cash flow problems affect 23.8% of projects. Low or less (Low, Very Low, Extremely Low) cash flow problems are reported by 35.3% of projects. This distribution shows that while severe cash flow issues are not the norm, a significant minority of projects face substantial financial stress.
|

|
3.3. Risks Associated with MFCPs
- This section sought to establish the risks associated with MFCPs. Six types of risks were considered. A seven-point Likert scale ranging from “extremely low” to “extremely high” was adopted for both risk probability and risk impact. The means were converted to RII values by dividing by the highest possible score on the Likert scale (7) as advocated for by [45]. The overall risk impact was calculated by obtaining the means of the three types of risk impact evaluated. The risk level was then calculated by multiplying the risk probability and the overall risk impact, and converted to a percentage. The results are presented in the following sections.
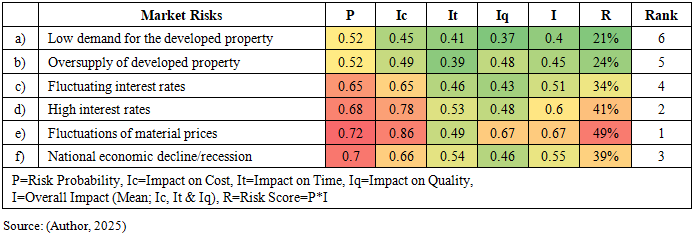
3.3.1. Market Risks
- As demonstrated in Table 6, the most dominant market risk was found to be “fluctuations of material prices” with a risk level of 49%, followed by “high interest rates” (41%), and “national economic decline/recession” (39%). The two least significant market risks were “oversupply of developed property” (24%) and “low demand for the developed property” (21%). The mean risk level for the market risks was 35%.
|
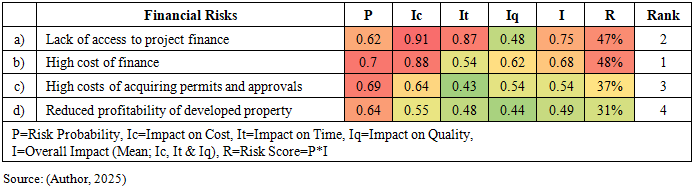
3.3.2. Financial Risks
- Results in Table 7 revealed the most dominant financial risk to be “high cost of finance” with a risk level of 48%, followed by “lack of access to project finance” (47%). The two least significant market risks were “reduced profitability of developed property” (31%) and “high costs of acquiring permits and approvals” (37%). The mean risk level for the financial risks was 41%.
|
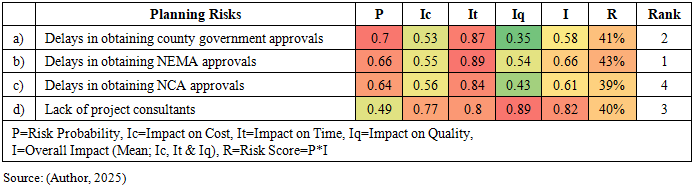
3.3.3. Planning Risks
- Five planning risks were considered in this study. Results in Table 8 revealed the most dominant planning risk to be “delays in obtaining NEMA approvals” with a risk level of 47%, followed by “delays in obtaining county government approvals” (41%). The two least significant market risks were “delays in obtaining NCA approvals” (39%) and “lack of project consultants” (40%). The mean risk level for the planning risks was 41%.
|
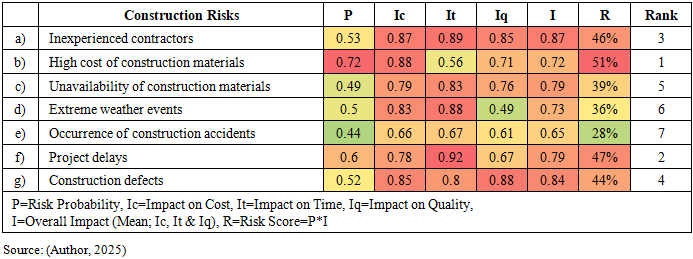
3.3.4. Construction Risks
- As demonstrated in Table 9, the most dominant construction risk was found to be “high cost of construction materials” with a risk level of 51%, followed by “project delays” (47%), and “inexperienced contractors” (46%). The three least significant market risks were “unavailability of construction materials” (39%), “extreme weather events” (36%), and “occurrence of construction accidents” (28%). The mean risk level for the construction risks was 42%.
|
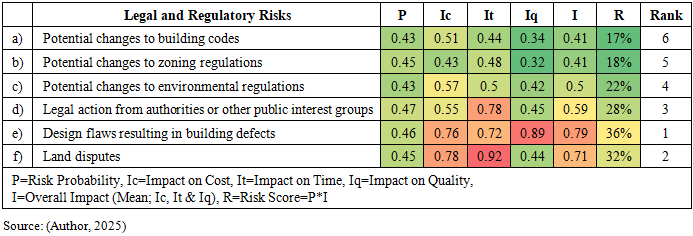
3.3.5. Legal and Regulatory Risks
- Six legal and regulatory risks were considered in this study. Compared to other types of risks, the legal and regulatory risks were found to be less significant, as evidenced in their relatively lower risk levels. Results in Table 10 revealed the most dominant construction risk to be “design flaws resulting in building defects” with a risk level of 36%, followed by “land disputes” (32%), and “legal action from authorities or other public interest groups” (28%). The three least significant market risks were “potential changes to environmental regulations” (22%), “potential changes to zoning regulations” (18%), and “potential changes to building codes” (17%). The mean risk level for the legal and regulatory risks was 26%.
|
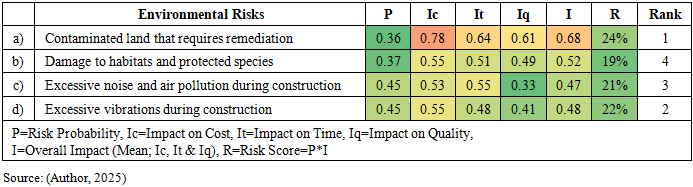
3.3.6. Environmental Risks
- Of all the risk categories, environmental risks were found to have the lowest risk scores, attributed mainly to their low probabilities. Results in Table 11 revealed the most dominant environmental risk to be “contaminated land that requires remediation” with a risk level of 24%, followed by “excessive vibrations during construction” (22%). The two least significant market risks were “excessive noise and air pollution during construction” (21%) and “damage to habitats and protected species” (19%). The mean risk level for the environmental risks was 22%. Compared to other types of risks, these risks were found to be the least significant.
|
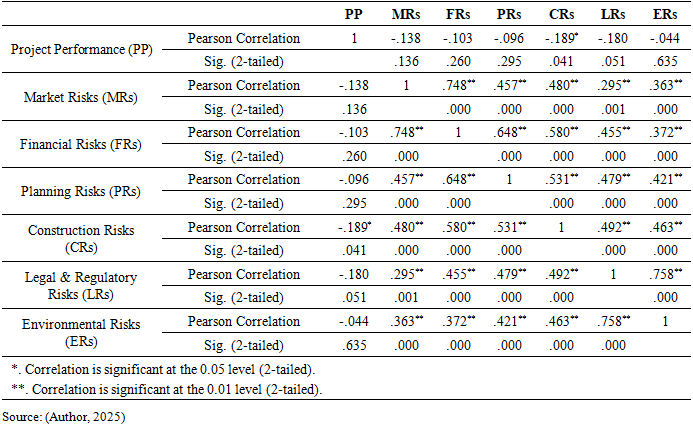
3.4. Effect of Risks on the Performance of MFCPs
- Table 12 presents a correlation analysis between the performance of MFCPs and the six types of risks affecting MFCPs. Construction Risks show a significant negative correlation with project performance (r=-0.189, p=0.041). This means that as construction risks increase (e.g., risks related to workmanship, delays, onsite accidents, materials problems), project performance tends to decline. This aligns with existing literature highlighting that construction-phase uncertainties and disruptions directly degrade cost, schedule, and quality outcomes [56]. Legal and Regulatory Risks have a marginally significant negative correlation with performance (r=-0.180, p=0.051). Though just above the conventional 0.05 threshold, this suggests that risks arising from regulatory changes, permit delays, compliance failures, or legal disputes can adversely affect project outcomes. Other risk types, market, financial, planning, and environmental risks, show negative but statistically non-significant correlations with performance in this dataset. These negative trends suggest that increasing risks in these areas may diminish project success, but the evidence here is not strong enough to confirm these relationships statistically. It is possible that their impact is indirect, mediated by other factors, or that the limited sample size masks significance. The weakest and non-significant effect is observed with environmental risks (r=-0.044, p=0.635). This may indicate that while environmental factors (e.g., weather, site conditions) are important, their direct effect on overall project performance in mortgage-financed projects is less pronounced or sufficiently managed in the studied context.
|
4. Implications
- These findings have four implications. First is the importance of managing construction risks. Since construction risks are significantly linked to poorer project performance, project managers and stakeholders need to prioritize mitigating construction-phase uncertainties. Strategies include rigorous quality control, timely inspections, skilled workforce training, and contingency planning, all of which improve the reliability of execution phases [47]. The second implication is on addressing legal and regulatory risks. The marginal significance of legal and regulatory risks underscores the practical importance of navigating compliance efficiently, ensuring timely permits, and proactively managing regulatory changes. Poor handling of this domain can cause delays, increase costs, and degrade quality [56]. Third is the need for integrated risk management. Strong intercorrelations among risks suggest the necessity of integrated risk management frameworks that simultaneously monitor market, financial, planning, construction, legal, and environmental risks. Isolated risk mitigation may be less effective than holistic approaches, enabling early detection and coordinated responses [63]. The last implication is on understanding non-significant risks. While market, financial, planning, and environmental risks were not statistically significant here, they should not be discounted. They may exert indirect influence through effects on budget, cash flow, schedule, or contractor performance, as documented in broader literature [56]. Future research might investigate mediation effects to reveal these subtler relationships.
5. Conclusions
- The study reveals that mortgage-financed construction projects (MFCPs) in Kenya face significant risks that adversely affect their performance, particularly in terms of cost, schedule, quality, safety, and cash flow. Construction risks, especially those related to material costs, project delays, and contractor experience, have the most significant negative impact on project outcomes. Legal and regulatory risks, such as permit delays and design flaws, also marginally affect performance. Market, financial, planning, and environmental risks show negative but statistically non-significant correlations with project performance, suggesting their influence may be indirect or mediated by other factors. The strong intercorrelations among risk categories highlight the need for integrated risk management approaches rather than isolated mitigation strategies. Overall, the findings underscore the importance of proactive risk identification, assessment, and mitigation to enhance the success of MFCPs in Kenya.
6. Recommendations
- The paper makes the following recommendations:• Project managers and stakeholders should prioritize managing construction risks through rigorous quality control, timely inspections, skilled workforce training, and contingency planning.• Legal and regulatory risks should be addressed by ensuring timely permits, strict compliance with building codes, and proactive engagement with regulatory authorities.• Integrated risk management frameworks should be adopted to simultaneously monitor and mitigate market, financial, planning, construction, legal, and environmental risks.• Developers should conduct thorough due diligence on land titles and regulatory requirements to minimize legal disputes and compliance issues.• Future research should explore the mediation effects of non-significant risks and the effectiveness of holistic risk management strategies in the Kenyan construction context.
7. Limitations
- While this study provides valuable insights into the risks affecting MFCPs in Kenya, several limitations should be acknowledged. First, the research employed a cross-sectional survey, capturing data at a single point in time. This limits the ability to establish causal relationships between risk categories and project performance. Longitudinal studies would be better suited to track risk dynamics and performance outcomes over time. Second, the analysis was primarily descriptive, supplemented by risk importance indices and correlations. Although these methods highlight associations, they do not fully capture the joint or structural effects of multiple risk categories. Future research employing multivariate techniques such as regression or structural equation modelling (SEM/PLS-SEM) could provide deeper explanatory power.