International Journal of Construction Engineering and Management

p-ISSN: 2326-1080    e-ISSN: 2326-1102

2025;  14(1): 24-39

doi:10.5923/j.ijcem.20251401.03

Received: Feb. 9, 2025; Accepted: Feb. 26, 2025; Published: Mar. 10, 2025


Regression and Validation Modelling for Predicting Constraining Factors in Design-Bid-Build Project Delivery

Uswege Jacob Mwaipungu, Kimata Malekela, Rehema Monko

School of Architecture and Construction Economics (SACEM), Department of Building Economics, ARDHI University (ARU), Dar es Salaam, Tanzania

Correspondence to: Uswege Jacob Mwaipungu, School of Architecture and Construction Economics (SACEM), Department of Building Economics, ARDHI University (ARU), Dar es Salaam, Tanzania.

Email:

Copyright © 2025 The Author(s). Published by Scientific & Academic Publishing.

This work is licensed under the Creative Commons Attribution International License (CC BY).
http://creativecommons.org/licenses/by/4.0/

Abstract

This study develops a multiple regression model to examine factors influencing Design-Bid-Build (DBB) project delivery, analyzing the effects of owner, contractor, designer, and external project-related factors on project collaboration-related outcomes. The regression model demonstrates a high explanatory power, with an R-squared value of 0.783, indicating that 78.3% of the variance in project collaboration factors (PCRF) can be explained by the predictor variables. The model shows a strong correlation (R = 0.885) and a low standard error of 0.366, highlighting its predictive accuracy. ANOVA results validate the model's robustness, with a significant F-ratio (85.312, p < 0.001), confirming that the predictors significantly contribute to explaining variability in PCRF. An analysis of coefficients indicates that owner-related factors have the highest positive impact, followed by external project and contractor-related factors, each statistically significant (p < 0.05). To enhance reliability, an out-of-sample validation was conducted, yielding improved R-squared (0.881) and adjusted R-squared (0.869) values, and a reduced standard error (0.3205). The Durbin-Watson statistic (1.975) indicates no autocorrelation in the residuals, affirming model stability. These findings demonstrate the model’s strong predictive power, confirming its applicability and utility for enhancing DBB project delivery. The validated model underscores the critical influence of owner, contractor, and external project factors, offering a reliable framework for stakeholders in the construction industry to anticipate and address factors impacting DBB project outcomes. The model serves as a reliable decision-making tool for construction stakeholders, offering several practical implications, including improved collaboration, proactive risk management, and data-driven policy formulation to enhance DBB project performance.

Keywords: Constraining factors, DBB, Regression, Model, Validation, Tanzania

Cite this paper: Uswege Jacob Mwaipungu, Kimata Malekela, Rehema Monko, Regression and Validation Modelling for Predicting Constraining Factors in Design-Bid-Build Project Delivery, International Journal of Construction Engineering and Management , Vol. 14 No. 1, 2025, pp. 24-39. doi: 10.5923/j.ijcem.20251401.03.

1. Introduction

The Tanzanian construction industry relies on the Design-Bid-Build (DBB) system to deliver various building and civil engineering projects. These projects contribute significantly to the country's socio-economic progress by creating jobs, providing housing, and increasing GDP, which reached 14.1% in 2022 compared to 14.0% in 2021 [102].
Developing nations often struggle with inadequate infrastructure, including roads, prompting the United Nations (2020) to advocate for sustainable infrastructure development under its ninth Sustainable Development Goal. Achieving this goal requires projects, especially those using the DBB approach, to align with the outlined objectives.
Despite the Tanzanian construction industry's role in fostering growth, it often fails to meet project and business goals. While global underperformance is common, developing nations experience worse outcomes, such as time overruns. Similar challenges have been observed in countries like Kenya, South Africa, and Sri Lanka, where DBB projects face issues like cost and time overruns, low productivity, and stakeholder dissatisfaction [34] & [19].
The DBB method comprises three phases: design, bidding, and construction, with projects typically awarded to the lowest bidder. This approach results in separate contracts for the owner-consultant and owner-contractor relationships. Though widely adopted, concerns persist about its efficiency and performance [92] & [113].
Global construction industries widely adopt the DBB system, including in the USA, UK, Germany, and South Africa. Studies show that it remains the predominant procurement method, often due to various constraints that prevent the adoption of alternative systems, such as integrated project delivery [77] & [68].
Research highlights that DBB is still the preferred procurement system worldwide, accounting for 60% of construction projects globally. Its use dominates in countries like Ghana, Nigeria, Malaysia, and Saudi Arabia, driven by economic, technological, and legal factors that hinder alternative systems [52] & [20].
Tanzania's construction industry also predominantly uses the DBB system, where design and construction roles are distinct. This method accounts for over 95% of projects annually, yet it faces challenges like cost overruns, delays, and subpar quality due to the inherent separation of responsibilities [81] & [109].
The frequent criticism of DBB for its inability to meet performance expectations in cost, time, and quality is supported by studies identifying the separation of design and construction as a major factor behind poor outcome. Addressing these constraints could enhance public project delivery in Tanzania, benefiting government agencies, consultants, and contractors [95] & [71].
This paper can serve as a valuable reference for the Government and its agencies, consultant firms, and contractors regarding the constraining factors affecting DBB project delivery, aiming to improve the performance of public construction projects in the country.
Therefore, the objective of this study is to develop a model for predicting the constraining factors impacting the DBB project delivery in the Tanzanian construction industry.

2. Literature Review

2.1. General Overview of Design Bid Build

The DBB procurement method remains the most widely used system in the construction industry, with predictions of its dominance continuing for years [8] & [37]. In Tanzania, DBB contracts involve engaging a design team to create detailed project designs, prepare bills of quantities, and oversee tendering for contractors to compete [69]. The client selects the contractor offering the lowest bid that meets requirements, resulting in separate contracts between the client, the designer, and the contractor, but no direct contractual relationship between the designer and contractor [94] & [68].

2.2. Theoretical Underpinning

This study draws on the Theory of Constraints (TOC) and Contingency Theory to explore challenges in DBB project delivery. The TOC, introduced by Goldratt in 1984, posits that every process has bottlenecks that limit performance, emphasizing the need to identify and address these constraints [76]. Meanwhile, the Contingency Theory, developed by Fiedler in the 1960s, suggests there is no universal approach to managing projects. Instead, management strategies should adapt to project-specific circumstances, requiring flexibility to navigate construction complexities effectively [26].

2.3. Empirical Review

In the UK and many other countries, design-bid-build (DBB) is still the most common way to deliver construction services [73]. Low-bid procurement is the most common way to choose construction companies [35]; [57] & [99].
In Malaysia, the owner (client) of both the public and private sectors employed the DBB more frequently than other methods of procurement [114]. In both the public and commercial sectors, DBB was identified as the primary procurement method, followed by DB and CM [115].
The traditional system of procurement, design-bid-build (DBB) has been the dominant method of procurement for building contracts in Ghana since the inception of architectural practices [17]. [16] state that, the system dominates the Ghanaian construction industry largely because it is well established with wide applicability and simple procedures. This popularity in the Ghanaian construction sector makes it difficult to introduce new and contemporary procurement systems. In the Nigerian construction industry, more project delivery problems have been reported on the projects delivered through the traditional system than others. Delays are a significant problem in Nigerian building execution, according to [88]. In a similar vein, [9] claims that among other things, construction projects in Nigeria frequently experience budget slippage, productivity losses, revenue shortfalls, conflicts and litigation, contract cancellation, and delivery delays. The majority of the problems associated with this DBB method, especially during the construction phase develop from unseen and hidden problems and inefficiencies at the design stages [86].
The traditional system of procurement "remains mainly because most contractors and clients are familiar with it and so it often becomes a default approach," according to [100], who support this viewpoint. This argument is thought to be valid in Tanzania, where traditional procurement methods are frequently employed. Several African researchers, including [109]; [70]; [49b]; [69] & [62], have criticized the construction industry in Africa for its "detachment" from the extensive use of the traditional procurement method, despite its association with substandard projects, delays in project completion, cost overruns, and poor value for money.
Incomplete designs in DBB projects lead to rework, delays, and cost escalations [56] & [101]. Financial difficulties among owners and contractors further jeopardize project success, with risks like halted progress and reduced viability [27] & [10]. Labor shortages, delays in client decision-making, and payment processing issues also significantly hinder project timelines and productivity [49] & [51]. Addressing these issues requires strategies to enhance labor utilization, financial management, and decision-making efficiency [31] & [49].
Table 1. Summary of the factors limiting the successful delivery of Design-Bid-Build (DBB) projects
     

2.4. Model

A model is a simple representation of a complex phenomenon. Since it is an abstraction, not every characteristic of the actual system is present. A model does, however, include every characteristic—those necessary to define or solve the problem—in its whole. Engineers and physicians have always relied heavily on mathematical models, and modeling has long been an element of their scientific methodology [110].
The model's notion is most briefly explained by [105], who claim that the model is a useful tool for defining time-structured relationships between variables and for exploiting those ties to predict future occurrences. This study used regression modeling as a method to predict the performance of DBB project delivery.
2.4.1. Multiple Regression Model
According to the preexisting relationship, regression modeling examines how the values of independent variables might be utilized to forecast the values of dependent variables [14]. Regression analysis operated under the given sets of assumptions, as demonstrated below. A distorted relationship between the variables results from not respecting these presumptions [111].
i. The dependent variable should be measured on a continuous scale (i.e. it should either be an interval or ratio variable) and we can test this assumption by direct data inspection.
ii. Data must include two or more independent variables, which can be either continuous or categorical. We can test this assumption by direct data inspection too.
iii. Data should be independent of observations. There should be no autocorrelation between the values of the dependent variables. We can test this assumption by using the Durbin-Watson test.
iv. There should be a linear relationship between the dependent variable and each of your independent variables. The relationship between variables can be represented in a linear model [90]. We can test this assumption by using partial regression plots.
v. Data should exhibit homoscedasticity which means the variances in our data should remain similar, constant, and elliptical [90] & [111]. We can test this assumption by using a partial regression plot or by making a scatter plot of regression standardized residual against regression standardized predicted value.
vi. There should be no multi-collinearity among independent variables. Multicollinearity is a statistical concept which occurs when two or more independent variables are highly correlated. Multicollinearity influence variance and cause type II error. There are several methods of testing multicollinearity among them are tolerance and variance of inflation factor – VIF [111].
vii. There should be no significant outliers to protect the residual and make the prediction outcome valid. We can test this assumption by using case-wise diagnostics.
viii. The residuals (errors) of the regression line should be approximately normally distributed. We can test this assumption by using a Histogram with a superimposed normal curve and the normal P-P plot.
To test assumptions number 1 and 2 can be determined by mere inspection of the raw dataset while assumptions number 3 up to 8 are performed simultaneously with the regression analysis.
(1)
The equation represents the relationship between project collaboration-related factors and other constraining factors impacting DBB project delivery, whereby the change in the dependent variable (project collaboration-related factors) is influenced by the shift independent variable (other constraining factors impacting DBB project delivery). In the equation above, "Y" is the dependent variable, which is project collaboration-related factors. represents population intercept; it is the term of construction project performance when all other factors in the equation are kept constant. are the slope parameters; they determine the strength of influence of each constraining factor on the dependent variable (project collaboration related factors)."X1–X10" are the terms representing independent variables (explanatory/control variables). Finally, "ε" expresses model error terms because changes in the independent variables cannot fully explain changes in the dependent variables. As a result, the disturbance reflects any other factors that affect the dependent variable but are not accounted for in this model.

2.5. Model Validation

Model validation is the process of evaluating the performance of a trained model to ensure it works well on new or unseen data [23]. It confirms that the model achieves its intended purpose and is typically conducted after model training using a testing dataset, which may or may not overlap with the training data. There are two main approaches to model validation based on how the data is used for testing.
2.5.1. In-Sample Validation
This approach uses data from the same dataset that was used to develop the model. The dataset is divided into a training set and a holdout set. The training set is used to train the model, and the holdout set is used to test the model's performance.
2.5.2. Out-of-Sample Validation
This approach uses entirely different data from the data used for training the model. It provides a more reliable prediction of the model's accuracy on new inputs, making it a better measure of the model's performance in real-world scenarios.

3. Methodology

3.1. Research Design, Approach

This study is a quantitative in nature; a questionnaire survey was administered to 156 contractors, civil consulting firms and project client in Dar es salaam part of Tanzania. The region comprises of 5 districts. A total of 124 questionnaires were returned and analyzed. This represented 79.49% response rate against researches of [83] with 52% and [112] with 54%. The analysis, conducted with IBM SPSS Statistics for Windows, Version 27.0, includes descriptive and inferential statistics, starting with insights from a pilot study to ensure the robustness of the instrument.

3.2. Population

The target population size studied for quantitative research is known, as established from the Contractor's Registration Board (2023) website by selecting civil contractors’ class one "N" =75 and from the Engineers Registration Board (2023) website by selecting civil consultant’s "N" =100 located in Dar es Salaam Region. The entities were selected using [53] formula.
(2)
Where N = size of population; n = size of sample; z = standard variate at a given confidence level worked out from table under normal curve (1.96 at 95%); e = margin/sampling error or precision rate (5%); p = sample proportion (0.5) and q = 1-p, the formula also used by studies like [60] & [66].

3.3. Questionnaire Survey Administration

The data were collected through questionnaires survey. The quantitative approach was preferred because results are consistent and replicable when the study is repeated under similar conditions, Surveys, experiments, and other quantitative tools can collect large amounts of data in a relatively short period [21] & [45]. The questionnaires were distributed by hand as well as online using Google Forms between January 2024 and June 2024. The questionnaire comprised close-ended questions and was in 4 sections. Section 1 comprised preliminaries information, section 2 demographic information, section 3 awareness and practice of DBB, and section 4 constraining factors impacting DBB project delivery, using a 5-point Likert scale were applied to increase reliability and validity of research, increase response rate and response quality along with reducing respondents’ frustration level ([61]. Where by 1 = No impact, 2 = Low Impact, 3 = Moderate impact, 4 = High impact, and 5 = Very high impact. Out of the 156 questionnaires dispersed, only 124 questionnaires were returned, and 124 were deemed legitimate, representing a 75% response rate.

3.4. Data Analysis

Using the aid of IBM SPSS Statistics for Windows, Version 27.0 and Microsoft Excel software, the quantitative data acquired for this study were analysed using descriptive statistics from which measures of central tendency, specifically mean values and standard deviation and inferential statistics from which measures reliability, validity, factor analysis, pearson correlation, multiple linear regression analysis.
3.4.1. Model Development
Regression analysis is a statistical technique used to develop models that examine relationships between multiple variables, particularly focusing on the interaction between dependent and independent variables in DBB project delivery. Among various regression methods, multiple regression was selected for this research as it effectively models the impact of multiple independent variables on a dependent variable, allowing for the assessment of overall model fit and the contribution of each predictor to total variance. This study conducted various regression analyses, including descriptive statistics to summarize data distribution, a model summary to evaluate regression fit, ANOVA to determine model significance, and regression coefficients to estimate the influence of each independent variable. A multiple regression equation (refer equation 1 above) was formulated to model the relationship between constraining factors affecting DBB project delivery, with project collaboration-related factors as the dependent variable and various independent variables influencing its outcome. The model also incorporates an error term to account for unexplained variations. By employing this regression model, the study aims to quantify the impact of different constraints on DBB project performance, enhancing understanding and decision-making in construction project management.
3.4.2. Model Validation
In this study, model validation employed a quantitative approach using an out-of-sample validation method. This approach ensures the accuracy of the model by using data from a new sample of respondents who have not been involved in the original model's development, thereby avoiding bias and repetition. To assess the model's performance, the out-of-sample validation method was preferred.
The study employed an out-of-sample validation strategy, using a fresh dataset to validate the model. To ensure the information obtained was free from bias and repetition, 50 respondents were selected from the 156 construction professionals in the general sample using the train/test split method of model validation (68%-32%). Split off 32% of the data which was 50 respondents from the original data respondents of 156. The remaining 106 respondents formed the targeted validation population. According to [53] sample formula below, 83 respondents were determined to be the appropriate size for the model validation sample.
(3)
Validation Sample Size
(4)
n = 83
3.4.3. Reliability in Quantitative Research
Reliability refers to the consistency or stability of data. Questionnaires were distributed to project professionals, project managers, consultants (engineers and quantity surveyors), and contractors. Cronbach's Alpha was used to evaluate reliability. Alpha values (coefficients) range from zero (0), indicating no internal consistency, to one (1). A higher coefficient indicates a more reliable measurement scale, with an alpha coefficient above 0.7 considered reliable [54]. In this study, a score above 0.7 is generally considered acceptable, but values between 0.90 and 0.95 are preferred.

4. Findings and Discussion

Table 2 provides a demographic overview of the study participants, highlighting gender, experience, education, profession, and firm type. The sample is predominantly male, with 89 males (71.8%) and 35 females (28.2%), reflecting the male-dominated nature of the construction industry. Participants have varied experience levels, with 26.6% having 16–20 years, 23.4% having 11–15 years, and 25.0% having over 20 years, indicating a seasoned and knowledgeable workforce. In terms of education, most participants hold a Bachelor’s degree (63.7%), while 26.6% have a Master’s degree, showcasing a well-educated sample with a significant proportion of advanced qualifications.
Table 2. Background details of the participants
     
The largest professional groups include Engineers (45.2%), Quantity Surveyors (37.9%), and Project Managers (10.5%), representing a diverse mix of roles essential to the construction sector. Participants are also nearly evenly distributed between Contractor firms (46.0%) and Consultancy firms (44.4%), with 9.7% from Client/Financier organizations, offering a broad perspective on industry dynamics. As emphasized by [12], these demographic attributes suggest that the participants possess the necessary qualifications, experience, and expertise to provide accurate and reliable insights for the study.

4.1. Understanding and Implementation of Design-Bid-Build (DBB) Project Delivery in Tanzania's Construction Industry

The findings reveal that while a significant portion of stakeholders (59.7%) are familiar with the Design-Bid-Build (DBB) method, only 9.7% possess an in-depth understanding, indicating a general awareness but limited expertise among most industry professionals. DBB is widely used in the construction sector, with 46.0% of stakeholders employing it occasionally and 42.7% using it frequently. Only a small fraction (2.4%) rarely uses DBB, and 3.2% never adopt it, reaffirming its dominance as a preferred project delivery method. In terms of direct experience, stakeholders exhibit a range of involvement, with 26.6% having participated in 11–15 DBB projects, 16.9% in 15–20 projects, and 23.4% in more than 20 projects. This distribution reflects a mix of moderately and highly experienced professionals, suggesting that while many stakeholders have practical exposure to DBB, the depth of knowledge varies significantly.
Stakeholder satisfaction with DBB project performance presents a mixed perspective. Only 3.2% of respondents are very satisfied, while 38.7% express satisfaction, indicating that a notable proportion finds DBB effective. However, a significant portion (43.5%) remains neutral, possibly reflecting uncertainty about the method’s efficiency or a lack of strong positive or negative experiences. Additionally, 14.5% of stakeholders report dissatisfaction, pointing to existing challenges that need to be addressed. These findings highlight the widespread use of DBB in Tanzania's construction industry but also reveal gaps in stakeholder familiarity, varying levels of experience, and a considerable proportion of neutral or dissatisfied respondents. This suggests opportunities for improvement in DBB processes, such as enhanced stakeholder education, better project management strategies, and refinements in implementation to optimize its effectiveness and overall performance.
Table 3. Understanding and Implementation of Design-Bid-Build (DBB) Project Delivery in Tanzania's Construction Industry
     

4.2. Reliability Test

A Reliability test was performed using Cronbach's Alpha test where values ranging from 0.7 and above are considered reliable [32] & [15]. The Cronbach's Alpha test for this study ranged from 0.867 to 0.918 (i.e. above the recommended threshold value of 0.7), indicating that the data obtained by the research instrument was internally consistent.
Table 4. Reliability Analysis
     

4.3. Model Develop for Predicting the Constraining Factors Impacting the DBB Project Delivery

Model Summary
Table 5, the Model Summary, presents the statistical summary of the regression model used in the analysis. The model aims to predict the relationship between the predictor variables and the outcome variable. Here's what each parameter in the Model Summary means:
R: The correlation coefficient (also known as the Pearson correlation coefficient) measures the strength and direction of the linear relationship between the predictor variables and the outcome variable [104]. The correlation coefficient (R=0.885) indicates a strong positive linear relationship between the predictor variables and the outcome variable.
R Square (R²): It assesses the model's goodness of fit. This value represents the proportion of the variance in the outcome variable that is predictable from the predictor variables [58]. In this model, R² is 0.783, shows that 78.3% of the variation in the outcome variable is explained by the predictor variables. The remaining 21.7% is attributable to factors not included in the model. In bivariate linear regressions, the R-square is calculated by squaring the correlation coefficient (.885*.885=.783).
Adjusted R Square; This is a modified version of R² that adjusts for the number of predictor variables in the model. It penalizes the addition of unnecessary predictor variables that do not significantly improve the model's explanatory power. In this model, the Adjusted R Square is 0.774.
Std. Error of the Estimate; It indicates the accuracy of the regression model in predicting the outcome variable. In this model, the standard error of the estimate is 0.36600.
Durbin Watson Test; Linear regression analysis assumes minimal or no autocorrelation in the data, which occurs when residuals are not independent [89]. To check for autocorrelation, the Durbin-Watson test was applied. A Durbin-Watson value between 1.5 and 2.5 typically indicates no autocorrelation. As shown in Table 5, the Durbin-Watson statistic was 2.231, confirming the absence of autocorrelation in the data. This outcome is consistent with the results reported by [91], which showed that the predictor variables—government policies (X1), procurement resources (X2), and levels of planning (X3) —explain 60.3% of the variations in the dependent variable (R² = 0.603) and the Durbin-Watson statistic was 1.604.
Table 5. Model summary
     
Analysis of Variance (ANOVA)
Table 6 presents the results of ANOVA for the regression model used in the analysis. ANOVA results are presented here to tell us whether the model works or not by indicating whether the predictors put together are significant or not significant. ANOVA assesses the significance of the overall regression model by comparing the variance explained by the model (regression) to the variance not explained by the model (residual) and the total variance. The F-ratio tests whether the overall regression model is a good fit for the data. The F-test will test the joint effects of all the variables together. An F-ratio of 85.312 in this case which is greater than 1 yields an efficient and acceptable model. A 95% confidence interval which represents a 5% or 0.05 level of significance was set for the analysis therefore, a signed value of 0.001 in this case which is less than 0.05 is acceptable (p < 0.001). In a similar vein, [45] examined how leadership strategies impact the performance of construction projects in Dar-es-Salaam, Tanzania, and reached conclusions consistent with these findings. This suggests that the regression model effectively explains a significant amount of the variability in the outcome variable. This means the predictors are significant and the model works.
Table 6. Analysis of Variance (ANOVA)
     
Coefficients for Regression Model.
The coefficients will test the unique effect of each independent variable. Table 7 provides insights into the strength of the relationship among various constraining factors impacting Design-Bid-Build (DBB) project delivery. The unstandardized coefficients (B) represent the change in the outcome variable for a one-unit change in the predictor variable, while the standardized coefficients (Beta) allow for comparison of the relative importance of different predictors. In any circumstance, tolerance should not be < 0.1 VIF should not be >10. The collinearity statistics show a tolerance of 0.280 and a VIF (Variance Inflation Factor) of 3.574, indicating that multicollinearity is not a concern.
Owners Related Factors (ORF) exhibit a more substantial positive effect with an unstandardized coefficient (B) is 0.340, indicating that for every one-unit increase in owners-related factors, the outcome variable increases by 0.340 units. With a standardized coefficient (Beta) of 0.304, the Beta value here tells us ORF has the highest contribution to the model, and the relationship is statistically significant (Sig. < 0.001). The collinearity statistics show a tolerance of 0.258 and a VIF of 3.875, indicating no significant multicollinearity issues.
Contractors Related Factors (CRF) show a positive effect, with an unstandardized coefficient (B) of 0.215. This implies an increase in the outcome variable by 0.215 units for every one-unit increase in CRF. The standardized coefficient (Beta) is 0.208, the Beta value here tells us CRF has a third contributor to the model. The relationship is statistically significant (Sig. = 0.030). The collinearity statistics show a tolerance of 0.205 and a VIF of 4.877, indicating no significant multicollinearity issues.
Project External Related Factors (PERF) has a strong positive effect on the outcome variable with a standardized coefficient (Beta) of 0.298, the Beta value here tells us PERF has a second contribution to the model and the relationship is statistically significant ((Sig. < 0.001). For every one-unit increase in the project external related factors (PERF), the outcome variable increases by 0.277 units. The collinearity statistics show a tolerance of 0.253 and a VIF of 3.952, indicating no significant multicollinearity issues.
From Table 7, when examining the significance (sig.) values, only three variables significantly contribute to the prediction when other predictors are considered. These variables, with p-values less than 0.05, are owner-related factors, contractor-related factors, and project external-related factors. However, all predictors must be included to achieve this result, as the overall F value is calculated with all the variables. Removing any predictor deemed insignificant could affect the significance levels of the remaining predictors.
The standardized coefficients (Beta) used to compare the contribution of each predictor in the model indicate that the owner-related factors have a greater contribution with the standardized Beta value of 0.304, followed by the project external related factor with the standardized Beta value of 0.298 and the last contractor related factors with the standardized Beta value of 0.208, but all variables are highly statistically significant with p-values less than 0.05.
Multiple Linear Regression Equation Model
Inputs to the model 
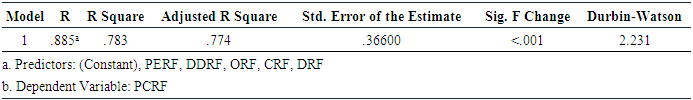
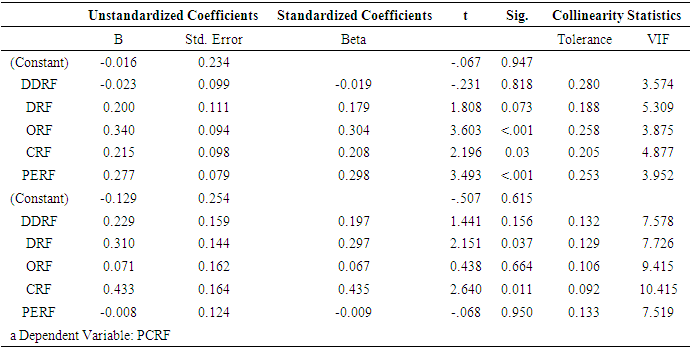
presented in Table 7 are 
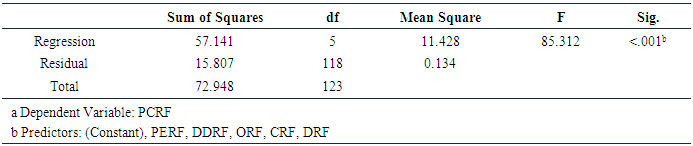
as constant/intercept and coefficients for owner-related factors, contractor-related factors, and project external-related factors respectively. The regression equation based on the inputs from Table 7 will be
Whereby: Y = Project collaborated related factors, X1 = Owner related factors, X2 = Contractor related factors, X3 = Project external related factors.
Table 7. Coefficient for Regression Model
     
Now that we have our coefficients, let's use the regression equation model 
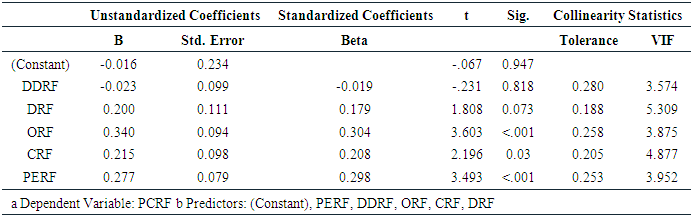
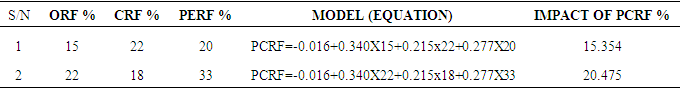
to make predictions as required. We will predict the impact of PCRF for the following cases:
1. ORF(X1) =15%, CRF(X2) =22% and PERF(X3) =20%
2. ORF(X1) =22%, CRF(X2) =18% and PERF(X3) =33%
To apply the regression model, we substitute the values for ORF, CRF, and PERF into the equation. The results are presented in the table below:
Table 8. Model for predicting the constraining factors impact DBB project delivery
     
Therefore, when ORF (X1) is 15%, CRF (X2) is 22%, and PERF (X3) is 20%, the impact of PCRF is 15.35%. When ORF (X1) is 22%, CRF (X2) is 18%, and PERF (X3) is 33%, the impact of PCRF is 20.48%. This demonstrates how to perform multiple linear regression analysis using SPSS and predict the constraining factors impacting DBB.
These findings suggest that the regression model provides a comprehensive and statistically sound representation of the factors influencing the topic under investigation, effectively capturing the underlying patterns and relationships within the data.

4.4. Model Validation

Out of the 83 structured questionnaires that were administered to seek opinions on the applicability, effectiveness, and adaptability of the multiple regression model from experts/practitioners, 54 were returned, resulting in a 65% response rate. The influence of R2, which affects model fitness, was examined by comparing the validated model (Model 2) to the original model (Model 1). The results are detailed in Tables 5 above and 9 below.
Table 9. The Established Validation Model Summary
     
This comparison helps in understanding how well the validated model performs relative to the original model and provides insights into the model's accuracy and generalizability. The R2 value is a key metric in this comparison as it indicates the proportion of variance in the dependent variable that is predictable from the independent variables.
4.4.1. Validation Results
The results of the validation on the new dataset show significant improvements in the model's predictive power. Key metrics from the comparison between the original model (Model 1) and the validated model (Model 2) are as follows:
i. R-squared value: Increased from 0.783 to 0.881. This indicates that the five predictors in the model can now explain 88.1% of the variance in Project collaboration-related factors, up from 78.3%.
ii. Adjusted R-squared value: Increased from 0.774 to 0.869. This suggests that the inclusion of multiple predictors has indeed improved the model's predictive power.
iii. Standard error of the estimate: Decreased from 0.36600 to 0.3205. A lower standard error indicates that the model's predictions are more precise and closer to the actual values.
iv. Significance F Change (Sig. F Change): A value of 0.001 indicates that the predictors collectively contribute significantly to predicting Project collaboration-related factors.
v. Durbin-Watson value: The value of 1.975 falls within the acceptable range of 1.5 to 2.5, suggesting no significant autocorrelation in the residuals.
These results demonstrate that the validated model (Model 2) has improved in terms of predictive accuracy and reliability compared to the original model (Model 1). The higher R-squared and adjusted R-squared values, along with a lower standard error of the estimate and an acceptable Durbin-Watson value, all indicate that the model is better at explaining and predicting project outcomes based on the given predictors. Similarly, [82] highlights that a key indicator of a strong model is its ability to make accurate predictions. The predictive power of multiple regression models can be evaluated using R² and adjusted R² values, which quantify the proportion of variance explained or the reduction in error achieved by the model [82]. Upon rechecking the coefficients and significance of the two models as shown in Table 10, several key findings are evident:
Model One:
i. Predictors: Owners, contractors, and project external related factors have statistically significant coefficients at the 95% confidence level, with p-values less than 0.05.
ii. Intercept Coefficient: -0.016, indicating that when all the independent variables are zero, the predicted value of the dependent variable is close to zero.
Model Two:
i. Predictors: Designers and contractors-related factors have statistically significant coefficients at the 95% confidence level, with p-values less than 0.05.
ii. Intercept Coefficient: -0.129, similarly indicating that when all the independent variables are zero, the predicted value of the dependent variable is close to zero.
Common Predictor:
i. The contractor-related factors have statistically significant coefficients at the 95% confidence level, with p-values less than 0.05 in both models.
Overall, these validation results suggest several important points:
i. Improvement in Predictive Power: The model has improved in its predictive power as evidenced by the higher R-squared and adjusted R-squared values.
ii. Significance of Predictors: Specific predictors (owners, contractors, project external related in Model One; designer and contractors related factors in Model Two) are significant, highlighting their importance in predicting project outcomes.
iii. Reliability: The consistency of the contractor-related factors being significant in both models further reinforces the reliability of the model in predicting the project outcomes.
These findings confirm that the validated model is more robust and reliable for predicting project outcomes, making it a valuable tool for understanding and improving DBB project delivery in the construction industry.
Table 10. The Coefficient for Regression Model of Original and Validation Model
     
Model Strength and Fit: The model demonstrates a strong fit and predictive power, with an R² of 0.783, explaining 78.3% of the variability in DBB project delivery. This high R² value indicates that the selected predictor variables significantly contribute to predicting project delivery outcomes.
Significance of Predictors: The ANOVA results indicate that the model is statistically significant (p < 0.001), validating that the predictor variables collectively explain a substantial amount of the variation in DBB project delivery.
Impact of Specific Predictors:
Owner-Related Factors (ORF) have the highest impact on DBB project delivery (Beta = 0.304, p < 0.001), emphasizing the pivotal role that owner-related decisions and actions play in the success of DBB projects.
Project External Related Factors (PERF) also show a strong positive effect on project delivery (Beta = 0.298, p < 0.001), suggesting that external factors, like regulatory and environmental conditions, significantly affect project timelines and quality.
Contractor-Related Factors (CRF) are the third most impactful predictor (Beta = 0.208, p = 0.030), underscoring the role of contractors’ expertise, resources, and management in successful project delivery.
Non-Significant Predictors: Design Documentation Related Factors (DDRF) and Designer-Related Factors (DRF) showed lower statistical significance, suggesting that while they influence project delivery, their impact may be more situational or minor compared to other factors.
Regression Model:
The regression equation Y=-0.016+0.340XORF+0.215XCRF+0.277XPERF+ε. represents the predictive model, emphasizing the significant positive contributions of owner, contractor, and external factors to DBB project delivery.

5. Conclusions and Recommendations

5.1. Conclusions

This study developed a predictive model to analyze the constraining factors affecting Design-Bid-Build (DBB) project delivery in the Tanzanian construction industry. Through an extensive survey of experienced construction professionals, the research confirmed that various constraining factors including owner, project external, contractor, designer, design documentation, project collaboration related factors significantly impact DBB project success. The multiple linear regression model developed provides a reliable tool for predicting these constraints’ effects, allowing for systematic evaluation of their relationships with project performance. By quantifying the strength and significance of these factors, the model enables stakeholders to anticipate risks (Refer Table 8) and implement proactive mitigation strategies.
The findings suggest that these constraints are interrelated, requiring an integrated approach to project planning and execution rather than addressing individual factors in isolation. The study contributes both theoretical and practical knowledge, offering a data-driven approach to understanding DBB project constraints. It highlights the importance of strategic interventions, policy adjustments, and improved project management practices to enhance project delivery. Additionally, the predictive model serves as a valuable reference for future research and applications beyond Tanzania, supporting improved DBB project performance on a broader scale.

5.2. Recommendations

Enhanced Owner Involvement: Active owner participation in project planning and decision-making is crucial for the successful delivery of DBB projects. Owners play a key role in setting project objectives, ensuring that budgets are adequate, timelines are realistic, and communication is clear among all stakeholders. Predictive models can provide valuable insights into how owner involvement impacts project outcomes, demonstrating that proactive decision-making by owners leads to better cost control, fewer delays, and improved quality. For instance, if data analysis reveals that insufficient budget allocation frequently results in project delays due to underfunding of critical activities, owners can take corrective action by securing adequate financial resources before project commencement.
Improvement in Design Documentation and Coordination: While design documentation-related factors may have a comparatively lower impact on DBB project performance than other constraints, enhancing design accuracy and improving coordination between designers and contractors can significantly reduce rework, minimize delays, and improve overall project efficiency. Predictive models analyzing DBB projects often reveal that inconsistencies in design documentation, incomplete drawings, and lack of coordination between stakeholders contribute to costly modifications during construction. By addressing these issues early in the project lifecycle, unnecessary revisions and construction errors can be mitigated.

5.3. Implication of Model in Construction Industry

The developed multiple regression model, which includes predictors such as Design documentation related factors, designer related factors, owner related factors, contractor related factors and project external related factors, can have important implications for the construction industry.
Improved Planning and Scheduling: Predictive models play a vital role in enhancing planning and scheduling by forecasting potential delays and disruptions, enabling project managers to take proactive measures. By analysing historical data from past projects, these models can identify key factors that contribute to schedule overruns, such as contractor inefficiencies, material shortages, design changes, and adverse weather conditions. A multiple regression model can quantify the impact of each factor on project timelines, allowing stakeholders to prioritize risks and implement targeted mitigation strategies. For example, if the model predicts that late procurement of critical materials is a recurring cause of project delays, managers can adjust procurement schedules, negotiate early supplier agreements, or maintain buffer stock for essential materials.
Quality Control: Predictive models play a crucial role in identifying potential quality issues in design and construction practices, ensuring compliance with industry standards and regulations. By analysing historical project data, these models can detect patterns that lead to defects, structural failures, or deviations from expected performance. For example, a multiple regression model can assess the relationship between material quality, contractor experience, and project defects, helping stakeholders identify the most critical factors affecting construction quality. If the model indicates that poor design documentation is a major contributor to structural issues, policymakers and project managers can implement stricter design review protocols and enforce higher documentation standards before construction begins.

5.4. Implications of Multiple Regression Models for Policy Direction in the Construction Industry

Multiple regression models, which predict outcomes based on several independent variables, can offer valuable insights and guide policy direction in the construction industry. These models can analyse the impact of various factors on project delivery outcomes, such as cost, time, and quality.
Evidence-Based Policy Making: Multiple regression models provide a data-driven approach to understanding the relationships between various factors affecting DBB construction project outcomes, including cost, time, and quality. By analysing historical project data, these models quantify the impact of independent variables such as contractor performance, design quality, stakeholder collaboration, and external market conditions on project success. This quantitative evidence enables policymakers to make informed decisions, ensuring that policies are based on objective analysis rather than assumptions. For instance, if a regression model indicates that poor design documentation significantly contributes to cost overruns and delays, policymakers can implement stricter design review processes and enforce higher documentation standards. Similarly, if findings show that contractor experience strongly influences project performance, procurement policies can be adjusted to prioritize well-qualified contractors.
Economic Impact: The development of predictive models in construction can significantly influence economic policy by providing data-driven insights into the benefits of using locally manufactured materials. These models can analyse how the selection of construction materials such as steel reinforcement, cement, PVC, and steel pipes produced by local industries affects project costs, quality, and timelines. By demonstrating the economic advantages of sourcing materials locally, such as reduced transportation costs, shorter supply chain disruptions, and job creation, policymakers can justify the implementation of regulations that prioritize local procurement. For instance, if a regression model shows that projects using locally produced materials experience fewer delays and cost overruns compared to those relying on imported alternatives, government agencies can introduce incentives like tax reductions or subsidies for contractors who source locally.
In conclusion, the developed model effectively predicts the main constraining factors impacting DBB project delivery, providing valuable insights for improving project outcomes through targeted interventions on key factors like owner involvement, external risk management, and contractor selection.

ACKNOWLEDGEMENTS

This research was conducted with the support of the National Construction Council (NCC) of the United Republic of Tanzania, in collaboration with Ardhi University.

References

[1]  Abdul Aziz, A.-R. (2008). Patterns in strategic joint ventures of selected prominent cross-border contractors for 1999-2003. Canadian Journal of Civil Engineering.
[2]  AbouDargham, S., Bou Hatoum, M., Tohme, M., & Hamzeh, F. (2019). Implementation of integrated project delivery in Lebanon: Overcoming the challenges. Paper presented at the Proceedings of the 27th Annual Conference of the International. Group for Lean Construction, Dublin, Ireland.
[3]  Agbaxode, P.D.K., Saghatforoush, E. and Dlamini, S. (2020) ‘Integrated Project Delivery (IPD): Projecting a Common Good to Key Participants and the Project’, in Proceedings of the 36th Annual ARCOM Conference, 7-8 September 2020. Association of Researchers in Construction Management, UK: In: Scott, L and Neilson, C J (Eds), pp. 136–145.
[4]  Agbaxode, P., Dlamini, S., & Saghatforoush, E. (2021). Design documentation quality influential variables in the construction sector. Paper presented at the IOP Conference Series: Earth and Environmental Science.
[5]  Agbaxode, P.D.K., Dlamini, S. and Saghatforoush, E. (2021b) ‘Quality of Design Documentation in the Construction Industry: A Review Using Meta-Synthesis Approach’, International Journal of Innovation and Technology Management, p. 2130003.
[6]  Akampurira, E., & Windapo, A. (2018). Factors influencing the quality of design documentation on South African civil engineering projects. Journal of the South African institution of civil engineering, 60(3), 41-48.
[7]  Alarcón, L. F., & Mardones, D. A. (1998). Improving the design-construction interface. Paper presented at the Proceedings of the 6th Annual Meeting of the International Group for Lean Construction.
[8]  Alofi, A., Kashiwagi, J., Kashiwagi, D., & Sullivan, K. (2016). An Analysis of the Current Procurement System in Saudi Arabia. 52nd ASC Annual International Conference Proceeding, 2011.
[9]  Anana, W. G. (2021). Ethical Practices and Contract Management in Ministry of Finance, Budget and National Planning (Nigeria). Kampala International University.
[10]  Arantes, A., & Ferreira, L. M. D. (2020). Underlying causes and mitigation measures of delays in construction projects: An empirical study. Journal of Financial Management of Property and Construction, 25(2), 165-181.
[11]  Assaf, S. A., & Al-Hejji, S. (2006). Causes of delay in large construction projects. International Journal of Project Management, 24(4), 349-357.
[12]  Babatunde, S. O., Ekundayo, D., Udeaja, C., & Abubakar, U. O. (2020). Stakeholder perceptions of drivers for, and barriers to, the incorporation of sustainability in PPP infrastructure projects in Nigeria. Open House International, 45(4), 373-386.
[13]  Baloyi, M. and Agumba, J.N. (2014) ‘Causes of disputes in construction projects in South case of Gauteng province’, in. University of the Witwatersrand, Johannesburg, South Africa: Proceedings 8th Construction Industry Development Board (CIDB) Postgraduate …, pp. 179–187.
[14]  Belokrylova, O. S., Belokrylov, K. A., Tsygankov, S. S., Syropyatov, V. A., & Streltsova, E. D. (2021). Public procurement quality assessment of a region: regression analysis. International Journal of Sociology and Social Policy, 41(1/2), 130-138.
[15]  Bonett, D.G. and Wright, T.A. (2015) ‘Cronbach’s alpha reliability: Interval estimation, hypothesis testing, and sample size planning’, Journal of Organizational Behavior, 36(1), pp. 3–15.
[16]  Buertey, J.T. Dadadzogbor, E. & Atsrim, F. (2018): Procurement path influencing factors in Ghana: managing the challenge of cultural shift, International Journal of Construction Management, DOI: 10.1080/15623599.2018.1508803.
[17]  Buertey, J. T., Dadadzogbor, E., & Atsrim, F. (2021). Procurement path influencing factors in Ghana: managing the challenge of cultural shift. International Journal of Construction Management, 21(1), 78-92.
[18]  Calahorra-Jimenez, M., Alarcón, L. F., Torres-Machi, C., Chamorro, A., & Molenaar, K. (2020). Improving cost performance in design-bid-build road projects by mapping the reasons for cost overruns into the project phases. Revista de la construcción, 19(2), 334-345.
[19]  Chileshe, N., & John Kikwasi, G. (2014). Critical success factors for implementation of risk assessment and management practices within the Tanzanian construction industry. Engineering, Construction and Architectural Management, 21(3), 291-319.
[20]  CMAA (2012) ‘An owner’s guide to project delivery methods’, CMAA (Construction Management Association of America) McLean, VA [Preprint], (Advancing Professional Construction and Program Management Worldwide).
[21]  Creswell, J.W. and Creswell, J.D. (2017) Research design: Qualitative, quantitative, and mixed methods approach. Sage publications. 88. Marketing, 77(4), pp. 1–16.
[22]  Dada, M.O. (2013) ‘Client and Consultant Organisations’ assessment of Design-Bid-Build Procurement Practice in Nigeria’, Journal of Building Performance, 4(1).
[23]  Dangeti, P. (2017). Statistics for machine learning: Packt Publishing Ltd.
[24]  Dargham, S. A., M. BouHatoum, M. Tohme, and F. Hamzeh. 2019. “Implementation of Integrated Project Delivery in Lebanon: Overcoming the Challenges.” In: Proc., 27th Conf. of the Intern. Group for Lean Constr., 917-928. Dublin, Ireland: International Group for Lean Construction.
[25]  Doloi, H., Sawhney, A., & Iyer, K. C. (2012). Structural equation model for investigating factors affecting delay in Indian construction projects. Construction Management and Economics, 30(10), 869-884.
[26]  Donaldson, L. (2006). The contingency theory of organizational design: challenges and opportunities. Organization Design: The evolving state-of-the-art, 19-40.
[27]  Dosumu, O., & Aigbavboa, C. (2018). An assessment of the causes, cost effects and solutions to design-errorinduced variations on selected building projects in Nigeria. Acta Structilia, 25(1), 40-70.
[28]  Dosumu, O., Idoro, G., & Onukwube, H. (2017). Causes of errors in construction contract documents in Southwestern, Nigeria. Journal of Construction Business and Management, 1(2), 11-23.
[29]  Easterbrook, S., Singer, J., Storey, M. A., & Damian, D. (2008). Selecting empirical methods for software engineering research. Guide to advanced empirical software engineering, 285-311.
[30]  Engström, S., & Hedgren, E. (2012). Sustaining inertia? Construction clients' decision-making and information-processing approach to industrialized building innovations. Construction innovation, 12(4), 393-413.
[31]  Evarist, C., Luvara, V. G., & Chileshe, N. (2023). Perception on constraining factors impacting recruitment and selection practices of building contractors in Dar Es Salaam, Tanzania. International Journal of Construction Management, 23(12), 2012-2023.
[32]  Gadisa, B., & Zhou, H. (2021). Exploring influential factors leading to the poor performance of public construction project in Ethiopia using structural equation modelling. Engineering, Construction and Architectural Management, 28(6), 1683-1712.
[33]  Gamil, Y., & Abd Rahman, I. (2023). Studying the relationship between causes and effects of poor communication in construction projects using PLS-SEM approach.
[34]  Habibi, M., Kermanshachi, S., & Rouhanizadeh, B. (2019). Identifying and measuring engineering, procurement, and construction (EPC) key performance indicators and management strategies. Infrastructures, 4(2), 14.
[35]  Hanák, T., Drozdová, A., & Marović, I. (2021). Bidding strategy in construction public procurement: A contractor’s perspective. Buildings, 11(2), 47.
[36]  Heidemann, A. & Gehbauer, F. 2010, “Cooperative Project Delivery in an Environment of Strict Design-Bid-Build Tender Regulations”. In:, Walsh, K. & Alves, T., 18th Annual Conf. of the International Group for Lean Const. Haifa, Israel, pp 581-587.
[37]  Hinton, M. A., & Hamilton, R. T. (2015). Competitive tendering and individual behaviour in the construction industry: convenient immorality at work. Construction management and economics, 33(11-12), 880-889.
[38]  Hwang, B.-G., Shan, M., & Lye, J.-M. (2018). Adoption of sustainable construction for small contractors: major barriers and best solutions. Clean Technologies and Environmental Policy, 20, 2223-2237.
[39]  Ikediashi, D. I., Ogunlana, S. O., & Alotaibi, A. (2014). Analysis of project failure factors for infrastructure projects in Saudi Arabia: A multivariate approach. Journal of Construction in Developing Countries, 19(1).
[40]  Israel, B., Mchopa, A., Mwaiseje, S., & Mashene, A. (2021). Ethical procurement practices and performance of public procuring entities in Tanzania: empirical evidences from Moshi district council. Journal of Co-operative and Business Studies (JCBS), 4(2).
[41]  Issa, A.I. (2023). Exploring the causes of delay in road construction projects in Tanzania: An interpretive structural modeling approach. Unpublished Master Dissertation, Ardhi University.
[42]  Jaafar, M., & Radzi, N. M. (2013). Level of satisfaction and issues with procurement systems used in the Malaysian public sector. Australasian Journal of Construction Economics and Building, The, 13(1), 50-65.
[43]  Jarkas, A. M. (2014). Factors impacting design documents quality of construction projects. International Journal of Design Engineering, 5(4), 323-343.
[44]  Jarkas, A. M., & Bitar, C. G. (2012). Factors affecting construction labor productivity in Kuwait. Journal of Construction Engineering and Management, 138(7), 811-820.
[45]  John, A. (2O23). The influence of leadership strategies on performance of construction projects in Dar es Salaam, Tanzania. Unpublished Master Dissertation, Ardhi University
[46]  Julião, M. L. (2018). Guidelines for scope of work in corporate office building design. Universidade de São Paulo.
[47]  Kalan, D., & Ozbek, M. E. (2020). Development of a construction project bidding decision-making tool. Practice Periodical on Structural Design and Construction, 25(1), 04019032.
[48]  Kamar, M. and Anuar, K. (2011) ‘Critical success factors to industrialised building system (IBS) contractor’.
[49]  Kamaruddeen, A. M., Sung, C. F., & Wahi, W. (2020). A study on factors causing cost overrun of construction projects in Sarawak, Malaysia. Labour (human), 2(7), 13. Kihamba, J. S. (2021). Public procurement reforms in Tanzania: dispersion of corruption and governance. Public Procurement, Corruption and the Crisis of Governance in Africa, 185-204.
[50]  Kikwasi, G. (2012). Causes and effects of delays and disruptions in construction projects in Tanzania. Paper presented at the Australasian Journal of Construction Economics and Building-Conference Series.
[51]  Kikwasi, G. J., & Escalante, C. (2018). Role of the construction sector and key bottlenecks to supply response in Tanzania (9292565737).
[52]  Kortenko, S., Koskela, L., Tzortzopoulos, P., & Haghsheno, S. (2020). Negative effects of design-bid-build procurement on construction projects. Paper presented at the Proc. 28th Annual Conference of the International Group for Lean Construction (IGLC28), Berkeley, California, USA, doi. org/10.24928/2020/0141.
[53]  Kothari, C. R. (2004). Research methodology: Methods and techniques: New Age International.
[54]  Kline, R. B. (2000). Beyond significance testing: Reforming data analysis methods in behavioural research. Washington, DC: American Psychological Association.
[55]  Lappalainen, E. et al. (2022) ‘Improving Design Quality by Contractor Involvement: An Empirical Study on Effects’, Buildings, 12(8), p. 1188.
[56]  Li, Y., & Taylor, T. R. (2011, July). The impact of design rework on construction project performance. In Proceedings of the 29th Annual International Conference of the System Dynamics Society.
[57]  Lines, B. C., Kakarapalli, R., & Nguyen, P. H. (2022). Does best value procurement cost more than low-bid? A total project cost perspective. International Journal of Construction Education and Research, 18(1), 85-100.
[58]  Ling, F. (2005). Models for predicting quality of building projects. Engineering, Construction and Architectural Management, 12(1), 6-20.
[59]  Love, P. E., Sing, M. C., Ika, L. A., & Newton, S. (2019). The cost performance of transportation projects: The fallacy of the Planning Fallacy account. Transportation Research Part A: Policy and Practice, 122, 1-20.
[60]  Luvara, V. (2020). Development of social capital model for organization performance of building contractors in Tanzania. Unpublished Ph. D. Thesis Ardhi University.
[61]  Luvara, V. G. M., & Benjamin, M. (2024). Unveiling factors influencing the duration of arbitration practice in the Tanzania construction industry. International Journal of Building Pathology and Adaptation.
[62]  Maagi, B., & Mwakalobo, A. (2023). Users’ perception regarding the effect of E-Procurement practice on customer satisfaction in public procurement in Tanzania. Open Journal of Business and Management, 11(2), 570-584.
[63]  Mahamid, I. (2016). Factors contributing to poor performance in construction projects: studies of Saudi Arabia. Australian Journal of Multi-Disciplinary Engineering, 12(1), 27-38.
[64]  Malekela, K. N. (2018). Risk Measures for Controlling Variations on Forecasted Construction Cash Flows of Building Projects. Risk, 5(05).
[65]  Malekela, K. N., Mohamed, J., Ntiyakunze, S. K., & Mgwatu, M. I. (2017). Risk factors causing variations on forecasted construction cash flows of building projects in Dar es Salaam, Tanzania. Int. J. Constr. Eng. Manag, 2, 46-55.
[66]  Malekela. (2019). Development of a model for optimising the variations on the forecasted constructed construction cashflows: a case of building projects in Dar es salaam-Tanzania. Unpublished Ph. D. Thesis University of Dar es Salaam.
[67]  Malinda, M. J. K. (2017). Quality of project documentation as a major risk source in infrastructure projects in South Africa. Stellenbosch: Stellenbosch University.
[68]  Mathonsi, M. D., & Thwala, W. D. (2012). Factors influencing the selection of procurement systems in the South African construction industry. African Journal of Business Management, 6(10), 3583.
[69]  Matto, M. C., Ame, A. M., & Nsimbila, P. M. (2021). Influence of contract management on value for money procurement in Tanzania. International Journal of Procurement Management, 14(6), 724-741.
[70]  Mchopa, A. D., Changalima, I. A., Sulle, G. R., & Msofe, R. M. (2024). Public procurement trajectories in Tanzania: a review of reforms, practices, and compliance. Cogent Business & Management, 11(1), 2300498.
[71]  Mesa, H.A., Molenaar, K.R. and Alarcón, L.F. (2016) ‘Exploring performance of the integrated project delivery process on complex building projects’, International Journal of Project Management, 34(7), pp. 1089–1101.
[72]  Mohd Fateh, Mohd Ashraf & Yee, Tan. (2021). Revisiting the financial issues and the impact to construction projects in malaysia. Malaysian Journal of Civil Engineering. 33. 1-5. 10.11113/mjce.v33.16269.
[73]  Morledge, R., & Smith, A. (2013). Public sector porjects. Teoksessa: Building.
[74]  Mosley, J. C., & Bubshait, A. A. (2021). Investigative study of project procurement methods and project performance indicators in Saudi Arabia. International journal of construction management, 21(8), 845-857.
[75]  Mwaipungu, U, Malekela,N & Monko, R. (2025). The Identification of Constraining Factors Impacting Design Bid Build Project Delivery in Tanzania Construction Industry. International Journal of Innovative Science and Research Technology, 10(1), 919–933.
[76]  Naor, M., Bernardes, E. S., & Coman, A. (2013). Theory of constraints: is it a theory and a good one?. International Journal of Production Research, 51(2), 542-554.
[77]  Naoum, S., & Egbu, C. (2015). Critical review of procurement method research in construction journals. Procedia Economics and Finance, 21, 6-13.
[78]  Nawi, M., Lee, A. and Nor, K. (2011) ‘Barriers to implementation of the industrialised building system (IBS) in Malaysia’, The Built & Human Environment Review, 4(1), pp. 22–35.
[79]  Nguyen, T. P., & Chileshe, N. (2015). Revisiting the construction project failure factors in Vietnam. Built Environment Project and Asset Management, 5(4), 398-416.
[80]  Noor, S. N. A. M., Tobi, S. U. M., & Fathi, M. S. Revolutionizing Quantity Surveyors: Unleashing Competency In Construction 4.0–A Pilot Study In Malaysia. Malaysian Construction Research Journal (MCRJ), 210.
[81]  Ntiyakunze, S.K. (2011). Conflicts in Building Projects in Tanzania: Analysis of Causes and Management Approaches. Department of Real Estate and Construction Management, Royal Institute of Technology, Stockholm, Sweden.
[82]  Nurosis, M.J. (2009), PASW Statistics 18 Statistical Procedures Companion, Prentice-Hall, Upper Saddle River, NJ.
[83]  Odeyinka, H. A., Lowe, J., & Kaka, A. (2008). An evaluation of risk factors impacting construction cash flow forecast. Journal of Financial Management of Property and Construction, 13(1), 5-17.
[84]  Ofori, G. (2012) Contemporary Issues in Construction in Developing Countries. 2 Park Square, Milton Park, Abingdon, Oxon OX14 4RN: Spon Press.
[85]  Ogunsanmi, O. (2013). Effects of procurement related factors on construction project performance in Nigeria. Ethiopian Journal of Environmental Studies and Management, 6(2), 215-222.
[86]  Okereke, R. A., Ihekweme, N. M., & Adegboyega, A. A. (2022). Impact of Traditional Procurement System on Construction Project Delivery. Journal Of Project Management Practice (JPMP), 2(2), 23-38.
[87]  Oladirin, O. T., Olatunji, S. O., & Hamza, B. T. (2013). Effect of selected procurement systems on building project performance in Nigeria. International journal of sustainable construction engineering and technology, 4(1), 48-62.
[88]  Olanike, O. Y., Baba, M. M., & Ahmad, A. B. (2020). Assessing The Influence of Procurement Systems OnPerformance of Construction Projects in Nigeria. FUW Trends in Science & Technology Journal, 5(3), 796-801.
[89]  Ong, M. H. A., & Puteh, F. (2017). Quantitative data analysis: Choosing between SPSS, PLS, and AMOS in social science research. International Interdisciplinary Journal of Scientific Research, 3(1), 14-25.
[90]  Osborne , J. W., & Waters , E. (2002). Four assumptions of multiple r our assumptions of multiple regression that r ession that researchers should chers should always test. Practical Assessment, Research, and Evaluation, 8(2), 1-5.
[91]  Owiti, J. O. (2022). Effectiveness of Construction Contract Procurement Processes In Public Projects In Kenya: A Survey Of County Government Projects (Doctoral dissertation, JKUAT-SABS).
[92]  Phoya, S. (2014). Multi-Stakeholders’ Participation in Health and Safety Risk Management in Construction Project in Tanzania (Doctoral dissertation, Ardhi University).
[93]  Pishdad-Bozorgi P, Garza J. M D L, Austin RB. 2016. Readiness Assessment for Flash Tracking. J Constr Eng Manag. 142(12): 06016005.
[94]  Puri, D., & Tiwari, S. (2014). Evaluating the criteria for contractors’ selection and bid evaluation. International journal of engineering science invention, 3(7), 44-48.
[95]  Rahmani, F. (2021). Challenges and opportunities in adopting early contractor involvement (ECI): Client’s perception. Architectural engineering and design management, 17(1-2), 67-76.
[96]  Rahmani, F., Maqsood, T., & Khalfan, M. (2017). An overview of construction procurement methods in Australia. Engineering, construction and architectural management, 24(4), 593-609.
[97]  Ramabodu, M. S., & Verster, J. J. (2013). Factors that influence cost overruns in South African public sector mega-projects. International Journal of Project Organisation and Management 7, 5(1-2), 48-56.
[98]  Rashid, K. A., Fauzi, P. N. F. N. M., & Hasan, S. F. (2017). Shariah principles in the procurement of buildings and infrastructure works. Paper presented at the 4th International Conference on Masjid, Zakat and Waqf Management.
[99]  Reta, A., & Alyew, A. (2022). Determining the effects of awarding lowest bid price system on the construction projects of Ethiopian Southern Nation. Journal of University of Shanghai for Science and Technology, 24(1), 253-260.
[100]  Rowlinson, S., Walker, D.H.T. and Cheung, F.Y.K. (2008), “Culture and its impact upon project procurement”, in Walker, D.H.T. and Rowlinson, S. (Eds), Procurement Systems: A Cross Industry Project Management Perspective, Taylor and Francis, New York, NY
[101]  Rwakarehe, E. E., & Mfinanga, D. A. (2014). Effect of inadequate design on cost and time overrun of road construction projects in Tanzania. Journal of Construction Engineering and Project Management, 4(1), 15-28.
[102]  Salaam, T. (2023). National Bureau of Statistics. NBS (National Bureau of Statistics).
[103]  Saunders, M. N., & Townsend, K. (2018). Choosing participants. Sage handbook of qualitative business and management research methods, 480-494.
[104]  Schober, P., Boer, C., & Schwarte, L. A. (2018). Correlation Coefficients: Appropriate Use and Interpretation. Anesthesia & Analgesia, 26(5), 1763-1768.
[105]  Simonetto, A., Dall'Anese, E., Paternain, S., Leus, G., & Giannakis, G. B. (2020). Time-varying convex optimization: Time-structured algorithms and applications. Proceedings of the IEEE, 108(11), 2032-2048.
[106]  Sunday, D.O. and Afolarin, A.O. (2013) ‘Causes, effects and remedies of errors in Nigerian construction documents’, Organization, Technology & Management in Construction: An International Journal, 5(1), pp. 676–686.
[107]  Temu, J, J. (2O21). Assessment of contractors’ bidding strategies influence on tender success rate. Unpublished Master Dissertation, Ardhi University
[108]  Ugwu, O. O., & Haupt, T. C. (2007). Key performance indicators and assessment methods for infrastructure sustainability—a South African construction industry perspective. Building and environment, 42(2), 665-680.
[109]  Valerian, W. (2014). Project procurement method and its relationship with disputes occurrence in tanzania construction industry. A Case of Construction Stakeholders in Dar es Salaam. Mzumbe University.
[110]  Velten, K., Schmidt, D. M., & Kahlen, K. (2024). Mathematical modeling and simulation: introduction for scientists and engineers: John Wiley & Sons.
[111]  Williams, M. N., Grajales, C. A. G., & Kurkiewicz , D. (2013). Assumptions of Multiple Regression: Correcting Two Misconceptions. Practical Assessment, Research & Evaluation, 18(1), 1-14.
[112]  Yasamis, F. Arditi, D. & Mohammadi, J., (2002). Assessing contractor quality performance. Construction Management & Economics, 20(3), 211-223.
[113]  Yu, A. T., & Shen, G. Q. (2013). Problems and solutions of requirements management for construction projects under the traditional procurement systems. Facilities, 31(5/6), 223-237.
[114]  Zainudin, N. A., Adnan, H., Baharuddin, H. E. A., Rosman, M. R., & Ismail, W. N. W. (2022). A comparative study on risk allocation for different procurement type in Malaysian industry. Paper presented at the IOP Conference Series: Earth and Environmental Science.
[115]  Zuber, S. Z. S., Nawi, N. M., & Nifa, F. A. A. (2019). Construction procurement practice: A review study of integrated project delivery (IPD) in the Malaysian construction projects. International Journal of Supply Chain Management, 8(1), 777-783.