-
Paper Information
- Paper Submission
-
Journal Information
- About This Journal
- Editorial Board
- Current Issue
- Archive
- Author Guidelines
- Contact Us
International Journal of Construction Engineering and Management
p-ISSN: 2326-1080 e-ISSN: 2326-1102
2025; 14(1): 15-23
doi:10.5923/j.ijcem.20251401.02
Received: Jan. 20, 2025; Accepted: Feb. 12, 2025; Published: Feb. 18, 2025

Effect of Design-Build Structural Arrangements on Project Cost and Schedule Performance
 Abstract
 Reference
 Full-Text PDF
 Full-text HTML
Simon A. Adamtey
Construction Management, College of Architecture and Environmental Design, Kent State University, Kent, Ohio, USA
Correspondence to: Simon A. Adamtey, Construction Management, College of Architecture and Environmental Design, Kent State University, Kent, Ohio, USA.
| Email: |  |
Copyright © 2025 The Author(s). Published by Scientific & Academic Publishing.
This work is licensed under the Creative Commons Attribution International License (CC BY).
http://creativecommons.org/licenses/by/4.0/

In recent years, the use of design-build (DB) project delivery method has grown significantly across the United States with an equal increase in research in the same area. However, there is inadequate empirical research on the effect of the DB structural arrangement on the performance of DB projects. This study examined 183 DB projects worth over $18 billion completed by 119 DB firms. The data was obtained from the Design Build Institute of America database. ANOVA tests were conducted to determine if cost and schedule means were significantly different among the DB structural arrangements. While the results revealed that no statistically significant difference existed in cost growth means, statistically significant difference in schedule growth means among the structural arrangements was revealed. Integrated DB firms were found to have outperformed all other structural arrangements. Further, the results showed that DB projects generally have a comparatively better schedule performance than cost performance. The findings and practical implications contribute to the current body of knowledge by ascertaining the effect of DB firm structural arrangements on the cost and schedule outcomes of DB projects, which can be beneficial to owners in understanding DB firm structural arrangement variations and the implications on their project cost and schedule.
Keywords: Design-build, Structural arrangement, Designer-led, Contractor-led, Integrated DB, Joint venture
Cite this paper: Simon A. Adamtey, Effect of Design-Build Structural Arrangements on Project Cost and Schedule Performance, International Journal of Construction Engineering and Management , Vol. 14 No. 1, 2025, pp. 15-23. doi: 10.5923/j.ijcem.20251401.02.
Article Outline
1. Introduction
- Conventional project delivery methods are characterized by adversarial relationships due to weak links at the point of interaction [1] and are not able to meet the ever-changing needs of the construction industry or overcome the inefficiencies associated with the industry [2]. For that reason, innovative and alternative contracting methods focused on improving project performance are becoming increasingly popular [3]. Design-build (DB) project delivery method is part of the innovative and alternative contracting methods being used and advanced in the procurement of construction projects. In DB project delivery, the owner contracts with a single entity to provide both the design and construction services [4]. This procurement route enables owners to employ one firm that takes sole responsibility for delivering the required building and associated services in accordance with defined standards and conditions [5]. The designer and contractor work together from the start of the project as a team, providing unified project recommendations to fit the owner's schedule and budget [6]. It is anticipated that DB procured projects will account up to 44% of construction spending in the United States by 2023 [7]. The popularity of DB is not only limited to the US. Studies have shown that DB is increasingly being used in the international construction market ([4]; [8]; [9]). The demand for the DB project delivery method has been attributed to its advantages including shorter project duration, early project cost certainty, and single-point responsibility for clients ([10]; [11]; [12]; [13]). In fact, in comparison with the traditional delivery method (DBB), DB is reported to perform better in terms of cost and schedule outcomes saving up to 6.1% in cost and completing project 12% faster ([6]; [11]).The popularity of DB and the increasing demand by owners have been contributing factors to the proliferation of DB firms consequently increasing their market share. According to Engineer News Record (ENR), the top 100 DB firms alone had a total revenue of $107.15 billion in 2017, which is up 4% from 2016 [14]. However, a closer look at these firms reveals numerous differences in their setup and the structural arrangement between the design professionals and the contractors, which can affect how these projects are delivered. According to Smith et al. [15], DB firms take a variety of forms, and often the design professional part of the organization is a subcontractor or joint venture partner of the contractor. Similarly, the design professional can retain the contractor as a subcontractor. Accordingly, these forms have been grouped into four main configurations known as the structural arrangements [16]. These structural arrangements are contractor-led, designer-led (architect/engineer), integrated-firm-led, and a joint venture [17]. With the increasing popularity and completion of numerous projects procured under DB project delivery method, there has also been a corresponding increase in empirical studies conducted on DB [18]. These include performance comparison with other project delivery methods (e.g., [19]; [13]; [20]), choosing the appropriate procurement method (e.g., [21]) and the appropriate contract method for DB projects (e.g., [18]). However, there are no studies on the structural arrangements of the DB firms and whether owners should consider these differences when selecting a DB firm. The aim of this paper is to better understand the DB structural arrangement variations and their effect on project cost and schedule performance. To achieve this, a search for completed projects procured through DB project delivery method was conducted to collect cost and schedule data. An ANOVA analysis was conducted to compare the difference in means of both cost and schedule metrics across the four DB structural arrangements (contractor-led, designer-led, integrated-led DB, joint venture). This paper contributes to the empirical knowledge concerning the cost and time performance of DB projects. The findings and practical implications of this study can be beneficial to owners in understanding the different DB firm variations and the implications on their project objectives.
2. Structural Arrangement of Design-Build Firms
- Collaboration between the design professional and the contractor to provide a single point of contact for the owner has been recognized as one of the advantages of DB project delivery method ([22]; [23]). The DB project delivery method concept is actualized through various configurations of the DB firms involved. These configurations, which are also referred to as structural arrangements by the Design Build Institute of America (DBIA), form the contractual arrangements between the contractor and the designer (A/E). In the contractor-led structural arrangement, the contractor is the prime who contracts with the owner to design and build the project. The contractor hires or contracts with a designer (A/E) to provide the design services. The primary benefit to this approach is that the project generally stays in budget because the design-builder (contractor) is cost/price driven and holds all the other stakeholders accountable to meet the budget [24].The contractor-led DB is by far the most popular arrangement in the U.S. [25]. A few reasons have been attributed to the popularity and dominance of contractor-led firms. First, contractor-led was the impetus that launched the DB delivery method. As explained by Friedlander [26], the architect as a master builder had overall responsibility for the project, both the design and construction. However, as the legal climate became more adversarial, architects retreated from responsibility for construction paving the way for contractors to lead the DB team [26]. Second, perhaps the reason contractors often lead DB teams is that owners believe contractors are more able than the rest of the project team with the financial resources to assume the risks involved in DB projects as well as the entrepreneurial skills necessary to succeed in such projects [27]. There seems to be an assumption in the industry that the prime of the DB team must be a heavily capitalized entity to secure the contracts and contractors are often believed to have such resources [27]. Friedlander [27] also argued that contractors are more likely to obtain required surety bonds than designers. However, the DBIA notes that not every contractor is suited to lead a DB team. Those contractors coming from the low-bid market may not be prepared to assume the added risks associated with DB contracting [24]. Thirdly, some states in the US such as North Carolina have laws that require anyone who contracts to build (even architects and engineers) to be licensed general contractors [28]. As such, architects are prohibited from simply hiring general contractors to build for them and thus creating more avenues for contractors to lead the DB team [28]. The designer-led DB projects may be structured in two ways. First, an owner hires a design professional to be the design-builder for a project, and then the design professional contracts directly with the trades to construct the project. Secondly, the owner contracts with the design professional, who in turn contracts with a general contractor to provide construction and management services [29]. In either case, the design professional becomes responsible to the owner for the means and methods, including ensuring that the project is built in accordance with the design professional’s design [24]. The use of the designer-led structure is on the increase for several reasons. Some owners think that design quality suffers when the A/E is hired by a contractor who has reduced the design fee and eliminated or reduced the engineer’s construction phase services [27]. Some owners also prefer working directly with the design professional throughout the project because they see the A/E as having a greater understanding of the project’s goals and purposes [27]. Designer-led can satisfy these concerns. However, design professionals may face problems with contractor licensing laws and obtaining the necessary insurance. Most A/Es who work as design-builders have split their firms into two: one that performs professional design services only and another that subcontracts for construction services to circumvent problems relating to licensing and insurance [29]. Regarding the integrated-led DB, it typically has both the designer and the contractor under its control and provides internal control over the design and construction, resulting in a high-value package for the owner [16]. Under this arrangement, the designer and the contractor work together as a single entity with one objective. According to Luoma [30], only a fully integrated-DB firm is capable of an unencumbered collaboration, provide reliable cost guarantees in a timely manner, and offer the client a value-based decision-making process. Another benefit of the integrated-led DB is that it affords the owner direct access to a team made of both a designer and a contractor.For the joint venture (JV), the designer and the contractor can pool their resources together within a common legal organization to deliver the project [31]. On large DB projects, it is not uncommon to have multiple contractors teaming up with two or more design firms to undertake the work and handle the bonding requirements. The firms agree to share project losses and profits and the partnership is dissolved at the end of the project. Also, the owner has direct access to both the design professional and the contractor, which can ease an owner's concerns about losing control of the project [24]. A JV disadvantage is that both the designer and the contractor are liable for each other’s actions committed during the venture. Often, both the contractor and designer may include a percentage allocation of responsibility for losses in the DB agreement.
3. Research Method
3.1. Data Collection
- This paper used data sourced from real DB projects completed in the U.S. and is available on the DBIA database (https://projects.dbia.org/Home/Search). The DBIA was established about 28 years ago to perfect and improve implementation of DB. It is comprised of architectural, engineering, and construction professionals, as well as academics, students, and project owners. Today, DBIA is the true authority on Design-Build Done Right® [32].A simple tabulation method in Microsoft Excel was used for the data collection. The tabulation was divided into the four structural arrangements described in the literature review and projects were put into their respective arrangements. The following information was collected on each project: project name/description, project location, project size, type of project, type of owner, procurement method, contract method, contract start date, contract completion date, actual start date, actual completion date, contract project cost, and actual project cost. Subsequently, the projects were grouped by the structural arrangement of the DB firm.
3.2. Data Description
- At the time of data collection, there were 251 projects in the database. However, projects with missing cost and schedule information were excluded resulting in only 183 projects that were suitable for this research. Of the 183 projects, 33 projects were completed by 24 integrated DB firms, 81 projects completed by 61 contractor-led DB firms, 34 projects completed by 12 designer-led DB firms, and 35 projects completed by 22 joint venture DB firms. In total these projects were worth over $18 billion and were completed between 2008 and 2023. The projects were in the following 33 states: Arizona, Arkansas, Alaska, California, Connecticut, Colorado, Florida, Georgia, Hawaii, Illinois, Kansas, Kentucky, Louisiana, Maryland, Massachusetts, Missouri, Minnesota, New Hampshire, New Jersey, New Mexico, New York, North Carolina, Ohio, Oklahoma, Oregon, Pennsylvania, Rhode Island, South Carolina, Texas, Tennessee, Virginia, Washington, and Washington, DC. Figure 1 shows the types of project in the sample and civil infrastructure were the majority (36%).
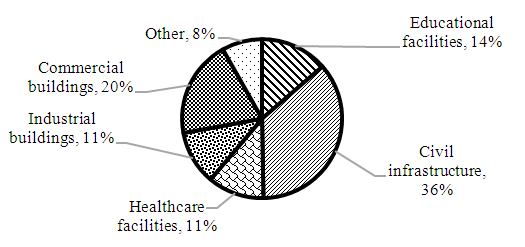 | Figure 1. Types of projects in sample |
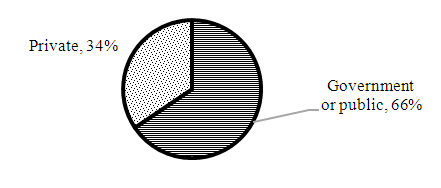 | Figure 2. Type of owners in sample |
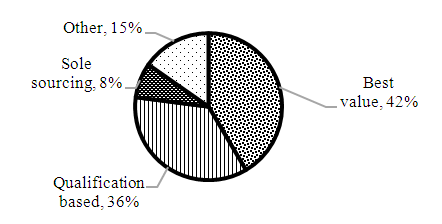 | Figure 3. Procurement methods in sample |
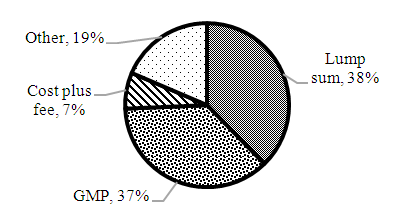 | Figure 4. Contract methods in sample |
3.3. Performance Metrics
- The performance metrics used to compare the different structural arrangements were based on cost and schedule. For the cost, the contracted cost and the final total project cost were used for the calculation while for schedule, the contracted project duration and the final project duration were used. To allow for a fair comparison of the project costs, the RS Means historical cost indexes were used to convert the final total cost of each project to 2023. First, the cost inflation factor was calculated by dividing the 2023 cost index by the cost index of the year and month the project was completed. Then the inflation factor was multiplied by the final total cost of the DB project to get the total cost equivalent to the 2023 cost summarized in Equation (1). The cost and schedule performance metrics were calculated using Equations (2) and (3) respectively.
 | (1) |
 | (2) |
 | (3) |
 is 2023 project cost equivalent;
  is 2013 cost index;
  is Cost index of the month and year of project completion;
  is Final project cost;
  is Contracted project cost;
  is Final project duration;
  is Contracted project duration; CG is Total cost growth; SG is Total schedule growth.
3.4. ANOVA Test
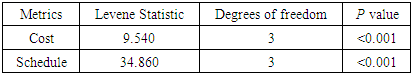
- The one-way analysis of variance (ANOVA) test was conducted to determine whether there was any statistically significant difference in cost and schedule performance among the four structural arrangements. The null hypothesis was that there was no difference in the mean performance metrics of the structural arrangements. For the null hypothesis to be rejected, the p value should be less than or equal to 0.05. In conducting ANOVA, the following assumptions must be met: (1) the dependent variables must be continuous, (2) the dependent variables must be normally distributed, and (3) there must be homogeneity of variance among the groups. The first assumption requires that the dependent variable should be in either a ratio scale or an interval scale. The first assumption was met for this study because all the dependent variables were in the ratio scale. For the second assumption, the central limit theorem states that the distribution of sample means approximates a normal distribution as the sample size becomes larger. The central limit theorem holds true for a sample size greater than 30 ([44]; [45]). Since the sampled projects for the four structural arrangements were more than 30, it could be assumed that their distributions were normal. For the third assumption, ANOVA test assumes that the variances of the four groups are equal. It is important to state that unequal sample sizes can lead to unequal variances in which case tests like the Welch’s or Levene’s Test can be used to test the third assumption [46]. For this study, the Levene’s Test was conducted to test the third assumption as shown in Table 1. The null hypothesis for the Levene’s test was that the variances of dependent variables (structural arrangements) were equal with a 95% confidence level (p ≤ 0.05). The results in Table 1 show that both cost and schedule performance metrics are statistically significant (i.e., p < 0.05) indicating that the variances of the dependent variables were not equal and hence the homogeneity of variances assumption was not met. In this case, the Welch’s Test is the appropriate approach for performing the ANOVA analysis.
|
4. Results
4.1. Project Information
- Figure 5 shows the percentage of projects completed by each of the four DB structural arrangements. The highest number of DB projects were completed by contractor-led DB firms (44%), followed by designer-led and joint venture (both at 19%), then integrated DB. Predominant use contractor-led DB firms could be attributed to the fact that contractors are more capable to have the financial resources and entrepreneurial skills necessary to assume the risks in DB projects [27]. Furthermore, these findings are not consistent with those of DBIA [47] that indicated that the second most predominantly used structural arrangement was integrated DB, followed by designer-led and joint venture.
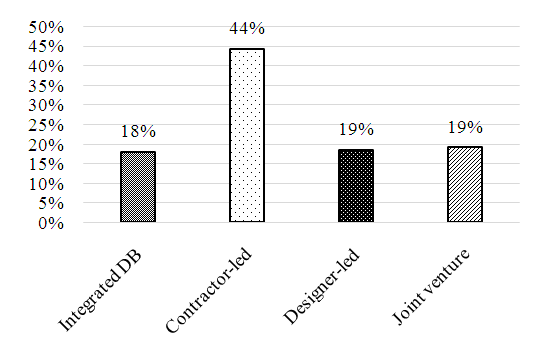 | Figure 5. Percentage of projects completed by each structural arrangement |
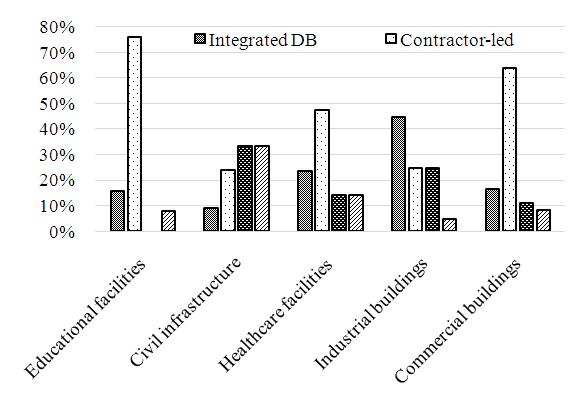 | Figure 6. Percentage of project types by structural arrangements |
4.2. Cost and Schedule Performance Comparison
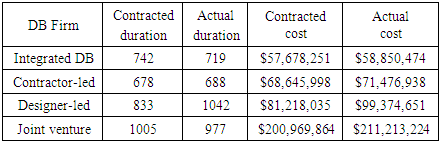
- The 2023 project cost equivalent, 〖"CE"〗_"2023" and schedule data for the structural arrangements are shown in Table 2. These data were analyzed using the performance metrics in Equations (2) and (3).
|
|
|
|
5. Discussion
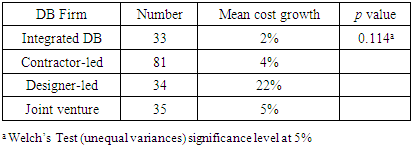
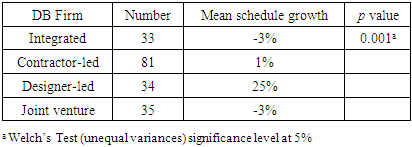
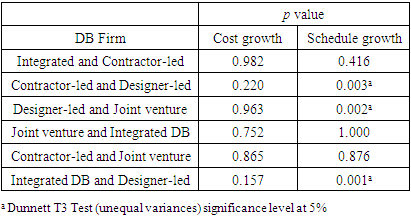
- This study analyzed real DB projects to determine the quantity and the cost and schedule growth of projects delivered by the four structural arrangements of DB firms: integrated DB, contractor-led, designer-led, and joint venture. Forty four percent (44%) of all the projects in the sample data were completed by contractor-led DB firms making this structural arrangement the most predominantly used. This is consistent with previous studies by McGraw Hill [25] on project delivery systems and ZweigWhite [47] that found majority of DB projects were completed by contractor-led firms ([47]; [25]). Additionally, apart from civil infrastructure and industrial facilities, contractor-led dominated all the other sectors including healthcare facilities, educational and commercial buildings. Integrated DB, designer-led and joint venture had similar percentages of projects completed between 18% and 19%. Regarding cost performance, the results of this study revealed that projects completed by integrated DB performed slightly better, followed by contractor-led, joint venture and then designer-led. However, the results did not find any of the differences between the total mean cost growth to be statistically significant. This could be because all the structural arrangements resulted in positive cost growth. On average, designer-led had 22% cost overrun compared to 2% for integrated DB, 4% for contractor-led, and 5% for joint venture. The cost growth could be due to many reasons including change orders and claims ([48]; [49]). Nonetheless, for an owner with a tight budget, it would make a significant difference having a 2% cost growth compared to 22%.Contrary to studies that found DB to result in cost savings [13], the findings of this study indicated that there was positive cost growth in all the DB projects. This is similar to the findings of several studies including Warne [20] who found that although DB outperformed DBB, there was a 4% cost growth in DB projects [20], Moon et al. [50], who found DB resulted in a 2.5% cost growth [50], and Shrestha and Fernane [11], who also found that although DB outperformed DBB in terms of cost, there was a 3.8% cost growth in DB projects [11]. Similarly, Chen et al. [33] found that more than 50% of DB projects analyzed resulted in cost overruns. In fact, the authors further stated that the DB advantage of cost saving remains uncertain.In terms of schedule performance, this study found that there was a statistically significant difference between the means of total schedule growth among the structural arrangements. The results indicated that there was a 3%-time savings for integrated DB and joint venture while there was a 1% and a 25% of schedule growth for contractor-led and designer-led, respectively. Obviously, for an owner, having a 3%-time savings would be a significant advantage for selecting integrated DB or joint venture. In comparison, there was no statistically significant difference between integrated DB and contractor-led, between joint venture and integrated DB, and between contractor-led and joint venture at alpha level 0.05. This indicated that statistically, integrated DB, contractor-led and joint venture outperformed designer-led.The data analysis revealed that DB projects generally have a comparatively better schedule performance than cost performance. This was in accordance with the studies of Chen et al. [18] who found 75% of DB projects were completed on time or before schedule while more than 50% of DB projects were completed over budget. Ibbs et al. [51] also found timesaving as a definite advantage of DB compared to cost performance [51]. According to Songer and Molenaar [52], the shortened duration/early completion of DB projects has been widely recognized in previous research and is known to be one of the most important incentives for project owners to use DB [52].It is clear that integrated DB outperformed the other structural arrangements in terms of total cost and schedule growth. In fact, the integrated DB resulted in time savings for the project owners. This could be due to the fact that integrated DB has both designer and contractor under its control, provides internal control over the design and construction, shares information, and works collaboratively to find consistent and cost-effective solutions resulting in a high-value package for the owner [16]. Similarly, joint venture also resulted in time savings. Since integrated DB and joint venture naturally result in high collaboration between the contractor and designer, it can be suggested that the more collaborative the structural arrangement, the better the performance of the DB projects. In both the integrated DB and the joint venture, the designer and the contractor are both responsible for project losses and agree to share profits as well. Being a single entity with equal rewards for both the designer and the contractor can also be an attributing factor for these structural arrangements to outperform the others.
6. Conclusions and Recommendations
- In the United States, the design-build delivery method has grown significantly across many market sectors. Similarly, in the international market, DB has gained popularity and its increasingly being used to deliver projects. Due to this popularity and the completion of numerous DB projects, there has also been a corresponding increase in empirical studies conducted on DB. However, there is limited empirical studies on the effect of the structural arrangements of DB firms on the performance of DB projects. These structural arrangements form the contractual arrangement between the contractor and the designer (A/E) to provide the required services for the successful completion of the project.This study examined 183 DB projects worth over $18 billion obtained from the DBIA database. These projects were from 33 states and cover different sectors including healthcare, commercial, industrial, and civil. The results showed that the most predominantly used structural arrangement is the contractor-led DB firm, which is consistent with other published studies. Integrated DB, designer-led and joint venture had similar number of projects completed.Regarding total cost and schedule performance, the findings revealed that there was no statistically significant difference in cost growth but there was a statistically significant difference in schedule growth among the structural arrangements. Integrated DB was found to have outperformed all the structural arrangements in total cost and schedule growth. In fact, only integrated DB and joint venture had time savings. Further, the results showed that DB projects generally have a comparatively better schedule performance than cost performance, which could be why the shortened duration/early completion has been widely recognized to be one of the most important incentives for project owners to use DB.The findings of this study are significant because in addition to contributing to the empirical knowledge concerning the cost and time performance of DB projects, the findings and practical implications can be beneficial to project owners in understanding the different DB firm variations and the implications on their project objectives. Owners may also use the findings as a basis and criteria for selecting DB firms to satisfy specific project objectives. Further, the findings confirm the importance of collaboration and integration on DB projects to provide owners with the best value. As indicated by the results, it appears the level of collaboration between the architect and the contractor in the structural arrangements except integrated DB and joint venture, is not yielding the level of performance that will result in cost and time savings for the owner. Obviously, a complete integration should be the goal for DB firms.While the findings of this study may be compelling regarding the performance of the difference structural arrangements, there are a few limitations. Although the sample sizes were large enough to conduct the statistical analysis, a sample size of 33, 34 or 35 may not be a fair representation of a specific structural arrangement in the industry. It should also be noted that other objectives such as project quality and safety were not taken into consideration due to lack of relevant information for assessment. Since a focus on quality and safety may result in increased cost and longer duration, the possibility that this may have affected the results cannot be ruled out. It is also no secret that federal government projects have severe time and cost overrun problems, and this can influence the result if they are more in one structural arrangement than the other. About 66% of all projects in the sample were government projects. The following recommendations are suggested for further research. First, the sample size of contractor-led was more than twice the rest. A future study should consider other data sources that can bring the total samples of the structural arrangements to similar sizes. Second, surveys should be conducted to investigate other project objectives such as quality to provide a holistic analysis and comparison. This will also help validate the findings of this study. Third, separate analysis of private and government projects is recommended to determine if there is any difference in project performance.