-
Paper Information
- Paper Submission
-
Journal Information
- About This Journal
- Editorial Board
- Current Issue
- Archive
- Author Guidelines
- Contact Us
International Journal of Construction Engineering and Management
p-ISSN: 2326-1080 e-ISSN: 2326-1102
2021; 10(1): 1-7
doi:10.5923/j.ijcem.20211001.01
Received: Dec. 15, 2020; Accepted: Jan. 10, 2021; Published: Jan. 25, 2021

Use of Earned Value Management in Time and Cost Management for Construction Projects in Tanzania
 Abstract
 Reference
 Full-Text PDF
 Full-text HTML
Emael S. Massangya, Harriet K. Eliufoo
School of Architecture Construction Economics and Management (SACEM), Department of Building Economics, ARDHI University (ARU), Dar-Es-Salaam, Tanzania
Correspondence to: Emael S. Massangya, School of Architecture Construction Economics and Management (SACEM), Department of Building Economics, ARDHI University (ARU), Dar-Es-Salaam, Tanzania.
| Email: |  |
Copyright © 2021 The Author(s). Published by Scientific & Academic Publishing.
This work is licensed under the Creative Commons Attribution International License (CC BY).
http://creativecommons.org/licenses/by/4.0/

Project overruns are still the most common problem in the world, despite the availability of project monitoring tools like Earned Value Management which is proved to the effective monitoring tool which combines three aspects like scope, time and cost at once. Construction project included high risk activity in which must be managed well in all stages, in order to evade project overruns. The study aimed at assessing the use of Earned Value Management in time and cost management for construction projects in Tanzania. However, there are few of researches that discussed Earned Value Management practices in Tanzanian construction industry. Therefore, it was found that there was inadequacy of documented Earned Value Management implementation in Tanzanian construction projects. The feedback from construction experts was obtained through questionnaires. About 161 questionnaires survey were distributed to the contractor’s organizations (Class I and Class II). Out of the 161 distributed questionnaires, only 102 were returned. The data were analysed by using SPSS 20, Microsoft Excel and then ranked conferring to (M.S) mean score for contractor. The general response from respondents were analysed, high scored factors were discussed. All work scope was planned for the project to completion applied in construction projects, all work scope was broken into finite pieces and assigned to either individual or organisation to control, Issuance of Payment is based on work performed and Actual cost incurred were used in measuring work value accomplished; were identified as the most parts of Earned Value Management applied in Tanzanian construction projects, due to having a mean score above 4.00. The study recognised that key players in Tanzania construction industry applied some parts of Earned Value Management concepts during construction projects.
Keywords: Earned Value Management (EVM), Time and Cost management, Project Overrun, Construction Projects, Tanzania
Cite this paper: Emael S. Massangya, Harriet K. Eliufoo, Use of Earned Value Management in Time and Cost Management for Construction Projects in Tanzania, International Journal of Construction Engineering and Management , Vol. 10 No. 1, 2021, pp. 1-7. doi: 10.5923/j.ijcem.20211001.01.
Article Outline
1. Introduction
- The performance indicator in construction projects is important because it allows to foresee the problems that may occur during the executions of the projects, enabling corrections and adjustments, as well as avoiding deviations from the plan. EVM (Earned Value Management) is a powerful tool in managing scope, time and costs, allowing scheduled performance indices and costs to be achieved [2]. To monitor the construction project is to compare the planned situation with the current situation, by determining if the project is within/beyond the schedule and costs, so as to take corrective measures [8].The Earned Value Management (EVM) gives early indication to the project performance to highlight if there is a need for eventual corrective measures, it enables measuring actual work performance and associated cost and time versus an agreed plan [25]. [1] addressed that Cost overrun and schedule delay must be considered in any construction project because if you did not put into consideration the project will be in trouble at its beginning and unfortunately managers of the project will not realise the problem until late, when the objectives planned of the project being difficult to be recovered or the ability to recover diminishes.According to [25], EVM has proven itself to be one of the most effective performance measurement tools and feedback tools for managing construction projects and enabling project managers to close the loop in the plan-do check-act project management cycle. The purpose of managing construction project is to complete it within the budget and on time while conforming to established requirements and specifications [24]. The performance of the project can be judged by different traditional approaches like monthly or weekly management reports, day to day monitoring, performance reviews, project audit reports, key performance indicators, etc.
1.1. Statement of the Problem
- It has been proven that Earned Value Management is an effective tool in project monitoring in providing performance standard for the evaluation of progress report of the project and it also acts as the control device to take care of cost and time schedule by responsibility defined in OBS (Organisation Breakdown Structure) [26], [11], [5], [14]. EVM is like an alarm to the managers to identify and control problems by taking timely corrective actions before they become too great to overcome. It provides better performance picture of the project and gives better forecast of the final completion cost [4].Despite the availability of EVM, contractors still fail to meet their committed time frames which at times leading to costs as result of delays in delivery; contractors still not able to achieve their targeted profit in a project due to increased operational costs. Henceforth, this study assessed the use of Earned Value Management by Contractors in Time and Cost Management for Construction Projects in Tanzania.
2. Earned Value Management
2.1. Historical Background
- Earned Value Management is the classical tool to control and monitor the project performance. It originated from US Department of Defence (DoD) in which form Cost/Schedule Control System Criteria(C/SCSC) in 1967, mandated that the contractors of defence must use the technique and report the progress in format that specified. The technique was updated from C/SCSC to Earned Value Management System (EVMS) in 1997 by Electric Industry Association through ANSI/EIA-748 standard. The acronyms used with C/SCSC such as ACWP, BCWS, and BCWP were simplified to AC (Actual Cost), PV (Planned Value) and EV (Earned Value) respectively. DoD and US Federal Agencies adopted it replacing C/SCSC as EVMS was much more flexible [10].
2.2. Earned value Management (EVM) Process
- For the successful implementation of the Earned Value Management system, the following are the basic key steps.
2.2.1. Organisation Policy
- The policy is the foundation of the EVM that places forward the position rules to support the system and provide enough information regarding organisation process and planning.
2.2.2. Planning
- The next step is planning after putting the system on organisation policy. This consists of all essential elements required for implementation of Earned Value Management. These are the following:
2.2.2.1. Project Technical Objectives
- Primary step in the practice is designation of the project technical objectives. These objectives include comprehensive explanation of technical requirements of the projects, it is budget, and time outline for the work to be accomplished. Targeted commencing date and a completion date are included in this description [13] and [15].
2.2.2.2. Work Scope Definition and Assign Most of Responsibility
- EVM requires disintegrating the scope of the works. Breaking down activities into minor management tasks, are preferred as a point of control then planned and scheduled down to the detailed work package level [9]. Work Breakdown Structure (WBS) is the best tool used for de-composition of project to the lowest level manageable element [3]. Once the scope is defined, the next step is to identify the responsible persons for performing the work [13] and [15].
2.2.2.3. Setting a Baseline Plan
- [23] described that a baseline is a copy of the project that can be compared to the current progress. Baselines provide a "target" against which you can track a project's cost, schedule, and resource performance. [7] describes baseline as an original approved project scope, timeline and cost. According to [27] baseline used to find present performance of the project activity.
2.2.2.4. To Determine Earned Value (EV)
- During project implementation, as project progresses, the status date may change and two or more measures are obtained so that a comparison can be made between realities and plan its Earned Value (EV) [22]. Earned Value (EV), can be determined by multiplying the actual cost completed at a point in time (AC), this is also known as the budgeted cost of work performed (BCWP) and the percentage of work complete at certain point in time (PC) [17]. EV=% Complete (PC) × BCWP.
2.2.2.5. The Earned Value Analysis Performance Measures
- After the progress is measured against the plan and actual cost is entered, The EVM performance measures indicators (variable) variances and indices are determined.
2.2.2.5.1. Variances
- Variances represent the variation between the present status of the project and its baseline, in monetary terms. Those are Cost Variance (CV) and Schedule Variance (SV) [17]. Schedule Variance (SV) determines whether a project is ahead of or behind schedule. A positive value indicates a favourable condition and a negative value indicates unfavourable condition [17]. Schedule Variance: SV = EV– PV.Cost Variance (CV) shows whether a project is under or over budget. Negative (positive) value points out that more (less) has been spent for the executed activities than what was originally planned. Cost Variance: CV = EV – AC.
2.2.2.5.2. Indices
- Cost Performance Index (CPI) and Schedule Performance Index (SPI). Earned Value and Actual Cost used to compute Cost Performance Index (CPI), in which expresses the cost efficiency of the executed work, if (CPI) is more or less than one that means the project is currently running over or under budget [17]. It helps to determine the remaining cost of the work for the project to meet the specified endpoint which is Estimate at Completion (EAC). Cost Performance Index: CPI = EV / AC. Schedule Performance Index (SPI) shows whether a project is performing on schedule or not. (SPI) of more or less than one means that the project is ahead or behind plan. Schedule Performance Index (SPI) = EV/PV [26].
2.2.3. Forecasting Cost and Time at Completion
- Predicting future with the EVM to predict the expected final cost of the project – Cost Estimate at Completion (EAC) to determine how efficiently we must use our remaining resources and the time to finish project, Time Estimate at Completion (EAC) are essential to the project on predicting final duration for the projects [6]. EVM acts as the early warning system which helps PMs to resolve problems and exploit opportunities during the project implementation. Also, these actions are also used to forecast future performance for the project [12].
2.2.4. Critical Ratio (CR)
- This is a measure that considers both indices; the Cost Performance Index (CPI) and the Schedule Performance Index (SPI). The Critical Ratio is representing the overall position of the project [6].
2.2.5. Re-Baselining
- It might turn out that the original baseline becomes unrealistic as the basis for management control. It can be due to the changes in cost, scope, schedule or a combination of all these factors. Corrective measures needed to bring back the project on plan [18].
3. Methodology
- Methodology and research design used in this study was surveying research design, which apart from literature review, questionnaires were used by approaching contractors registered under Class I to Class II. The unit of analysis based on Tanzania contracting firms Class I and Class II. Also, the study used both qualitative and quantitative method approach, which made easier in determining the planned objectives, samples and design of the study.
3.1. Study Population and Sample
- Population is the entire mass of observations, which is the parent group from which a sample is to be formed [21]. Additionally, [19] confirms that; this is a group of individuals, objects or items from which the sample is taken for measurement, and it refers to an entire group of persons or elements which have one thing in common. In this study, the sample population includes building Contractors from class I and II, registered by CRB. The study employed both probability and non-probability sampling. Depending on the nature of respondents, different sampling technique were used:i. Building contractor’s population, stratified probability sampling was used in this study, with the rationale behind technique is being the heterogeneity of the contractors’ population in Tanzania, in which categorised into strata such as class I to class VII. [21] asserts that; this technique is precise and includes all important subpopulations; is free from bias and it ensures a sample that accurately reflects the population being studied.ii. Then, Purposive non-probability sampling was used to select the respondents within the contracting firm. These included Quantity Surveyors, Engineers and Project managers from the firms. These key informants were purposively sampled because they are believed to have technical and specialised knowledge about the topic under investigation by virtue of the offices that they held.Besides, the sample size proposed to determine what is termed by [19] as precision rate of and the confidence rate. Size of the sample should be optimum neither large nor small.To determine the sample size for small populations, we use the normal approximation to the hyper-geometric distribution formula. It has ability to estimate sample sizes from small populations accurately (Yamane, 1967). The sample size formula is; -
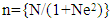 | (1) |
|
3.2. Data Collection Methods
- Normally, both primary and secondary data collection were done by using multiple sources of the evidence. Questionnaire survey was used to collect primary data from contractors in which the respondents answered questions on their own, [28]. Also, secondary data were collected from literature review via published and unpublished books, journals, articles and papers.
3.3. Questionnaire Design
- The Questionnaires were designed to reflect the current capacity to answer the objective of the research [20]. “Self-administered semi structured questionnaire was used as the research instrument. A questionnaire consists of a number of questions printed or typed in a definite order on a form or set of forms” [19]. The self-administered questionnaires cover the advantage of being flexible because they hold both open and closed-ended questions for gathering comprehensive information to ensure relevancy and consistency of information gathered as the responses are objective, standardised and comparable.The questionnaire of this study involved three-parts part A and B. part A carry Personal information questions and part B, each question developed to address a specific objective (i, ii, iii) of the study respectively.
4. Results, Analysis and Discussion
- The main objective of this research is to assess the application of Earned Value Management (EVM) by contractors in Tanzanian construction projects. Data were collected, analysed and presented using SPSS (20), Excel (Tables) and Microsoft Word in order to get more accurate computation that mapped out pattern or relationship between measured or comparable variables. The study adopted the use of quantitative analysis method by using syntax mathematical operation in determining the mean score,
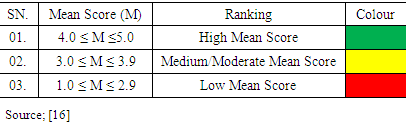
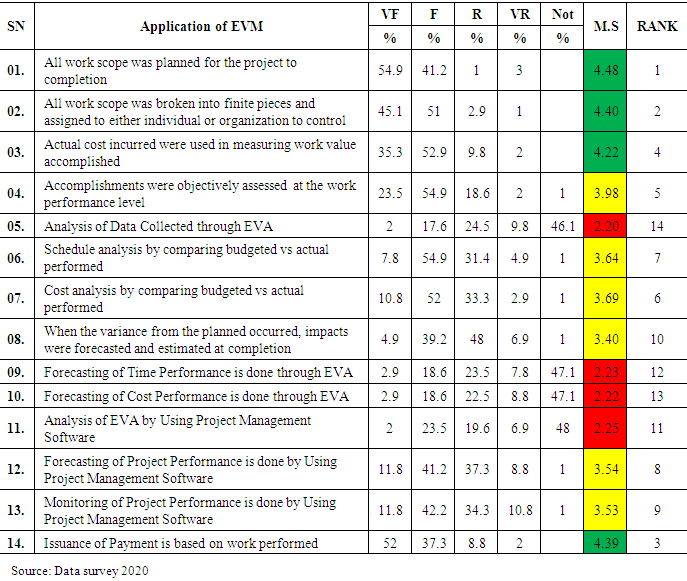
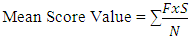 Where: F = Frequency of response for each scoreS = Score given each causeN = The total number of respondents for each factorMean score value (M.S) comparisonThe value from mean score was categorised into three groups which the first one had the value from 4 to 5 ranked as the high mean score with green color, from 3 to 3.9 ranked as medium/moderate mean score with yellow color and 1 to 2.9 ranked as low mean score with red color as presented in table 4.1 below.
|
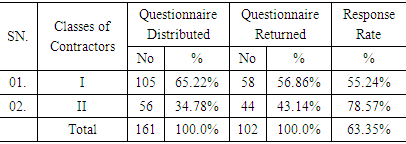
4.1. Response Rate
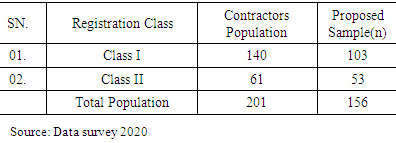
- This study aimed to assess the use of Earned Value Management (EVM) in time and cost management for construction projects in Tanzanian. The number of sample size from every registered building and civil contracting in Tanzania was 103 and 53 for Class I and II respectively. The questionnaires were distributed to the chosen companies, in which the researcher collected an overall of 63.35% of the distributed questionnaires as presented in Table 4.2.
|
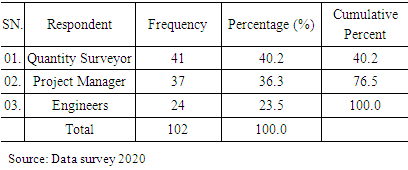
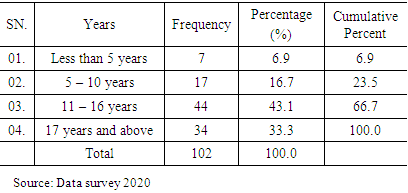
4.2. Population Characteristics
- This part is mainly designed to provide general information about the respondents in terms of category of the organisation, professions of the respondent, designation and experience.Professions of the respondent There are various designations in construction industry which include Quantity Surveyors 40.2%, Project Managers 36.3% and Engineers 23.5%.
|
|
4.3. The Use of EVM in Time and Cost Management for Construction Projects in Tanzania
- The following activities were considered constituting of EVM, all work scope was planned for the project to completion, all work scope was broken into finite pieces and assigned to either individual or organisation to control, actual cost incurred were used in measuring work value accomplished, accomplishments were objectively assessed at the work performance level, analysis of data collected through EVA, schedule analysis by comparing budgeted vs actual performed, cost analysis by comparing budgeted vs actual performed, when the variance from the planned occurred the impacts were forecasted and estimated at completion, forecasting of time performance was done through EVA, forecasting of cost performance was done through EVA, analysis of EVA by using project management software, forecasting of project performance was done by using project management software, monitoring of project performance was done by using project management software and issuance of payment was based on work performed. The following are the responses from the respondents: Table 4.5 depicts that it has been identified that the key players in Tanzanian construction industry applied some parts of EVM concepts during construction projects. This finding is similar to the finding found by [29], they found that only some part of the concept of EV is being used in construction projects but not the EVM as a whole. The application of EVM in Tanzanian construction industry was found to be partial.Table 4.5 indicates that; all work scope was planned for the project to completion applied in construction projects. Others were all work scope was broken into finite pieces and assigned to either individual or organisation to control, Issuance of Payment was based on work performed and Actual cost incurred were used in measuring work value accomplished which mean score greater than 4.0.Discussion of findings1. The work scope was planned for the project to completionTable 4.5 This was ranked first with mean score 4.48, whereby, in general 54.9% of the respondents very frequently applied it, while 41.2% of the respondents frequently, 1% they rarely applied and 3% of the respondents very rarely applied.2. The work scope was broken into finite pieces and assigned to either individual or organisation to controlThis was ranked second with mean score 4.40, as seen in Table 4.5 whereby, in general 45.1% of the respondents very frequently applied it, while 51% of the respondents frequently, 2.9% they rarely applied and 1% of the respondents very rarely applied.
|
5. Conclusions
- The study identified that the contractors in Tanzania applied some parts of EVM concepts during construction projects but the application was not found to be intensive. Found that only some parts of the concept of EVM were being used in construction projects but not the EVM as a whole. The application of EVM in Tanzanian construction projects was found to be partial.For instance, the study established that all work scope was planned for the project to completion which was ranked first, followed by the work scope being broken into finite pieces and assigned to respective individual or department to control. Furthermore, issuance of payment was based on work performed and accomplishments were objectively assessed at the work performance level.But on the other hand, aspects such as analysis of data collected through EVA and the forecasting of cost and time performance was done through EVA were minimally used.The study found during the use of EVM only some parts of EVM were applied and not the EVM as a whole. It recommended that the effort of using the remained components should be made. Those components are data collected must be analysed through EVA, forecasting of cost and time performance must be conducted through EVA and Using Project Management Software to conduct analysis of EVM.