-
Paper Information
- Next Paper
- Paper Submission
-
Journal Information
- About This Journal
- Editorial Board
- Current Issue
- Archive
- Author Guidelines
- Contact Us
International Journal of Construction Engineering and Management
p-ISSN: 2326-1080 e-ISSN: 2326-1102
2020; 9(2): 33-44
doi:10.5923/j.ijcem.20200902.01

Impact of Design Flaws on Cost Overruns in Road Construction Projects in Uganda
 Abstract
 Reference
 Full-Text PDF
 Full-text HTML
Lawrence Muhwezi, Asuman Kirenzi, Mugume Rodgers Bangi
Department of Civil and Building Engineering, Kyambogo University, Kyambogo, Uganda
Correspondence to: Lawrence Muhwezi, Department of Civil and Building Engineering, Kyambogo University, Kyambogo, Uganda.
| Email: |  |
Copyright © 2020 The Author(s). Published by Scientific & Academic Publishing.
This work is licensed under the Creative Commons Attribution International License (CC BY).
http://creativecommons.org/licenses/by/4.0/

Cost overruns have remained a major setback in implementation of road construction projects worldwide. In the Ugandan construction industry, some projects have had cost overruns to a tune of 100% and are partly attributed to design flaws. This study identified major design flaws encountered during the construction phase of paved road projects in Uganda and developed a model for predicting their impact on cost overruns. A total of 37 design flaws encountered during construction were identified from literature and a questionnaire survey was conducted to establish the major design flaws based on importance index, by rating the frequency of occurrence of design flaws and their impact on cost. The effect of the five top ranked design flaws on cost overruns was established from sixteen case study projects. A regression model for predicting impact of the design flaws was developed and validated using fresh data from five projects. Results indicated the five top ranked design flaws to be: provision of less number of drainage culverts, inadequate quarries and earthen materials investigations, inadequate geotechnical investigations for road subgrade, under estimation of quantities of rock fill and provision of less volumes of cut and fill. The effect of the major design flaws on cost overrun was established to be 33.3% on average with rock fill having the biggest effect (average of 11.0%) and drainage culverts having the least effect (average of 6.7%). It was concluded that most of the design flaws which greatly affect cost overruns are attributed to non-comprehensive geotechnical and hydrological studies. It was recommended that ample time and budget be allowed for geotechnical and hydrological studies during the design stage.
Keywords: Design Flaws, Cost overruns, Impact, Road projects
Cite this paper: Lawrence Muhwezi, Asuman Kirenzi, Mugume Rodgers Bangi, Impact of Design Flaws on Cost Overruns in Road Construction Projects in Uganda, International Journal of Construction Engineering and Management , Vol. 9 No. 2, 2020, pp. 33-44. doi: 10.5923/j.ijcem.20200902.01.
Article Outline
1. Introduction
- Infrastructure development is considered the backbone of economic growth and development world over [1]. Poor state of infrastructure is one of the impediments to African economies leapfrogging from their current economic status into modern industrial economies [2]. In Uganda, infrastructure development has been prioritised mainly to reduce the cost of doing business, increase the country’s global competitiveness and spar industrialization [3]. This is reflected by the increase in the funding of road development and maintenance over the last few years. Uganda National Roads Authority (UNRA), the national agency responsible for national roads, alone received UGX 2.3 and 3.8 trillion for road development and maintenance in the financial years 2015/2016 and 2017/2018 respectively (MoFPED Budget Speeches: Financial Years 2015/16 and 2017/18). Despite the increase in the funding for roads in Uganda, few roads are completed within budget and on time [4]. This has been attributed to variations that are very common in construction projects consequently causing cost overruns [5]. Cost overrun is the difference between forecasted and actual construction costs [6]. Though much attention has been devoted to establishing the major causes of cost overruns in road construction projects, little focus has been geared towards identifying the impact that each factor has on cost overruns. [5] investigated the causes of inadequate designs as well as the extent to which inadequate designs contribute to cost overruns in road construction projects in Tanzania and revealed that the total cost overrun rate was at 44% on average and 61% of these cost overruns were due to design inadequacies. The main objective of this study was to establish the impact of design flaws on cost overruns in road construction projects in Uganda by identifying the most significant design flaws encountered during the construction phase and their impact on cost with the intent of developing a model for predicting their impact on cost overruns.
2. Review of Literature
2.1. Design Flaws
- A design flaw is a fault, omission, error, defect, mistake, imperfection or weakness found or introduced in any design and affects the appropriate functionality or constructability of the final design. In many construction projects, variation and scope changes result from design related factors and ultimately into cost changes [7]. Studies such as [8] and [9] that have examined design errors in construction have often interchangeably used the terms change, omissions, defects, quality deviations, non-conformances and failures.A number of latent conditions reside within project systems that influence error-provoking activities to take place and, therefore, contribute to design errors occurring during construction [10]. For example, the use of competitive tendering can result in organizations committing to undertake work at a lowest price. This can result in opportunistic behaviour whereby design firms omit to undertake design audits, reviews and verifications to maximize their fee. Moreover, when firms are placed under schedule pressure by clients to design and document, then a propensity exists for them to omit tasks to make work more efficient. This often results in errors in contract documentation, which has been identified as a major cause of disputes and cost variations during construction of projects [11]. Once design errors are identified, rework or design modification is inevitably required. The extent of the rework or modification that arises, however, is dependent upon when it is identified in a project’s life cycle. [12], in a study of nine construction projects established that design inadequacies account for 19.7% of the total number of cost variations that arose in the projects. He further argued that design changes accounted for 79.1% of the total cost of quality deviations that arose in projects. Similarly, [13] found that the engineering and review processes for an engineering project contributed 68% of rework costs with 78% of this total attributable to design errors and inadequacies. In a similar study, it was established that design flaws accounted for 50% of quality failure costs in civil engineering projects [14].The cost of design flaws has been reported to be lower in building projects revealing that they accounted for 14% of rework costs [15]. Research has revealed that design errors contained within contract documentation alone contributes at least 5% increase in a project’s contract value [16].
2.2. Cost Overruns
- A cost overrun is mainly described as a budget increase, cost increase or cost growth. Cost overrun is the difference between forecasted and actual construction costs [6]. Cost overrun is also defined as the ratio of the actual final costs of the project to the estimate made at the full funds’ authorization measured in escalation-adjusted terms [17]. In this instance, a cost overrun is treated as the margin between the initial project cost authorized and the real final costs incurred after adjusting for amounts spent due to escalation terms.Previous research has attempted to discover reasons for the disparity between tender sum and the final account [18]. An investigation into the major causes of cost escalation in Zambia’s road construction industry revealed that inclement weather due to heavy rains, scope changes, schedule delay, strikes, technical challenges, inflation and local government pressures were major causes of cost escalations [19]. In their studies for cost overruns, [20], [21] and [22] established that design changes, inadequate planning, unpredictable weather conditions and fluctuation in the cost of construction materials were the major sources of cost overruns in projects These studies did not address the magnitude of the cost overruns that were experienced and how projects can be better planned to handle the eventual occurrence of cost overruns.[23] studied cost overruns in large construction projects and established that cost overruns are a regular future of public sector projects. Detailed findings showed that cost overrun was 82% on average. With respect to the causes, 20-25% were attributed to price variations and the remaining 75-80% were explained in terms of real factors such as delays in implementation. Poor project design and implementation, inadequate funding of projects, bureaucratic indecision, and lack of coordination between enterprises were the major causes of cost overruns. This study, however, focussed on identifying the magnitude of total project cost growth and causes but did not address the extent to which each causative factor contributed to the cost growth for the project and how each could be mitigated through prediction since they are expected to occur.[24] investigated the causes of cost overruns in the Federal road projects of Ethiopia. In the analysis of 40 factors responsible for cost overruns, questionnaires were distributed to 54 practitioners who ranked the significance of these factors. Findings showed that materials price fluctuations, inadequate review of contract documents, lack of coordination at the design phase, cost under estimation, delay in supply of raw materials and lack of cost planning during pre and post contract stage were the six top ranked factors. The research also revealed that cost overruns among selected projects extended from 4.16% to 83.2% with an average of 21.52%. [25] studied the causes and effects of delays and disruptions in construction projects in Tanzania and revealed the main factors to be design changes, delays in payment to contractors, information delays, funding problems, poor project management, compensation issues and disagreement on the valuation of work done. On the other hand, time overrun, cost overrun, negative social impact, idling resources and disputes are the main effects of delays and disruptions. The study concluded that there still existed a number of causes of delays and disruptions and their effects put construction projects at great risk that has an effect on their performance. It was therefore recommended that adequate construction budget, timely issuing of information, finalization of design and project management skills should be the main focus of the parties in project procurement process.
2.3. Model Development
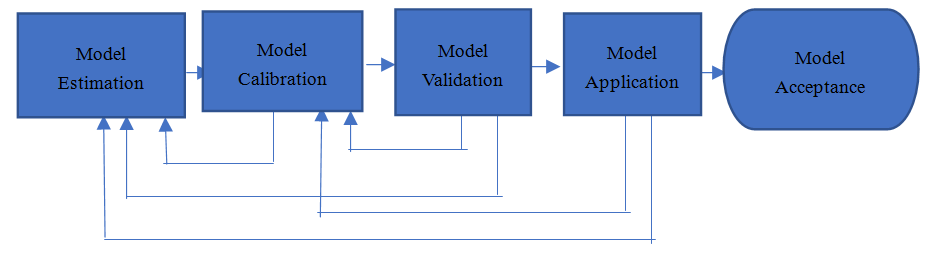
- A model is a representation of an object or a system. Models are used in science to help explain how something works or to describe how something is structured. Models can also be used to make predictions or to explain observations [26]. Models can be physical, mathematical or a conceptual model. Physical models provide an illustration of what the reality is. Mathematical models may be made up of numbers, equations, or other forms of data. Mathematical models are tools that assist in theory development and testing. Models are theories, or parts of theories, formalized mathematically. They complement theorizing but their ultimate goal is to promote understanding of the theory, and thus behavior, by taking advantage of the precision offered by mathematics. Conceptual models represent systems of ideas, compare unfamiliar things with familiar things to explain unfamiliar ideas. The model development process involves the steps of model estimation, model calibration, model validation and model application as shown in Figure 1.
 | Figure 1. The Model Development Process (Source: http: tfresource.org) |
2.4. Model Estimation, Calibration and Validation
- Model estimation is the use of statistical analysis techniques and observed data to determine model parameters or coefficients. Calibration is the activity of verifying that a model of a given problem in a specified domain correctly describes the phenomena that take place in that domain. During model calibration, values of various relevant coefficients are adjusted in order to minimize the differences between model predictions and actual observed measurements in the field. Verification is performed to ensure that the model does what it is intended to do.Validation is the task of demonstrating that the model is a reasonable representation of the actual system so that it reproduces system behavior with enough fidelity to satisfy analysis objectives. For most models, there are separate aspects to consider during model validation namely: assumptions, input parameter values and distributions, output values and conclusions.Model calibration involved adjustment of constants and other model parameters in estimated model to make the model replicate observed data or otherwise produce more reasonable results. Model validation involved use of fresh data to test the predictive ability of the model under investigation.The use of data to fit and test the model is preferable when demonstrating the generalizability of the model in order to use it to predict outcomes for future subjects [27;28 and 29]. This type of assessment is called model validation. Calibration on the other hand is a measure of how close the predicted values are to the observed values for any given configuration of the independent variables of the model [27;30]. For a given configuration of the independent variables, perfect calibration results in a prediction of the positive outcome that numerically agrees with the observed frequency of the event when that configuration occurs. Model validation can be done externally or internally although the most reliable, stringent and unbiased test for model and for the entire data collection process is external validation [31;32].
3. Research Methodology
- The research design was quantitative and the research approach involved two phases. Phase 1 involved a desk study to identify potential design flaws on projects. This was followed by a questionnaire survey to determine the severity and frequency of the design flaws. The design flaws were then ranked after computing their importance indices.Phase 2 involved reviewing documents for completed paved road construction projects, as case study projects, to establish the existence of the five highly ranked design flaws and their contribution to the cost overrun on each project. It also involved regression analysis to develop a predictive model and model validation using freshly collected data not part of that used for model estimation to assess its predictive ability.
3.1. Data Collection
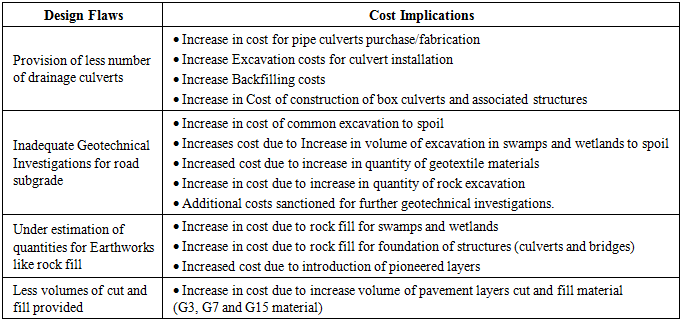
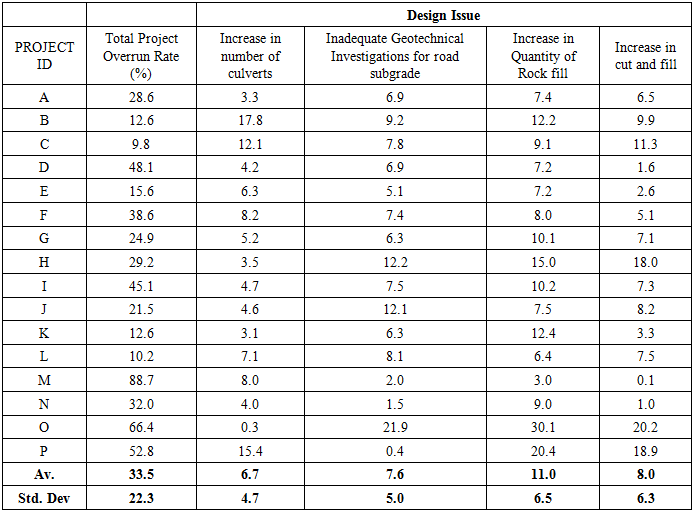
- Phase 1The design flaws identified in the literature review were used to develop a questionnaire. This questionnaire was administered to different road construction practitioners to determine the severity and frequency of design flaws on the projects they have implemented.The questionnaire was pretested before full scale survey. Five respondents with at least ten (10) years of experience were selected to study and answer the questionnaire and help in improving its wording, content and precision so as to increase the instrument’s content validity. Content validity is the degree to which an instrument has an appropriate sample of items for the construct being measured [33]. The respondents were also asked to evaluate each question in the questionnaire and assign a score of either 1 or 0 for items they considered relevant and irrelevant respectively based on which content validity for the questionnaire was determined.The updated questionnaire was then administered to selected practitioners in the road construction sector so as to rate on a five-point Likert scale (1-5) both the frequency of occurrence and severity in terms of impact each of the identified design flaws has on cost. On frequency, 5 represented that the practitioner always experienced design flaws whereas 1 represented that the practitioner has never experienced a design flaw. On impact, 5 represented that the design flaw very significantly contributed to cost variation whereas 1 represented that the design flaw has no effect on cost variation. The questionnaires were administered selectively to engineers, construction managers, land surveyors and quantity surveyors who have implemented at least two road projects while working with either road contractors, consulting firms or Uganda National Roads Authority (Client). The experience of at least two road projects was preferred in order to enable the practitioner give a comparison of the projects. Due to the need to get expert information concerning design flaws and cost overruns in road construction projects, the method that was adopted for sampling was purposive sampling.Phase 2Documentation of completed paved road projects was reviewed to get more detailed information about the existence of the highly ranked design flaws and their contribution to the cost overrun on each project. The projects whose documents were reviewed were those implemented and completed by UNRA in the period between 2008 and 2017 of minimum contract sum UGX 25 billion. A desk study of UNRA together with a discussion with the UNRA network development officials revealed that only 40 paved road projects had been completed by UNRA in the same period. However, documents on only sixteen (16) road reconstruction and upgrading projects could be traced.The documents reviewed included project report cards, original and revised bills of quantities, variation orders, final payment certificates, final account statements and project completion reports from supervising consultants.The original bill of quantities was reviewed to identify bill items associated with each of the highly ranked design flaws as shown in Table 1. Project report cards, final payment certificates, consultants’ final account statements and project completion reports for all the projects were also reviewed to establish the original project cost, final project cost and any approved variations and claims associated with each of the design flaws. From the original project cost and the final project cost established, the total project cost overrun was calculated as the difference between the original cost and the final cost.
|
3.2. Data Analysis
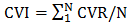
- Phase 1Content ValidityThe content validity ratio (CVR) for each question was calculated using Equation 1.
 | (1) |
 | (2) |
 | (3) |
 = Constant expressing the weight assigned to each of the responses (range from 1 for never-5 for always);
  = frequency of each response and; N=Total number of responses.Severity IndexThis represented the effect that the identified design flaw had on the project cost. It was calculated using Equation (4) as adopted from [37].
 | (4) |
 = Constant expressing the weight assigned to each of the responses (range from 1 for no impact- 5 for very significantly);
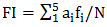
  = frequency of each response on impact and; N= total number of responses.Importance IndexThis was adopted for selecting the most significant (major) design flaws after rating. The Importance Index for each design flaw was calculated using Equation (5).
 | (5) |
4. Results and Discussion
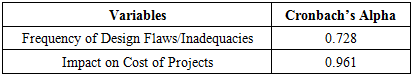
4.1. Reliability of Questionnaires
- The results for the analysis of the reliability of the questionnaire based on the Cronbach’s Alpha value for all the variables (37 items) are shown in Table 2.
|
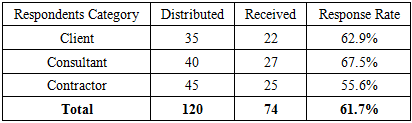
4.2. Response Rate
- A total of 120 questionnaires were distributed amongst consultant, contractor and client staff (UNRA), out of which 74 were returned. As shown in Table 3, the response rate of the questionnaire survey was 61.7%. This indicates a non-response bias of 38.3% which is probably because the respondents never spared time to attend to the questionnaires. According to [39], a response rate greater that 50% is considered acceptable and therefore the obtained response rate of 61.7% shows that the information obtained is acceptable and representative enough.
|
4.3 Respondents Profile
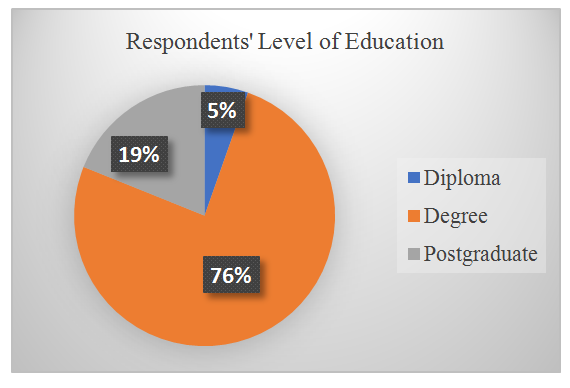
4.3.1. Respondents Level of Education
- The largest portion of respondents (75%) had a degree while 18.9% possessed postgraduate qualifications as shown in Figure 2. This shows that the respondents have had at least the basic training required to comprehend engineering design and project management aspects, and therefore were knowledgeable enough in the subject area of the research.
 | Figure 2. Respondents' Level of Educations |
4.3.2. Respondents Years of Experience in Road works
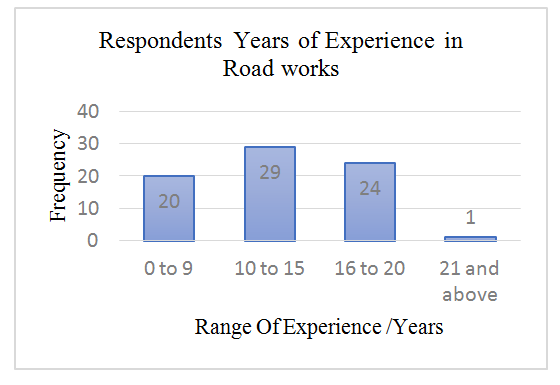
- As shown in Figure 3, 39.2% of the respondents had experience between 10 – 15 years while 32.4% had experience of between 15-20 years. This implies that the respondents had experience in either the design, construction or supervision of at least one road project and therefore could probably provide insight and comparison into their experience with design flaws and costs on the different projects which they implemented.
 | Figure 3. Respondents Years of Experience in Road Works |
4.3.3. Respondents Position on Projects
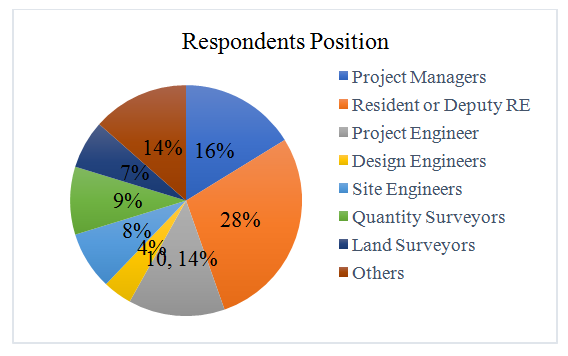
- Twenty eight percent of the respondents had been either resident engineers or deputy resident engineers, 16% project managers, 14% project engineers while 14% held other positions which included among others materials engineers, work inspectors and structural engineers as shown in Figure 4.
 | Figure 4. Respondents Position |
4.3.4. Experience with Design Flaws
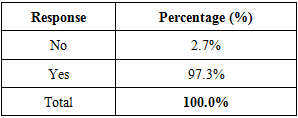
- Responses on whether any design issues that affected project cost were encountered during construction are shown in Table 4. Results indicate that for 97.3% of the respondents, their projects had design flaws which affected the project cost while only 2.7% were on projects without design flaws.
|
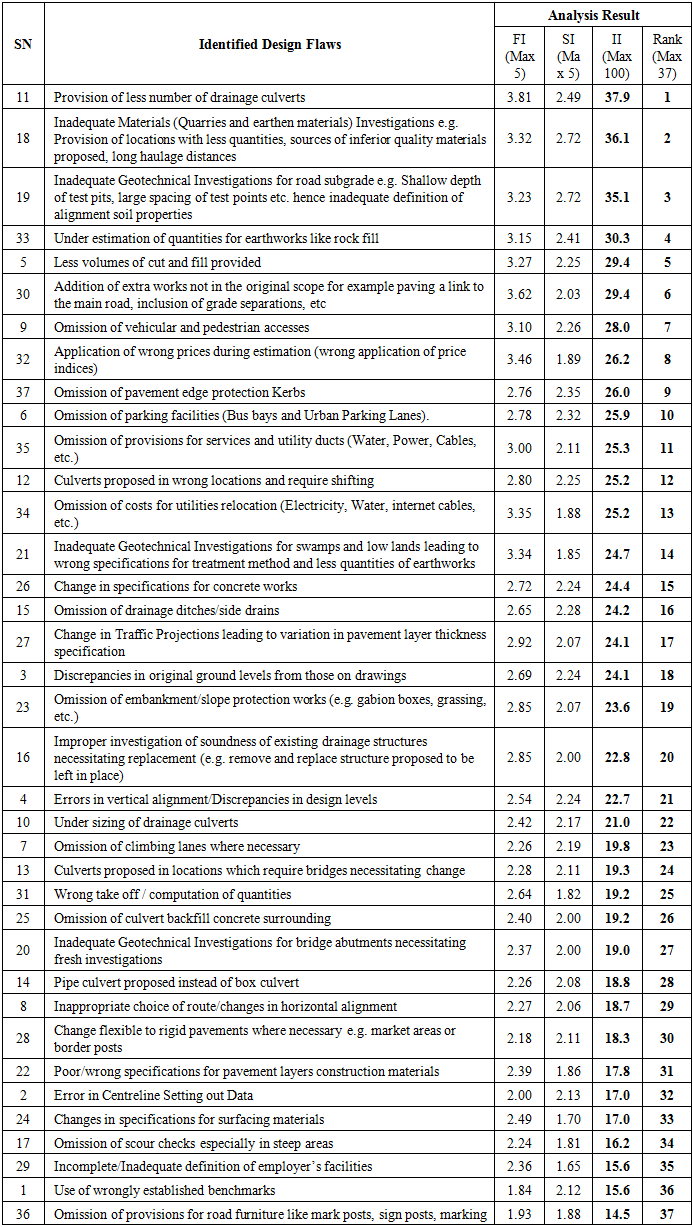
4.4. Ranking of Design Flaws
- Results of the ranking of the design flaws which were identified is shown in Table 5. Results indicate that provision of less number of drainage culverts was the highest ranked design flaw experienced during construction of road projects with an importance index of 37.92%. This could be probably due to non-comprehensive hydrological design culminated by lack of meticulous assessment of the drainage locations during detailed engineering design and design review stages. This design flaw could be solved probably by requiring consultants to assign specialist hydrologists on all road projects. This will enable provision on well informed and factual designs for the roads intended for construction.
|
4.5. Impact of Each Design Flaw
- The biggest impact on cost overruns was from increase in quantity of rock fill with average of 11.0%, followed by increase in volume of cut and fill (8%), and inadequate geotechnical investigations for the road subgrade (7.6%). The design flaw with the least effect was increase in costs due to increase in number of drainage culvers with an average contribution of 6.7%. These results imply that increasing the quantity of rock fill should as much as possible be minimised as it greatly increases the project cost as indicated in Table 6.
|
4.6. Predictive Model
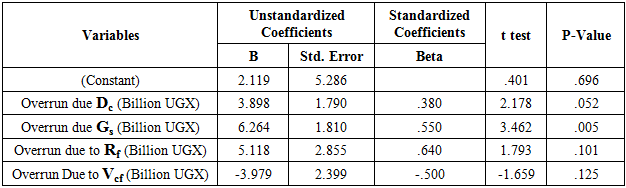
- The linear regression model developed for predicting cost overruns based the collected data set was:
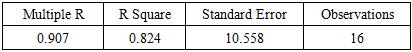
 Where: Pco represents the total project cost overrun, Dc represents the Overrun due to increase in number of culverts and associated costs, Gs represents the Overrun due to inadequate investigation of Road Subgrade, Rf represents the overrun due to increase in quantities of rock fill, Vcf represents the overrun due to increase in volume of cut and fill and the constant represents the change in cost overrun caused by other factors and other design flaws which are not part of the model.In the model, Dc, Gs and Rf had positive coefficients implying that a unit increase in any of them increases the project cost overrun by 0.380, 0.550 and 0.640 units respectively. Increase in quantities of rock fill has the greatest impact on project cost overrun and this implies that in the model, rockfill should be controlled during design by thoroughly investigating sections where rockfill can be required and properly estimating its quantities to avoid its increase during construction to minimize the magnitude of the expected overrun.The coefficient for cut and fill is negative (-0.5) implying that a unit increase in the volumes of cut and fill decreases the project cost overrun by 0.5 units. Statistically, the negative coefficient exists because there exists a negative correlation between Vcf and Rf within the same model and therefore increase in one negatively affects the other. This therefore implies that in any design, good material suitable for cut and fill should be encouraged so as to reduce on the quantity of borrowed materials from outside the road alignment. In fact, from the model, to reduce the magnitude of cost overruns, cut and fill of suitable materials should be optimised to reduce on the volume required rock fill which greatly increases the cost overrun. The constant (2.119) represents the change in cost overrun caused by other factors and other design flaws which are not part of the model. The constant shows that with the four design flaws absent on the project, there will still be a project cost overrun increase by 2.119 units. Therefore, project cost overruns are not solely dependent on the four design flaws in the model but there are other design flaws and project management issues which affect project cost which ought to be addressed together with the major design flaws shown in the model.The R-square value of 0.824 (See figure 5) indicates that 82.4% of the total variation of cost overrun in the projects studied can be predicted by volume of cut and fill, Inadequate investigation of road subgrade, increase in number of culverts and associated costs, and increase in quantities of rock fill when considered together in the model while 17.6% is unexplained.
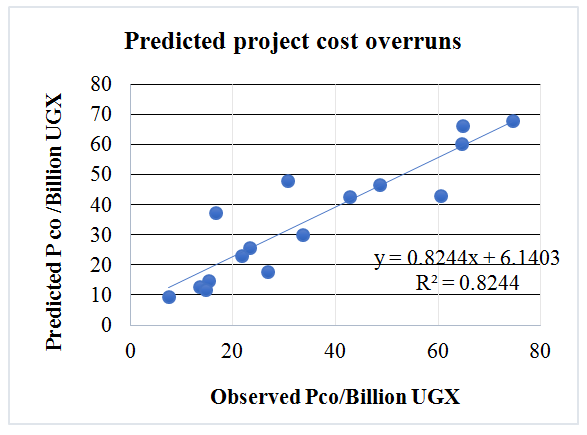 | Figure 5. Predicted cost Overrun with Estimated Model |
|
|
|
4.7. Validation Results
- External model validation was conducted using data from other completed projects not part of that used in the model estimation. Data for the model parameters from five (05) new completed paved road projects was input into the estimated model during calibration and validation process to check the predictive ability of the estimated model. A plot of observed cost overruns against the cost overruns estimated using the already developed model in 4.6 is shown in Figure 6.
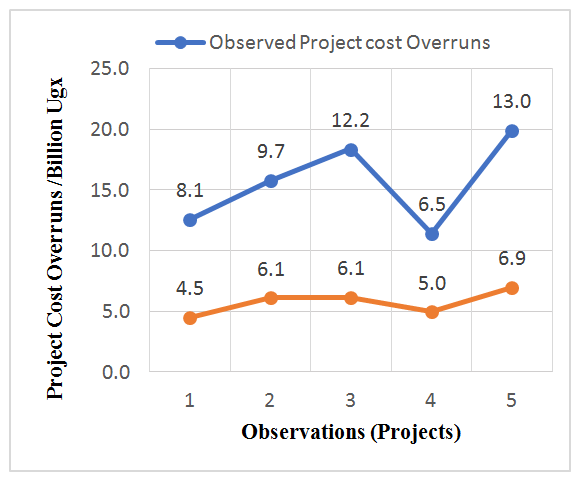 | Figure 6. Comparison of Observed and Predicted cost Overruns |
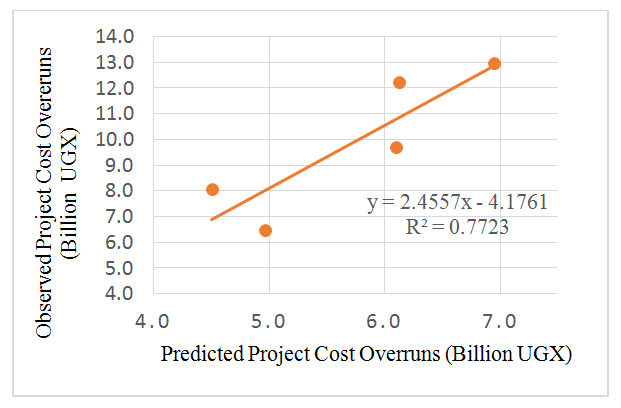 | Figure 7. Observed Verses Predicted Cost Overruns using the developed Model |
5. Conclusions and Recommendations
5.1. Conclusions
- According to the practitioners’ opinions, the five highest ranking design flaws in order were; provision of less number of drainage culverts, inadequate quarries and earthen materials investigations, Inadequate geotechnical investigations for road subgrade, under estimation of quantities for earthworks like rock fill and provision of less volumes of cut and fill. Therefore, the research concludes that the above design flaws are prominent on all construction projects and should be given critical attention during design to alleviate their impact on project cost when addressed during construction.The cost overrun rate due to the design flaws ranged between 13.1% and 72.6% with average of 33.3%. Therefore 33.3% of the cost overrun in the studied projects can be explained by the four design flaws studied while 66.7% was due to other factors and design flaws. Therefore, the research concluded that, though design flaws contribute to cost overruns, the majority of the cost overruns are not from the four examined design flaws but rather from the other inherent project issues and the other design flaws not examined.In addition, the research concluded that rock fill has the biggest effect (11.0% on average) on cost overrun in projects and therefore all sections on a road which require special treatment should be precisely identified during design so that the involved costs are included in the initial project estimates. The linear regression model developed for predicting cost overruns based the collected data set was:
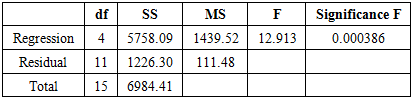
 The model was found significant at 0.01 level of significance with significant F of 0.0004 and R square of 0.824 implying that the total variations in total cost overrun defined by the design flaws are 82.4% that the model is feasible from the data point of view with only 17.6% data loss. Therefore, the research concluded that where design was not comprehensive, the project cost overruns in road construction projects could be predicted using the developed model to 82.4%.
5.2. Recommendations
- Most of the critical design issues ranked are related to field investigations. Therefore, it is highly recommended that there be instituted clearly document specific guidelines for Uganda with respect to conducting geotechnical and materials investigations. Ample time be given to the geotechnical engineering teams to carry out these studies so as to inform the designs. Specific budget lines be allocated for geotechnical investigations on projects and be distinct from the design budget. This was because in an attempt to save on costs, investigations are not carried out comprehensively. It is also recommended that design reviews for projects to be done comprehensively by a separated consultant different from the one doing construction supervision.A significant effort was spent in gathering relevant data from clients, consultants and contractors on project costs and cost increases resulting from the studied design inadequacies. However, data confidentiality, poor documentation of events, absence of proper record archiving and management changes did not allow the collection of sufficient data to ensure the robustness of the developed regression models. This research recommends that data on completed projects be properly archived for public consumption to allow for research and development. Reporting to be improved to capture specifics which contributed to cost variations and the extent to which they increased the costs to aid future research.This particular study concentrated on costs only, it was a very sensitive subject matter and partly hindered the secondary data collection process. Further research should be conducted on the different factors causing cost overruns and establish the extent to which the major contributors affect the cost overruns.