Salma Yahia Mohamed Mahmoud1, Eltahir Abu Elgasim Mohamed Elshaikh2
1Civil Engineering Department, University of Science and Technology, Sudan
2Constrction Engineering Department, Sudan University of Science and Technology, Sudan
Correspondence to: Eltahir Abu Elgasim Mohamed Elshaikh, Constrction Engineering Department, Sudan University of Science and Technology, Sudan.
| Email: |  |
Copyright © 2019 The Author(s). Published by Scientific & Academic Publishing.
This work is licensed under the Creative Commons Attribution International License (CC BY).
http://creativecommons.org/licenses/by/4.0/

Abstract
Variation orders (VOs) are one of the main challenges that face all building projects’ stakeholders. Previous preliminary investigation conducted with some construction managers in Sudan revealed that VOs were viewed as the main cause of increase in contract value by more than 25%, extension of time and decrease in quality and productivity on building projects in Khartoum state. This paper outlines the results of a study on the evaluation of the impact of VOs on building projects in Khartoum State, Sudan. Initially, a thorough and comprehensive review of the literature was conducted to identify the most significant impacts of VOs on building projects. Detailed information of 10 building projects executed in Khartoum State, Sudan during the years 2007 to 2015 was gathered. VOs that were witnessed and recorded during these projects’ execution were listed and their causes were recorded. It was found that project’s durations increased by (22-200)% due to Vos. Cost analysis on the other hand, showed an increase by (2.67-42.86)% due to VOs. To validate the preliminary results, this was then complemented by a questionnaire survey to allow gauging VOs impacts on a wider sample. A stratified sample comprising civil engineering (47) consultants, (53) contractors, (23) projects’ owners and (7) experienced project managers participated in the survey. Responses were then analysed via the calculation of the importance index. When viewed from the perspective of the different participating parties, the Spearman’s Correlation Coefficient factors showed a strong relationship (0.952–0.978) indicating well-matched opinions about the impacts of VOs. The calculated Relative importance index (RII) values were (0.92-0.73) confirming that all listed VOs impacts are witnessed in building projects in Sudan. Respondents agreed that “Decrease in productivity of workers’, “Increase in projects cost”, “Completion schedule delay”, “Disputes between owners and contractor”, “Decrease in quality of work”, “Increase in overhead expenses”, “Increase in the duration of individual activities”, “Demolition and rework” and “Delay in payments”, “Hold of work in another areas”, “Additional costs for contractor” is the order of the strength of impacts of (VOs) on building projects in Khartoum state.
Keywords:
Building Projects, Contractors, Impact, Khartoum, Projects Evaluation, Variation Orders
Cite this paper: Salma Yahia Mohamed Mahmoud, Eltahir Abu Elgasim Mohamed Elshaikh, The Potential Effects of Variation Orders on Building Projects in Khartoum State-Sudan, International Journal of Construction Engineering and Management , Vol. 8 No. 2, 2019, pp. 70-79. doi: 10.5923/j.ijcem.20190802.04.
1. Introduction
The implementations of building projects are expected to provide further thrust to the construction sector. Therefore, it is important to ensure these projects are being implemented successfully without any major problems while minimizing the adverse impacts of variation orders on the project outcome [1]. A variation order is a written order to the contractor, signed by the Owner, and issued after the execution of the contract, authorizing a change in the work or an adjustment in the contract sum or time [2]. Changes in drawings and contract documents usually lead to change in the contract price and/or schedule. VOs increase the possibility of contractual disputes and in general, changes present problems to all parties involved in the building projects process. As such, they could be a major cause for projects failure. From some preliminary investigation conducted with some construction managers in Sudan, VOs were viewed as the main cause of increase in contract value, extension of time and decrease in quality and productivity on building projects in Khartoum state. This research seeks to gauge the impact of VOs on effects of the performance of building projects in Khartoum State, Sudan.The most important factors that contribute to the occurrence of VOs in building projects in Khartoum state are namely: Lack of stability of prices and the exchange rate change, New regulations, Non availability of construction manual and procedure for construction project in Sudan, Errors and omissions in design,two factors in the same ranking (5) Owner fails to make decisions or review document at the right time and Owner’s needs during the design stage are not well-defined or variably, (7) Owner’s financial problems, two factors in the same ranking (8) Contractors financial difficulties and the lack of coordination between consultant and contractors and subcontractors and (10) Non-use value engineering in design stage to find the best alternatives [3].
2. Literature Review
Previous studies on VOs are mainly focused on the sources and causes of their occurrence. Many times delays, cost overrun and quality defects of a construction can be attributed to variation at various stages. VOs have an impact on overall project performance [2]. This is because variations can cause substantial adjustment to the contract duration, total direct and indirect cost, or both. Those VOs involved alteration, addition, omission, and substitution in terms of quality, quantity and schedule of work. Any addition, deletion, or any other revision to project goals and scope of work are considered to be variation. As [2] described that VOs had an impact on overall project performance and the major adverse impact relates to time and cost overruns and disputes between the parties to the contract. As [4] noted that variability impedes project performance while [5] concluded that they adversely affect productivity and project costs.Numerous studies have been done to identify the impacts of variations, relationships between variation and its impacts [5-12]. According to this ploretha of authors, the various impacts of VOs were: 1. Decreases in Productivity The productivity of workers is negatively impacted by VOs especially repetitive changes. Labor cost accordingly increases and so the total project cost. In countries where labor is cheap, this impact is not felt. However, this degradation of productivity may cost extra days or weeks of expensive labour.2. Delays in Completion Schedule Variation often results in time extension. In other instances, the owner may want to compensate the contractor for accelerating the work in order to keep up with the original schedule. In either case, additional time means additional money. Delays in completion can be quite costly. Imagine a facility such as a refinery or a large commercial center that costs millions when it is delayed for weeks or even days. Whoever is signing the change order ought to know the cost of delay before granting a time extension. 3. Dispute between Owner and Contractor VOs are among the most common reasons leading to claims and disputes. All other work is agreed upon in the contract however, changes must go through evaluation, estimation and negotiation leading to stress and strains in the relation between parties. If these disputes are not settled peacefully through direct negotiations and arbitration, they end up in court and legal procedures may suspend the whole project. 4. Decreases in Quality Sometimes variation leads to a lower level of workmanship. As changes alter the original plan in certain items or areas, they might create a mismatch with other items or areas affecting the overall quality of the work. As discussed above, the low morale of the crew after many changes are made is also expected to affect the quality of their Performance. 5. Increases in Project Cost This is a very evident result of variation orders. Literature reviewed presented figures of common project cost increases due to change orders. 6. Additional Money for Contractor No matter how much was said about the negative effects of VOs, there is often additional money gained by the contractor for executing additional scope. The accuracy of this statement depends on the awareness of contractors and owners of direct and indirect impacts of changes and on the willingness to accept this fact in change order pricing. 7. Delay of Material and Tools VOs bring about problems with materials and tools required to carry out a certain activity. Consider for example an order to change the type of doors of a building at a time after the order for doors was issued to the vendor. The new type of doors may not be available from the vendor and may require extra time to order or fabricate. This creates delay for materials which in turn holds up work for finishing subsequent work. The delay of tools happens for example when a certain erection procedure has changed requiring a larger crane that is not readily available. The cost of such a delay can be quite costly.8. Work on Hold Variation in a certain work package can put the work on other activities on hold. This happens when activities are interdependent. This action may freeze a certain craft crew or shift the schedule of its schedule. Speedy and quick change order procedures are very vital in order to minimize this effect. 9. Increases in Overhead Expenses Normally VOs require processing procedures, paper work and reviews before they even proceed. They may require holds on funds that otherwise will be used for other activities. These minor expenses are normally not charged to the change order account as they are difficult to define and separate from the different accounts. The charge normally goes on the contractor’s overhead account. 10. Delays in Payment If payments due to the contractor are made against a certain milestone then there is a possibility of delay in payment as a result of a variation that delays the achievement of that milestone. 11. Demolition and Re-work Quite often, variation that occur after construction of the project cause some parts of the work done to be demolished and done again. This is the worst phase to think of changes and the cost of changes is the highest on the project time curve.
3. Research Methodology
Due to the nature of data to be collected from the relevant parties for the study, a purposive sampling method was adopted. A combination of qualitative and quantitative approaches was used in the study.
3.1. Studied Cases
10 cases of building projects executed during the years (2007-2015) were studied in depth where detailed information was collected (contract documents, monthly reports and weekly reports). That was followed by face-to-face interviews with projects’ participants with the aim of determining the effect of (VOs) on the overall performance of the studied projects.
3.2. Industry Survey
The questionnaire was designed taking into consideration the objectives of the study and aiming to answer the research questions. Great effort and brainstorming went into designing the questionnaire. Case study analysis and meetings with members of the industry were conducted to scrutinize the questions required and to present them in a clear and an unambiguous format. Special care also went into phrasing the questions in a language that is easily understood by respondents. In anticipation that many respondents may not be fluent English readers or speakers, an Arabic version of the questionnaire was developed. The same effort was put into the Arabic version to present a clear and easy to understand format.
3.2.1. Contents of the Questionnaire
The questionnaire was divided into two sections: The first section included “instructions” to respondents defining the key terms in the study and providing them with instructions on completing the questionnaire. It also contained general information about the respondents such as contact address, company size, type, industry characteristics such as experience, amount of change, etc. The second section addressed the possible” impact of VOs on the project performance”. A list was developed from the literature review comprising the possible effects. A review of these effects is presented in section 2. Responses in this section were given on a 5-points scale starting with VERY OFTEN (marked as 5) and ending with NEVER (marked as 1).
3.2.2. Population and Sample
Three restrictions were imposed on the selection process of respondents: (1) to include contractors and consultant, (2) to limited the choice to building projects (Administrative, Commercial, Residential, Hospital) (3) to include Khartoum State. With these restrictions in mind, the researchers targeted populations comprised: owners, contractors, consultants and project managers as classified by the Contractors Union and the Council of Organizations of Consultants in Sudan.The size of the sample required from each population was determined on the basis of statistical principles for this type of exploratory research. For such research, sample size was determined as follows [13, 14]: | (1) |
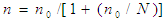 | (2) |
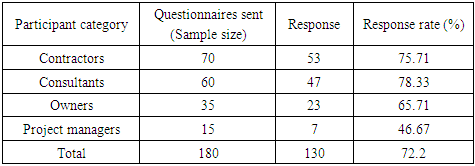
Where: n0: First estimate of sample size, P: The proportion of the characteristic being measured in the target population, q: Complement of ‘p’ or 1-p, V: The maximum standard error allowed, N: The population size, n: The sample size. Respondents were grouped into four major groups namely: contractors, consultants, owners and projects managers. The returns from the four groups are presented in table 1 below which shows the response rate. Out of 180 targeted responses, only 130 (72.2%) of them completed and returned the questionnaire. 130 copies of the questionnaires including 53 contractors, 47 consultants, 23 owners and 7 projects managers were received.Table 1. Questionnaire distribution and return rate
 |
| |
|
3.2.3. Pilot Study
A pilot study could help to refine data collection plans with respect to both the content of the data and procedure to be followed [14]. Thus, piloting the questionnaire with a small representative sample ensures the effectiveness of a questionnaire [15]. In this case, a judgment sample of 18 respondents with good spread of respondents’ characteristics was chosen for the preliminary testing of the questionnaire. Questionnaires were administered to contractors, consultants, owners and projects managers contacted in person. Nevertheless, only 14 valid responses were received from respondents constituting 77.7% response which was considered adequate for validation. Based on the feedback, minor corrections were made to improve the format, layout, questions and the overall content of the questionnaire. Through this process, the questionnaire was validated and provided the authors with improvement opportunity prior to the main survey.
3.4. Data Analysis
The analysis of the data was carried out with the help of Statistical Package for Social Sciences (SPSS) version 21.0. Data was analysed applying the reliability test, frequencies and impact analysis, Relative Importance Index, Spearman's ranking correlation coefficient, descriptive statistics.
3.4.1. Reliability
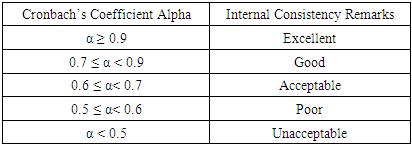
Reliability is described as a measure of the degree to which a research instrument yields consistent results or data after repeated trials. [15] Reliability in research is influenced by random errors. As random error increases, reliability decreases. [16] Provided a commonly accepted rule of thumb for describing internal consistency using Cronbach's alpha as follows:Table 2. Cronbach's consistency alpha
 |
| |
|
3.4.2. Relative Importance Index
The Relative Importance index (RII) for each impact was calculated according to equation (3) [1], [3], [17] | (3) |
Where: Xi: the number of respondents who selected the option of impact; N: the total number of respondents.
3.4.3. Spearman's Rank Correlation Coefficient
The analysis included ranking the factors in terms of their degree of impact. The Spearman (rho) rank correlation coefficient is used for measuring the differences in ranking between two groups of respondents scoring for various factors (i.e. owners versus consultants, owners versus contractors, and consultants versus contractors).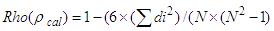 | (4) |
Where: Rho (ρcal): Spearman's rank correlation coefficient; di: the difference in ranking between each pair of factors; and N: number of impacts (variables). The value of the Spearman (rho) rank correlation coefficient varies between -1 and +1. A correlation coefficient of +1 implies perfect positive correlation, 0 implies no correlation and -1 implies perfect negative correlation. [1]
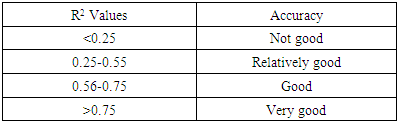
3.4.4. Correlation Coefficient (R2)
Correlation coefficient (sometimes called the regression coefficient) is the act of the linear correlation between two variables x and y, between +1 and -1 for sale inclusive. R2 = 1 indicates a perfect linear correlation and linear regression perfect, R2 =0 is no correlation and R= -1 total negative correlation. Table 3 states the accuracy of the correlation coefficient in measures by determination R2. [18]Table 3. Measure of correlation accuracy by R2
 |
| |
|
4. Results Analysis and Discussion
4.1. Analysis of the Studied Cases
As shown in figures 1 through 3, the results confirmed a direct relationship between the presence of VOs and project’s time overrun. It was recorded that projects’ durations increased by (22-200)% due to VOs which is considered alarming. Cost analysis, on the other hand, showed an increase by (2.67-42.86)% due to Vos.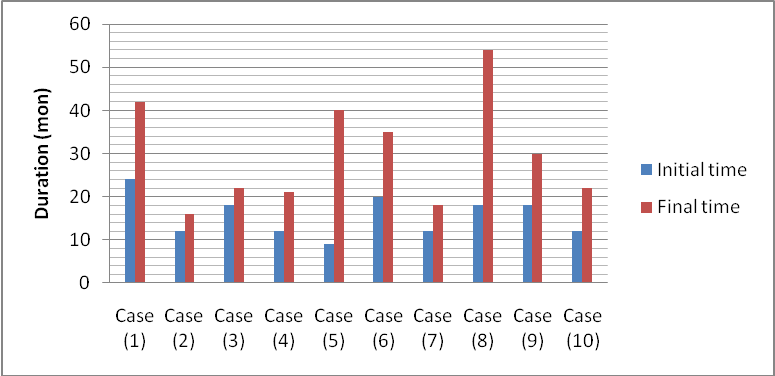 | Figure 1. Comparison of the initial and final Time for Studied projects |
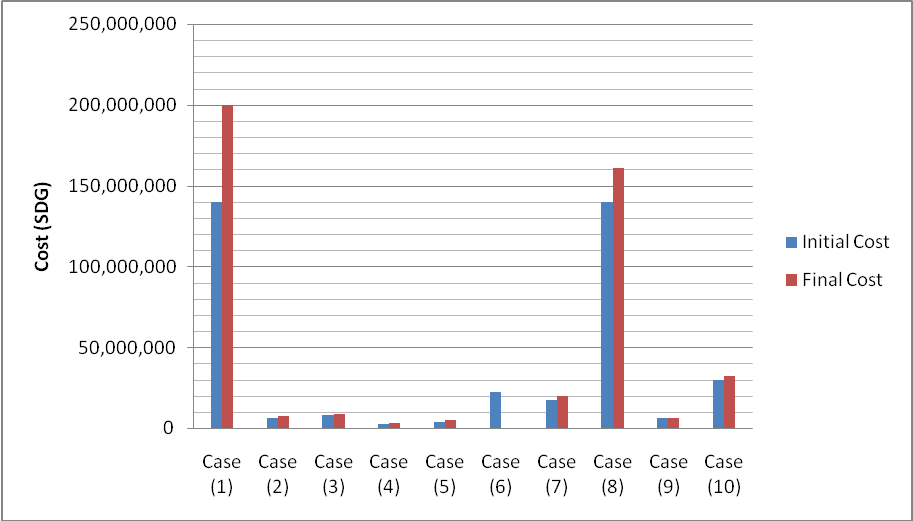 | Figure 2. Comparison of the initial and final Cost for Studied projects |
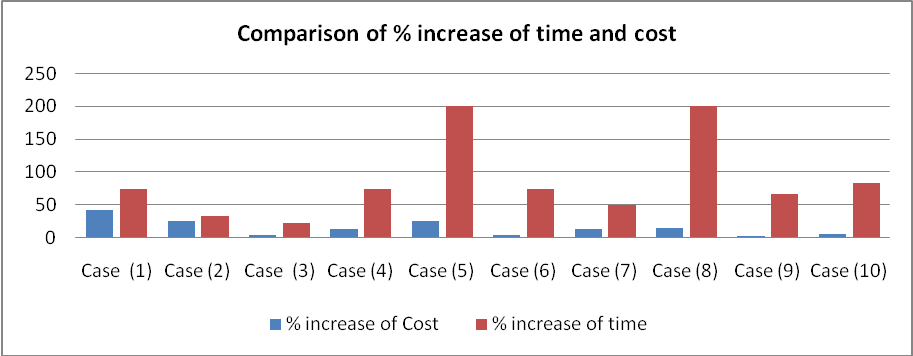 | Figure 3. Comparison of the% increase in cost and time |
4.2. Industry Survey
4.2.1. Result of Reliability
Reliability test was carried out to determine whether the questionnaire was capable of yielding similar scores if the respondents have used it twice. The test was conducted using SPSS. The determined Cronbach’s alpha coefficient value for questionnaire was 0.857. This value indicates that the questionnaire items form a scale that has reasonable internal consistency reliability. Indicating that the survey instrument used was good, reliable and acceptable and that an agreement exists between the construction industry participants.
4.2.2. Sample Configuration
The configuration of the participants was as presented in Figure 4, 5.4% of the respondents were project managers, 40.8% were contractors, 17.7% were owners and 36.2% were consultants. 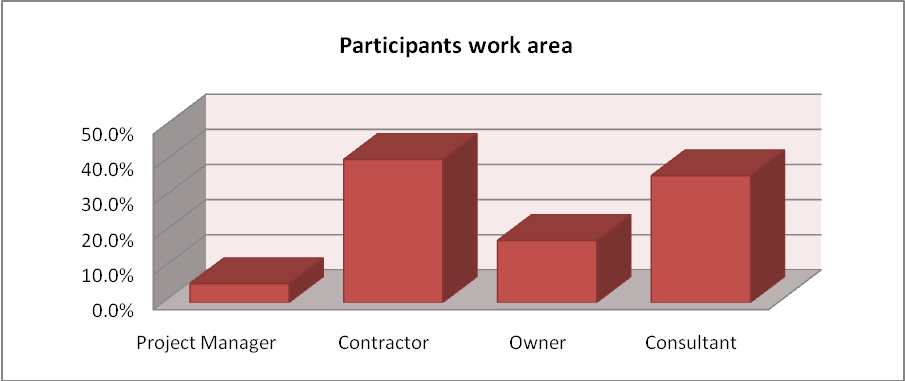 | Figure 4. Participants work area |
Regarding their work area, the results showed that 27.7% classify themselves as public sector organizations, while 72.3% were private sector organizations as illustrated in Figure 5.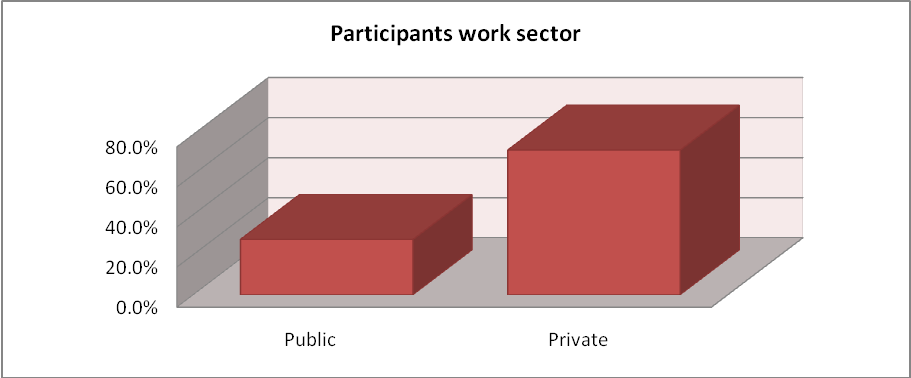 | Figure 5. Participants work sector |
When asked to specify their specialization, 79.2% of the respondents were civil engineers while 20.8% were architects (refer to Figure 6).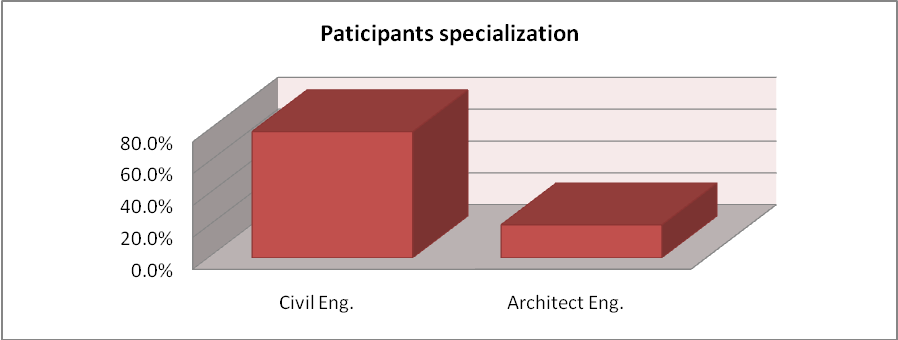 | Figure 6. Participants specialization |
To evaluate the respondents experience, 12.3% admitted to be working in the field less than 5 years, 20.8% were working for (5 – 10) years, 32.3% for (10-15) years and 34.6% for more than 15 years. This confirms that (2/3) of participants have been working for at least10 years which imply a good experience to give a reasonable consent. (Refer to Figure 7).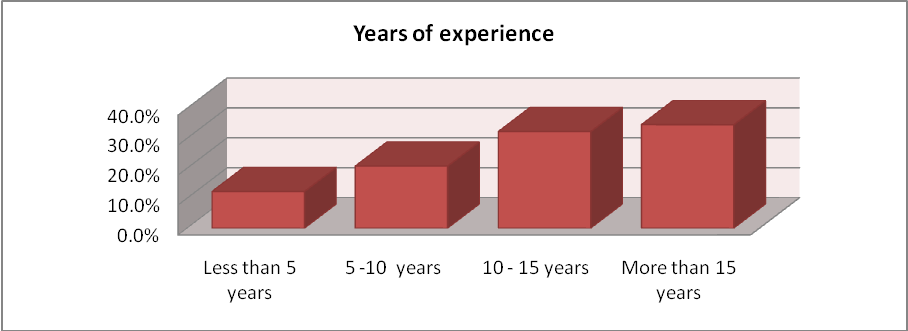 | Figure 7. Participant’s experience |
To gauge the frequency of occurrence of VOs in building projects in Khartoum State, respondents were asked to state the number of projects executed with VOs and they were given 4 options to choose from to present their feedback. The results proved that VOs are witnessed in all executed projects, with 20% confirming that VOs happened in less than 5 projects, while 14.6% said (5 –10) projects, 36.9% said (10-15) projects and 28.5% said for more than 15 projects. This confirms the fact that about two thirds of the respondents (65.4%) admitted having at least 10 projects having VOs.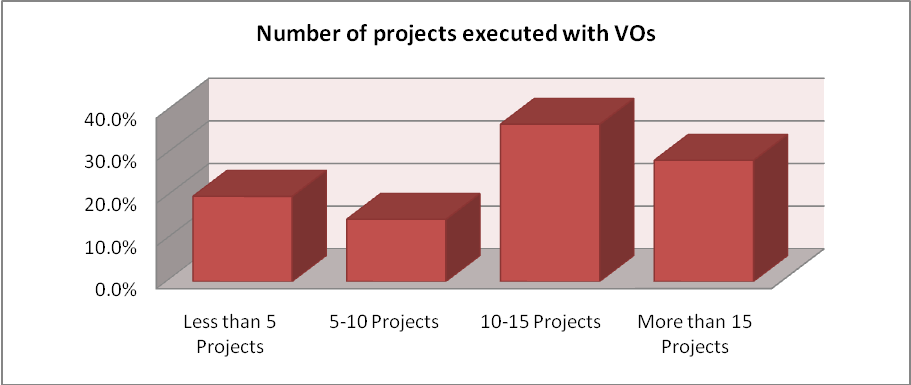 | Figure 8. Number of projects executed with VOs |
4.2.3. Occurrence and RII of Impact of VOs
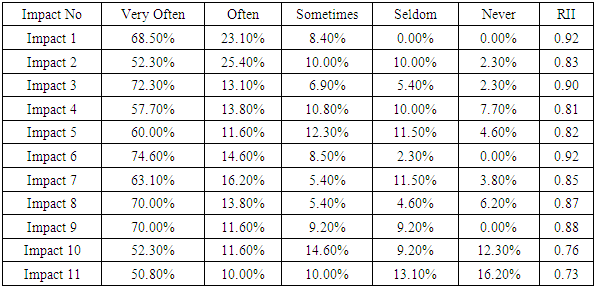
Owing to the fact that VOs could be caused by several factors with a variable impact level, respondents were asked to give their opinion ranking the occurrence of each of the highlighted 11 possible impact forms on projects’ performance. The results obtained are as presented in table 4 and Figures 9 and 10.Ÿ 68.5% of the respondents confirmed that Increase in the cost of the projects occurs very often, 23.1% often, 8.4% sometimes, 0% seldom and 0% never, the RII is 0.92; this result confirms that the majority of the respondents consider this to be the most frequently occuring impact during project execution.Ÿ 52.3% of the respondents mentioned that Increase in duration of individual activities occurs very often, 25.4% often, 10.0% sometimes, 10.0% seldom and 2.3% never, the RII is 0.83; this result stresses the fact that the majority of the respondents consider this as an impact of VOs during project execution.Ÿ 72.3% of the respondents confirmed that Delay in completion schedule) occurs very often, 13.1% often, 6.9% sometimes, 5.4% seldom and 2.3% never, the RII is 0.90; this result confirms that the majority of the respondents consider occurring this impact frequently during project execution.Ÿ 57.7% of the respondents confirmed that Delay in payments occurs very often, 13.8% often, 10.8% sometimes, 10.0% seldom and 7.7% never, the RII is 0.81, this result confirms that the majority of the respondents consider occurring this impact frequently during project execution.Ÿ 60.0% of the respondents confirmed that Demolition and re-work occurs very often, 11.6% often, 12.3% sometimes, 11.5% seldom and 4.6% never, the RII is 0.82; this result confirms that the majority of the respondents consider occurring this impact frequently during project execution.Ÿ 74.6% of the respondents confirmed that Decrease in productivity of workers occurs very often, 14.6% often, 8.5% sometimes, 2.3% seldom and 0% never, the RII is 0.92; this result confirms that the majority of the respondents consider occurring this impact frequently during project execution.Ÿ 63.1% of the respondents confirmed that Increase in overhead expenses occurs very often, 16.2% often, 5.4% sometimes, 11.5% seldom and 3.8% never, RII is 0.85; this result confirms that the majority of the respondents consider occurring this impact frequently during project execution.Ÿ 70.0% of the respondents confirmed that Decrease in quality of work occurs very often, 13.8% often, 5.4% sometimes, 4.6% seldom and 6.2% never, the RII is 0.87; this result confirms that the majority of the respondents consider occurring this impact frequently during project execution.Ÿ 70.0% of the respondents confirmed that Disputes between owners and contractor occur very often, 11.6% often, 9.2% sometimes, 9.2% seldom and 0% never, the RII is 0.88; this result confirms that the majority of the respondents consider occurring this impact frequently during project execution.Ÿ 52.3% of the respondents confirmed that Hold on work in other areas occurs very often, 11.6% often, 14.6% sometimes, 9.2% seldom and 12.3% never, the RII is 0.76; this result confirms that the majority of the respondents consider occurring this impact frequently during project execution.Ÿ 50.8% of the respondents confirmed that Additional money for contractor occurs very often, 10.0% often, 10.0% sometimes, 13.1% seldom and 16.2% never, the RII is 0.73; this result confirms that the majority of the respondents consider occurring this impact frequently during project execution.Table 4. Occurrence and relative importance index of impact of VOs on the projects’ performance
 |
| |
|
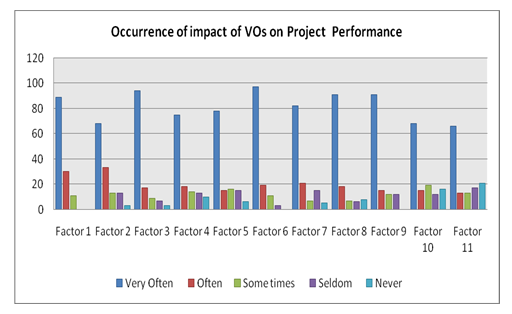 | Figure 9. Occurrence of impact of VOs on project performance |
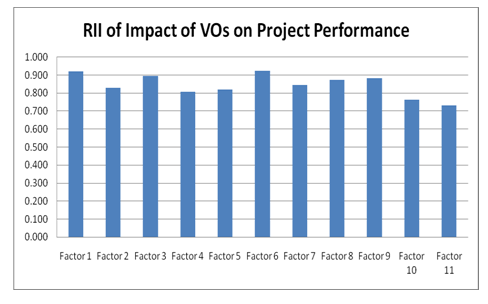 | Figure 10. RII of impact of VOs on project performance |
Upon checking the same result from the perspective of the participanting consultants, (60%) confirmed that all 11 outlined effects on project performance take place very often in the pattern presented in figure 11.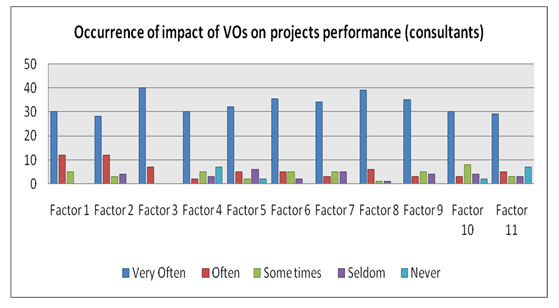 | Figure 11. Occurrence of impact of VOs on project performance (Consultants) |
The results shown in figure 12 for participating consultants portray the relative importance index when the 11 possible impact effects of VOs on project performance were considered. It was evident that as the highest ranked was Delay in completion schedule (RII=0.97) while the lowest was Delay in payments scoring (RII= 0.79).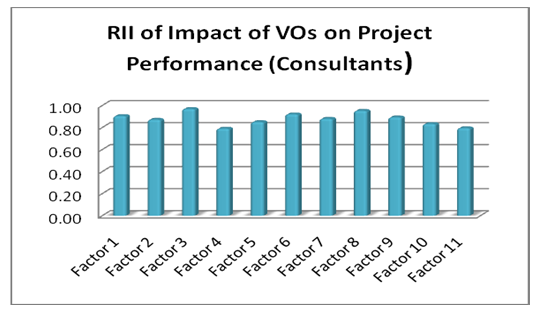 | Figure 12. RIIof impact of VOs on project performance (Consultants) |
Upon checking the same result from the perspective of contractors participants, (40%) confirmed that all 11 impact effect on project performance occur very often. Refer to figure 13.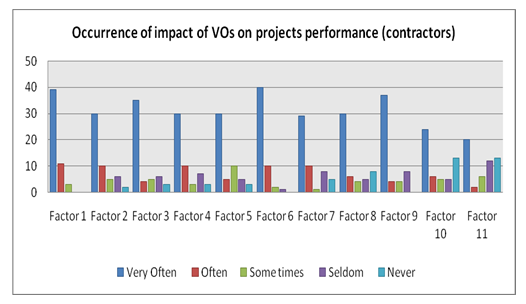 | Figure 13. Occurrence of impact of VOs on project performance (Contractors) |
The results of relative importance index of impact of VOs on projects performance from the contractors’ view have indicated 0.94 for Increase the cost of the projects and Decrease in productivity of workers a varied until to 0.62 for Additional money for contractor (refer to figure 14).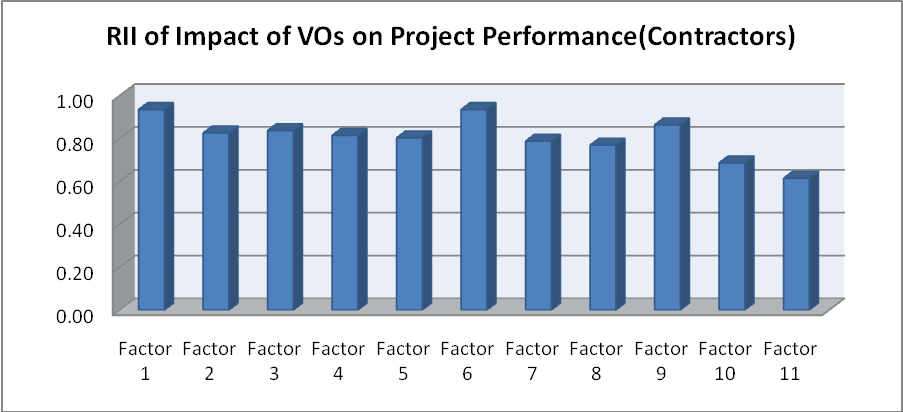 | Figure 14. RII of impact of VOs on project performance (Contractors) |
Upon checking the same result from the perspective of the different participants, at least (35%) of owners confirmed that all 11 impact effect on project performance occur very often (refer to figure 15).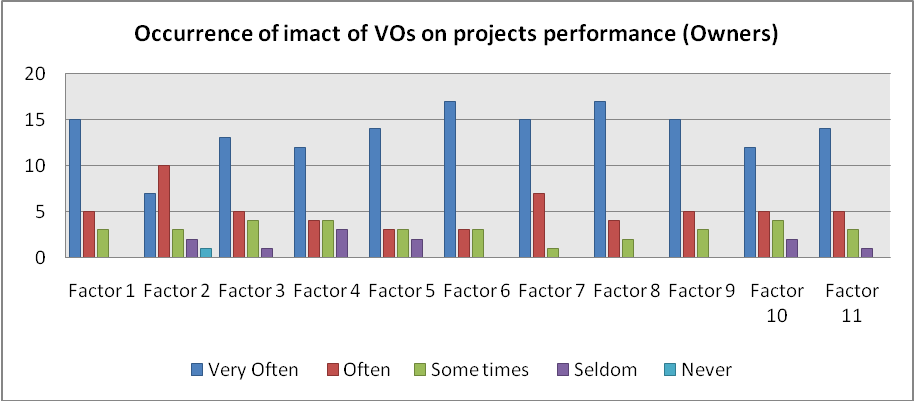 | Figure 15. Occurrence of impact of VOs on project performance (Owners) |
The results have also shown (as portrayed in figure 16) that the relative important index of impact of VOs on projects performance from the perspective of the participating owners 0.93 for Decrease in quality of work and as low as 0.77 for Increase in duration of individual activities.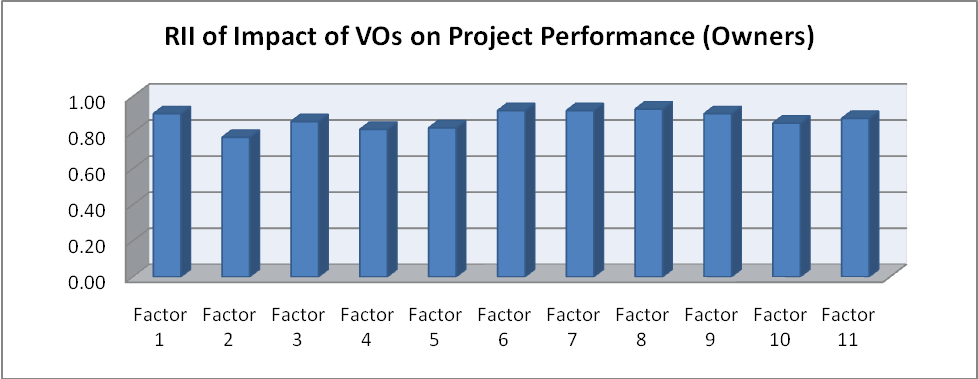 | Figure 16. RIIof impact of VOs on project performance (Owners) |
Checking the same result from the perspective of projects managers revealed that (42%) confirmed that all 11 impact effects on project performance occur very often, see in figure 17.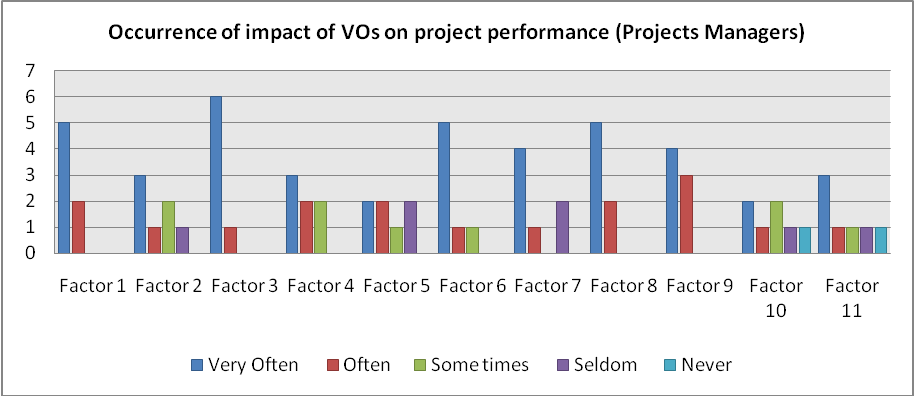 | Figure 17. Occurrence of impact of VOs on project performance (Project Managers) |
The results in figure 18 show that the relative importance index for the impact of VOs on projects performance was 4.86 for Delay in completion schedule and was 3.29 for Hold on work in other areas. 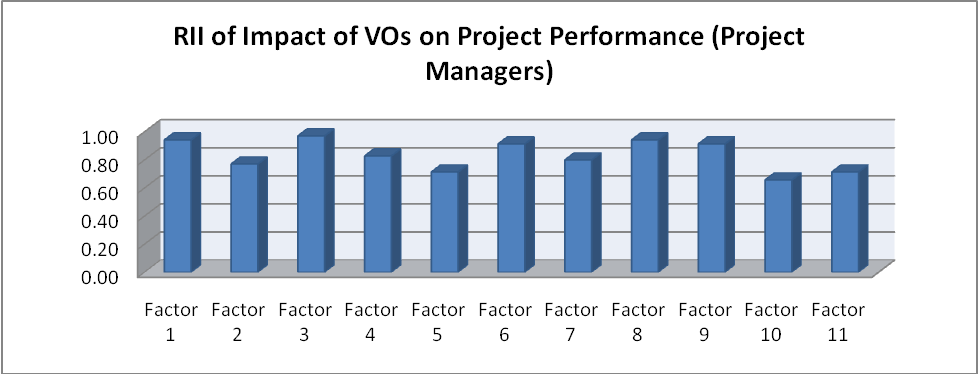 | Figure 18. RII of impact of VOs on project performance (Project Managers) |
4.2.4. Ranking of Impact of VOs on Project Performance
As viewed by all participants, the results from figure 19 indicate that the ranking of the impact (consequences) of VOs on project performance is as follows: (1) Decrease in productivity of workers, (2) Increase the cost of the projects, (3) Delay in completion schedule, (4) Disputes between owners and contractor, (5) Decrease in quality of work, (6) Increase in overhead expenses, (7) Increase in duration of individual activities, (8) Demolition and re-work, (9) Delay in payments (10) Hold on work in other areas, (11) Additional money for contractor.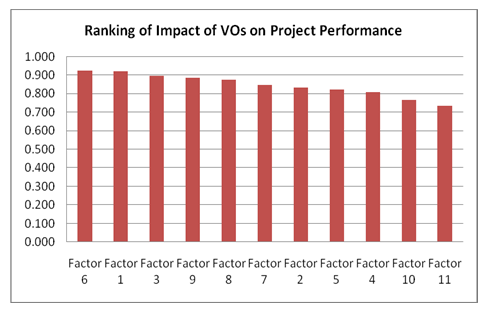 | Figure 19. Ranking of impact of VOs on project performance |
According to the consultants views, the results from figure 20 show that the ranking of the eleven impact of VOs on project performance is as follows: (1) Delay in completion schedule, (2) Decrease in quality of work, (3) Decrease in productivity of workers, (4) Increase the cost of the projects, (5) Disputes between owners and contractor, (6) Increase in overhead expenses, (7) Increase in duration of individual activities, (8) Demolition and re – work, (9) Hold on work in other areas, (10) Hold on work in other areas, (11) Delay in payments.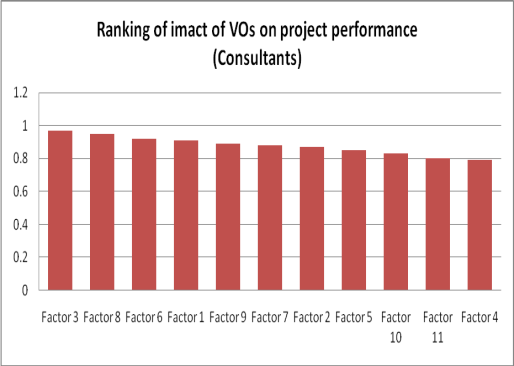 | Figure 20. Ranking of impact of VOs on project performance (Consultants) |
According to the contractors’ views, the results from figure 21 showed that the ranking of the eleven impact of VOs on project performance is as follows: Two impact in the same rank (1) Increase the cost of the projects and Decrease in productivity of workers, (3) Disputes between owners and contractor, (4) Delay in completion schedule, (5) Increase in duration of individual activities, (6) Delay in payments, (7) Demolition and re-work, (8) Increase in overhead expenses, (9) Decrease in quality of work,(10) Hold on work in other areas, (11) Additional money for contractor.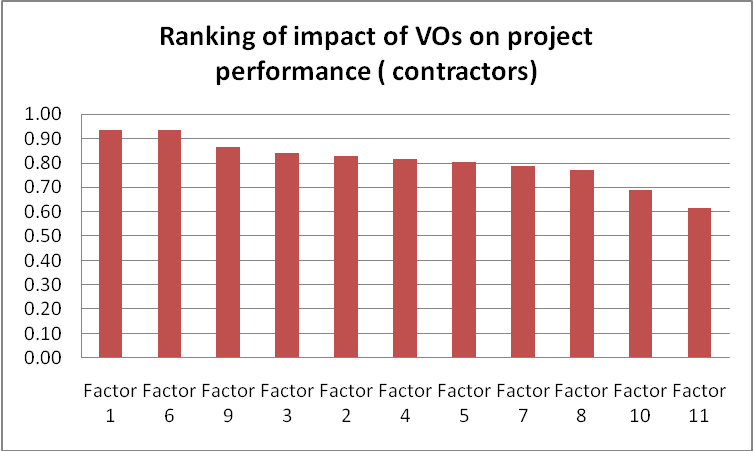 | Figure 21. Ranking of impact of VOs on project performance (Contractors) |
According to the owners’ views, the results from figure 22 showed that the ranking of the eleven impact of VOs on project performance is as follows: (1) Decrease in quality of work, Two impact in the same rank (2) Decrease in productivity of workers and Increase in overhead expenses, Two impact in the same rank (4) Increase the cost of the projects and Disputes between owners and contractor, (6) Additional money for contractor, (7) Delay in completion schedule, (8) Hold on work in other areas, (9) Demolition and re-work, (10) Delay in payments, (11) Increase in duration of individual activities.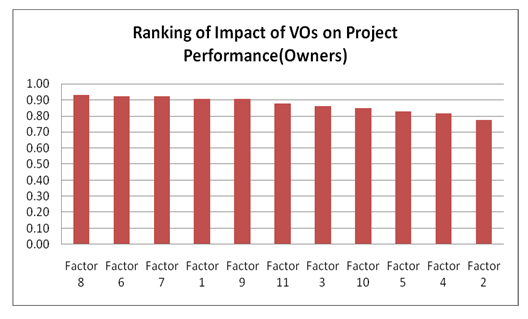 | Figure 22. Ranking of impact of VOs on project performance (Owners) |
According to the projects managers’ views, the results from figure 23 showed that the the ranking of the eleven impact of VOs on project performance is as follows: (1) Delay in completion schedule, Two impact in the same rank (2) Increase the cost of the projects and Decrease in quality of work, Two impact in the same rank (4) Decrease in productivity of workers and Disputes between owners and contractor, (6) Delay in payments, (7) Increase in overhead expenses, (8) Increase in duration of individual activities, Two impact in the same rank (9) Demolition and re-work, and Additional money for contractor, (11) Hold on work in other. 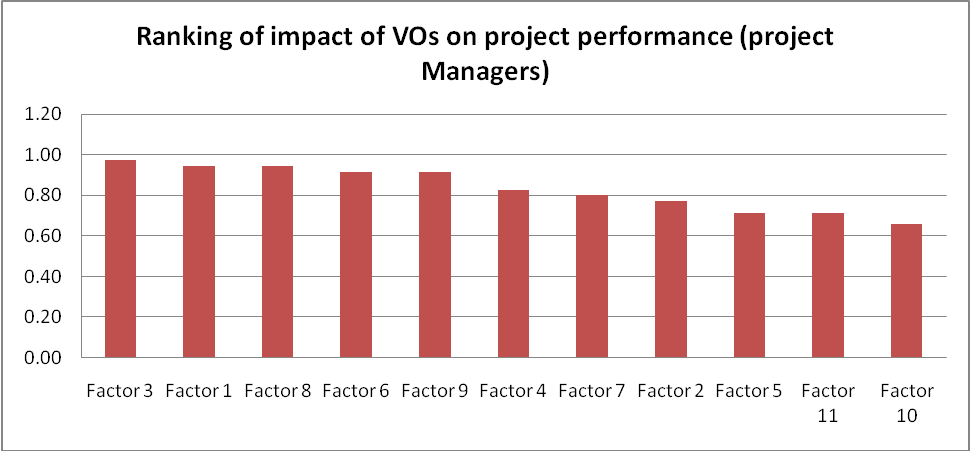 | Figure 23. Ranking of impact of VOs on project performance (Project Managers) |
4.2.5. Spearman’s Rank Correlation Coefficient
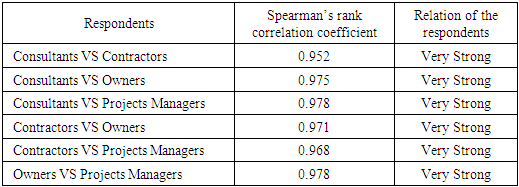
A correlation test (Spearman’s Correlation Coefficient) was performed among the different groups of respondents. As shown in table 5, the correlation coefficient indicates that there is a very strong correlation between all groups. This implies that most of the respondents have the same perception about the impact of VOs on project performance.Table 5. Spearman’s Correlation Coefficient) on the ranking of impact of VOs on project performance
 |
| |
|
4.2.6. Correlation Coefficient (R2)
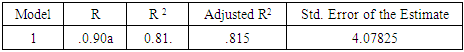
A correlation test (Correlation Coefficient R2) was done by SPSS V (21). As shown in table 6, the R2 values indicate that there is a very good and perfect linear correlation and linear regression for the impact of VOs on project performance.Table 6. Correlation Coefficient R2 of the impact of VOs on project performance
 |
| |
|
5. Conclusions
The results confirmed a direct relationship between the occurrence of VOs and projects’ time overrun. It was recorded that projects’ durations increased by (22-200)% due to VOs which is considered alarming. Cost analysis, on the other hand showed an increase by (2.67-42.86)% due to VOs.The eleven highly influential factors with the most noticeable impacts on project performance are: (1) Decrease in productivity of workers, (2) Increase the cost of the projects, (3) Delay in completion schedule, (4) Disputes between owners and contractor, (5) Decrease in quality of work, (6) Increase in overhead expenses, (7) Increase in duration of individual activities, (8) Demolition and re-work, (9) Delay in payments (10) Hold on work in other areas, (11) Additional money for contractor is the order of the strength of impact of VOs on building projects in Khartoum state. When viewed from the perspective of the different participating parties, the spearmen’s Correlation factors showed a strong relationship (0.952- 0.978) indicating well – matched opinions about ranking of factors causing VOs.
ACKNOWLEDGEMENTS
Thanks to everyone who contributed to this research, special thanks to Engineer Mohamed Isaam, Engineer Mohamed Hassan, Engineer Hayder Mohamed and Ekrima Mohamed.
References
| [1] | Yadeta, A.E., 2016, The Impact of Variation Order on Public Building Projects, Journal of Construction Engineering and Management, 5(3), 86-91. |
| [2] | Ruben, N. 2008, "An analysis of the impact of variation orders on project performance", Cape Peninsula University of Technology, Theses & Dissertations, Paper 33. |
| [3] | Mohammed, E. E., Mohammed, S. Y., & Hassan, A. S. (2017). Factors causing variation orders in building projects in Khartoum State-Sudan. International Journal of Engineering Sciences & Research Technology, 6(11), 117-129. |
| [4] | Thomas, R. and Napolitan, L. 1995, ‘Quantitative effects of construction changes on labor productivity’, Journal of Construction Engineering and Management, vol. 121, no.3, pp 292-294. |
| [5] | Ibbs, C.W. 1997, 'Quantitative Impacts of Project Change: Size Issues', Journal of Construction Engineering and Management, vol. 123, no. 3, pp 308-311. |
| [6] | Hanna, A.S., Calmic, R., Peterson, P.A., Nordheim, E.V. 2002, ‘Quantitative Definition of Projects Impacted by Change Orders’, Journal of Construction Engineering and Management, vol. 128, no. 1, pp 57-64. |
| [7] | Thomas, R. and Napolitan, L. 1995, ‘Quantitative effects of construction changes on labor productivity’, Journal of Construction Engineering and Management, vol. 121, no.3, pp 292-294. |
| [8] | Osman, Z., Omran, A., FOO, C. 2009, ‘The potential effects of variation orders in construction projects’, Journal of Engineering annals of Faculty of Engineering, Hunedoara, pp 8-10. |
| [9] | Arain F.M. and Pheng L.S. (2005): The Potential Effects of Variation Orders on Institutional Building Projects, Journal of Facilities, Vol 23 No 11/12, 2005, pp 496-510. |
| [10] | Haldun, C. 1998, ‘Using Simulation to Quantify the Impacts of Changes in Construction Work’, Thesis, Virginia Polytechnic Institute and State University. |
| [11] | CII. 1990, ‘The Impact of Changes on Construction Cost and Schedule’, Construction Industry Institute, University of Texas, Austin. |
| [12] | Ibbs, C. Williams, Lee,S., and Li, M. (1998). ‘Fast-tracking’s impact on project change’, Project Management, Vol. 29. No. 4, 35-41. |
| [13] | Yin, R. K., 2009, Case Study Research: Design and Methods. 4th ed. London: SAGE Publications. |
| [14] | Palinkas, L. A., Horwitz, S. M., Green, C. A., Wisdom, J. P., Duan, N., and Hoagwood, K., 2015, Purposeful Sampling for Qualitative Data Collection and Analysis in Mixed Method Implementation Research. |
| [15] | Kombo, D. K., and Tromp, D. L. A., 2006, Proposals and Thesis Writing: An Introduction. Nairobi: Pauline’s Publications Africa. |
| [16] | George D & P Marllery. (2003). SPSS for Windows Step by Step: A Simple Guide and Reference. |
| [17] | Kothari, C. R., 2004, Research Methodology: Methods and Techniques. 2nd ed. New Delhi: New Age International (P) Limited. |

 Abstract
 Reference
 Full-Text PDF
 Full-text HTML