Reyadh M. M. Mohammed, Saad M. A. Suliman
Department of Mechanical Engineering, University of Bahrain, Kingdom of Bahrain
Correspondence to: Reyadh M. M. Mohammed, Department of Mechanical Engineering, University of Bahrain, Kingdom of Bahrain.
| Email: |  |
Copyright © 2019 The Author(s). Published by Scientific & Academic Publishing.
This work is licensed under the Creative Commons Attribution International License (CC BY).
http://creativecommons.org/licenses/by/4.0/

Abstract
Delay in pipeline construction projects in the oil and gas industry attributed by schedule and budget overruns is a major challenge in oil and gas industry. A total of 47 delay factors were identified and ranked where timely project completion alongside with adherence to the budget, quality and safety standards were found to contribute to a project success. Some of the factors identified in the study included: poor managerial skill, slow decision making within all project teams; lack of communication between client, consultant and contractor; inadequate design team; scope variations; unrealistic contract decision and delay in drawings preparation of the project. This paper identifies the factors causing delays and the risk associated with them in the pipeline construction projects in Bahrain. A risk mapping matrix was employed to classify each delay factor under a specific zone based on the mean value of Importance (Consequence) and Frequency (Likelihood) to illustrate the impact nature of the risks resulting from the delay factor. The study adopted a mixed method research design approach which was guided by a pragmatic philosophical stance. The results of this study indicated that inadequate project planning, budgeting, and scheduling, scope variation, and late materials delivery were the main delay causing factors. The research also provides recommendations such as contractor penalties and proper project team engagement have been made to help avoid and mitigate some of the risks to ensure efficiency and timely project completion.
Keywords:
Construction delay, Delay causing factors, Pipeline construction projects
Cite this paper: Reyadh M. M. Mohammed, Saad M. A. Suliman, Delay in Pipeline Construction Projects in the Oil and Gas Industry: Part 1 (Risk Mapping of Delay Factors), International Journal of Construction Engineering and Management , Vol. 8 No. 1, 2019, pp. 24-35. doi: 10.5923/j.ijcem.20190801.04.
1. Introduction
Delays and disruptions in construction projects have severe impact on the success of a construction project. A project success is anchored on several factors which include: timely project completion, adherence to the set budget, conformance with the quality standards, and safety measures (Gebrehiwet and Luo, 2017). In the oil and gas industry, prompt completion of projects within the set budget is one of the major objectives as the case of all the construction sectors. Linear construction projects as the case for the oil pipeline construction projects have a high likelihood to suffer delays occasioned by numerous diverse and inherent complexities (Orangi et al., 2011). Specific to pipeline construction delays, any factor that exceeds the project timeline is expected to escalate the construction cost in several ways. For instance, losses associated with less quality production associated with the extension of the production commencement date of a unit may be experienced. This is one of the main reasons the construction companies globally strategize measures to enable them to complete their projects within the scheduled timeline. The paper aims to identify and rank the factors causing delay based on risk assessment matrix.
2. Literature Review
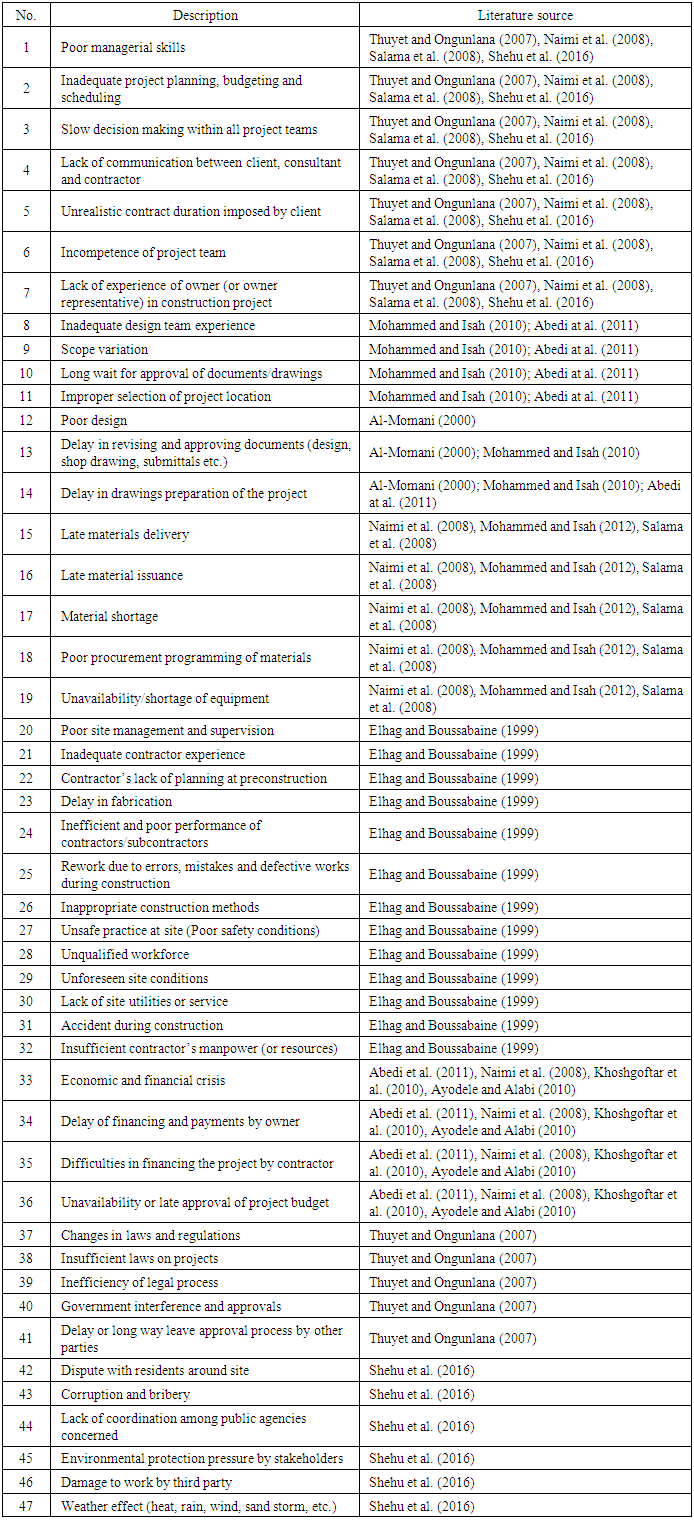
Several studies have been conducted to investigate the factors causing delays in numerous construction projects. Elhag and Boussabaine (1999) in their study evaluated the construction cost and attributes. The study identified 67 main factors with consultant and design parameters, client characteristics, project characteristics and market conditions being ranked as the top-four factors with the highest influence to the time and cost factor. Al-Momani (2000) identified that poor design was the main reason behind the project delays in a randomly selected sample of 130 public building projects. Out of the sampled projects, 106 experienced delays. From the findings, poor designs accounted for 24.6% of the projects, followed by a change of client order at 15.4%. The changes made to design, clients, changing orders and climatic conditions among others were also identified as delay factors. Similar findings were made by Abedi et al. (2011) where cost overruns were evaluated to be caused by price inflation of materials, client’s change of design, climatic changes and lastly late payment of contractors.Thuyet and Ongunlana (2007) carried a study on the process of managing risk in the petroleum industry in Vietnam. The study was aimed at establishing the major risks affecting the industry and how to mitigate the risks. The findings identified the top risks of project delays as incompetent manpower and lack of systematic structures. The same risks were identified in a study conducted on construction delays in the construction of the Iranian petrochemical plants (Naimi et al., 2008). Lack of competent workforce among other factors such as delay in delivery of materials, inflation and unrealistic estimation was considered as the most significant causes of delay. In a similar study on the causes of delays in the Iranian construction industry, Khoshgoftar et al. (2010) identified lack of proper planning, site management, poor communication and financing as the main causal factors. These results corroborated those in Ayodele and Alabi’s (2011) study, which showed the dominance of the client factors for construction delays as poor communication, lack of proper project objectives, irregular payments and lack of adequate time. In another study, Salama et al. (2008) investigated the reasons of delay in petroleum projects in the United Arab Emirates (UAE). The study concurred with the previous studies as it identified the main causes of project delays as delay in purchasing, late delivery of materials and lack of competent and experienced labor force. Several studies on the Nigerian construction sector has identified various causes. For instance, Mohammed and Isah (2012) in their study made findings that inappropriate planning, poor communication, supply shortage and design errors as the main causes. In another different study, Ganiyu and Zubairu (2010) examined projects in Nigeria. This particular study indicated that the most influential factors were design related factors and those related to the cost of public building projects. On a study on the effect of delays on contractor’s reputation in Nigeria, Shehu et al. (2016) identified design problems, construction defects, and management of construction sites as the main factors.The importance of this paper lies in the fact that most of the previous studies did not include all of the following in a single study (identification of the delay factors, ranking of the delay factors, and developing the risk assessment for the delay factors). The previous studies were either focused on the delay factors alone or the ranking of delay factors without carrying out the risk assessment analysis for those factors. In addition to that, there was no research found to study this specific topic in the Kingdom of Bahrain and precisely in pipeline construction projects. Therefore, this study is aimed to identify the causes of delay and their associated risk in the pipeline construction projects in Bahrain. Furthermore, it is providing the management with some recommendations to mitigate those risks. Therefore, to have an in-depth understanding of the different delay factors studied, Table (1) below shows the relationship of each factor with the relevant source in the literature review.Table (1). Showing Relationship between the Delay factors and the Literature Review
 |
| |
|
3. Methodology
This research collected data through a mixed methodology; quantitative method (survey) and semi-qualitative (interviews and actual project data from XYZ Company’s KPI). One hundred and seventy-three delay causing factors that were found to be relevant to the pipeline construction projects in the sector were used in the study. The factors were retrieved from the literature review and XYZ Company’s KPI, the company responsible for revitalization and stewardship of the Bahrain oil field. Twenty face to face surveys with the company’s and contractor’s experts were conducted to reduce the number of factors to 67 highly applicable ones as an accumulative from at least 12 respondents. Interviews with eight field experts were then conducted and as a result 47 critical delay factors were identified out of the 67 highly applicable factors found earlier. The 47 critical delay factors were grouped into 7 groups based on the previous studies, namely management-administrative related, design related, materials related, construction related, financial/economical related, and finally statutory laws and regulations related.Figure (1) represents a flow chart showing the key steps used in the design, formulation and analysis of data using primary research questionnaire survey.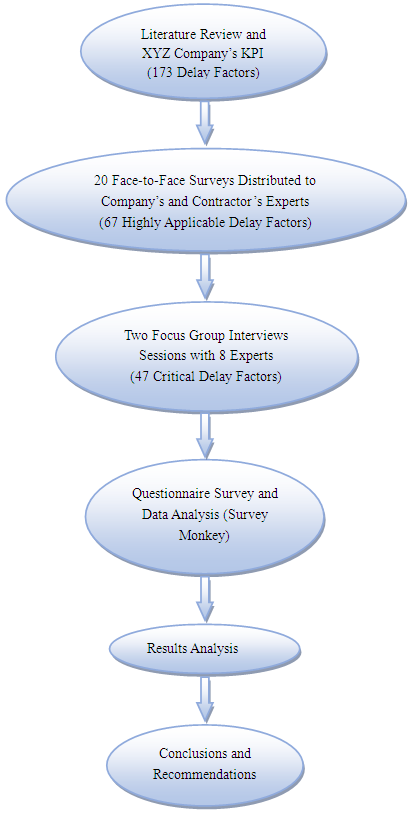 | Figure (1). Research and Design Methodology Flow Chart |
3.1. Focus Group Interviews
Two focus group sessions were conducted with eight industry experts with at least five years of experience. The interviewees were project managers, engineers, supervisors and contractors working in Bahrain oil and gas field. A delay factor was considered main critical if at least five out of the eight interviewees considered it highly applicable to pipeline construction in the Bahraini oil and gas industry. The self-designed interview protocol contained delay factors based on three principal rationales; the relevance, impact significance, and frequency of each delay factor to pipeline construction projects. As the main outcome of the focus group sessions, 41 main critical factors were identified for further consideration in the quantitative phase of this research as well as six factors were added according to the experts of XYZ Company. Those six factors were very important to be added to the main critical factors as they were already included in the XYZ Company KPI.
3.2. Questionnaire Design and Data Collection Procedure
3.2.1. Design of Questionnaire
Survey was performed by questionnaire method, where a web-based questionnaire developed using Survey Monkey was administered. It comprised three main sections; research information including objectives and ethical safeguards, factors sourcing for demographic data of respondents (i.e. current project location, organization type, job designation, industry type, total experience in pipeline construction, highest education, and based on size of the company they represent), and the third section comprised forty seven 5-point Likert-type factors for scoring the delay factors in terms of frequency and importance of the delay impact on the pipeline construction projects. (Where 1= Very Low to 5= Very High). An example of a prompt on the importance of poor managerial skills as a delay causing factor read, “What is the impact of “poor managerial skills” on pipeline construction projects?” As for the frequency of the same delay causing factor, the prompt read, “How often is “poor managerial skills” or does it occur in pipeline construction projects?” The choice for Likert-type prompts was informed by four major reasons associated with this prompt types. First, using Likert-type prompts offered the respondents more response options than using Yes/No type of responses. In addition, the researcher figured that data obtained through Likert-type prompts enabled the generation of more inferential statistical operations than other tools that would generate nominal data. In any case, Likert-type prompts are more straightforward for the respondent especially since the survey was not administered by the researcher, as explained in the next section. Finally, the data collected through Likert-type prompts made it easier to rank the delay causing factors and the respective attributes.However, the researcher exercised caution during presentation of findings and drawing of inferences from the Likert-type data because Likert data often summarizes responses containing underlying information that could be lost or hidden. For example, Likert-type prompts let the respondent to rank or score an item, but they do not allow for the respondents to explain why they chose a particular score over another. Therefore, it is possible that the Likert prompt’s summary score might hide information about patterns of variation in responses”. The factors were also obtained from the Key Performance Indicators of XYZ Company to ensure that they related to reality as much as possible.
3.2.2. Data Collection
As a result of the data extracted from the total number of respondents (N = 93), through the web-based questionnaire according to the importance and frequency scores, the mean values for importance and frequency, which were used for mapping the 47 delay factors on the risk mapping matrix, were calculated using the following equations: | (1) |
 | (2) |
Where nij is the number of respondents who gave Importance score i ( i = 1, 2, …, 5) to factor j;  is the number of respondents who gave Frequency score i (i = 1, 2, …, 5) to factor j; and N is the total number of respondents. In order to rank the delay factors in terms of their importance as obtained from the respondents through the survey, the Relative Importance Index (RII) approach was opted. Equation (1) illustrates the formula:
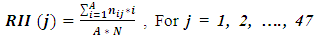 | (3) |
Where RII (j) is the RII of factor j ( j = 1, 2, …, 47); and A is the highest possible score of 5. Concerning the ranking of the delay factors in terms of their occurrence rate, the Frequency Adjusted Importance Index (FAII) was adopted. The fundamental requirement of determining the FAII of factor j (FAII (j)) is to measure and compute both the Frequency Index of factor j (FI (j)) and the RII (j) based on response data from the survey. Equation (2) shows the relationship for FI (j).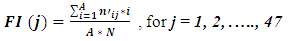 | (4) |
Where FI (j) is the FI of factor j ( j = 1, 2, …, 47)FAII (j) is given by combining Equation (3) and Equation (4): | (5) |
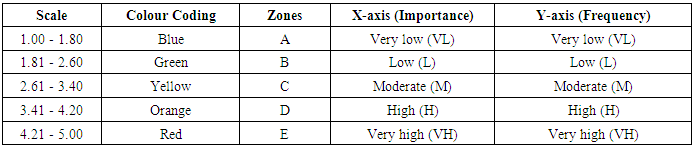
After identifying the delay factors and calculating the mean values of RII and FI for each of them, risk mapping matrix was employed to illustrate the impact nature of the risk resulting from the delay factor presented in the form of a matrix. Each delay factor was classified under a specific risk zones as shown in Figure (2) based on the mean values of both importance and frequency as described in Table (2). Risk analysis was conducted for the delay factors based on the standard XYZ Company’s Risk Assessment Map. The scale adopted for plotting the frequency and importance mean values, obtained from the survey results, is illustrated at Table (2) below.Table (2). Scale Used to Map Factor Frequency and Impact on Risk Matrix
 |
| |
|
The various color codes in the table above denote different risk categories and imply different issues. Blue color code, A, implies no need for further studies or actions on the risk factor although there is need for asset management for the documentation of all risk studies. Green color code, B, calls for asset management to consider how feasible it is to institute measures to reduce risk. Documentation at this level includes potential hazards, risk studies, and measures to reduce risk. As for yellow color code, C, it demands that asset management evaluates extra measures for reducing risk, implementing the measures considered feasible and approving ongoing operations. The rationale for taking particular actions is noted along with documentation of potential hazards, risk studies, and measures for reducing risk.Asset management for orange color code, D, involves performing suitable quantitative or qualitative risk analysis for the verification of the risk level. At this level, facility management is required to institute suitable measures for reducing the risk. Moreover, facility management needs to inform promptly higher authority levels such as senior management when they figure that the risk is irreducible to a lower category promptly. Documentation of potential hazards, risk studies, and measures for reducing risk also need to be done. Finally, risks coded with the red color, E, calls for the utilization of the opportunities noted during risk analysis to inform the implementation of measures to mitigate or reduce the risk. For risks deemed irreducible or impossible to lower to other categories promptly, quantitative risk analysis is performed to ascertain the level of risk and evaluate the opportunities for mitigation. There is a need to review the opportunities for risk reduction every year. Documentation of potential hazards, risk studies, and measures for reducing risk also need to be carried out, as is the norm with the previous color code. However, re-authorization upon expiry of agreed timeframe is necessary. The scale used by XYZ Company for mapping delay factors on Frequency (Likelihood) and Importance (Consequence) risk map is demonstrated in Figure (2).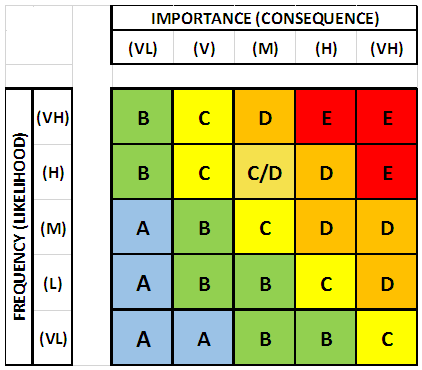 | Figure (2). The Scale Used to Map a Risk Factor’s Frequency and Importance |
4. Analysis of Results
At the end of the online data collection period, a total of 120 responses were collected. Majority of the questionnaires were received from respondents working in Bahrain (n = 102) followed by those working in GCC (n = 18). However, the criteria for participation in this research and questionnaire completeness led to the dropping of 27 questionnaires, i.e. only 93 were considered. The sample size was computed based on Hogg and Tannis’ (2009) formula (where n is the sample size of limited population; m is the unlimited sample size of the population; and N is the size of the available population): | (6) |
However, the value of m in Equation (6) is computed using the formula presented as Equation (7) below. In the equation, z denotes the confidence level’s statistical value such as 1.96 for a confidence level of 95%. On the other hand, p and ε denote the value of the population proportion under estimation and the point estimate’s sampling error, respectively.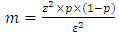 | (7) |
With the value of p being unknown, the suggestion is the use of a conservative 0.5 value to obtain maximum sample size. Thus, a 95% confidence interval yields a 5% significance level rendering m (unlimited population sample size) as follows: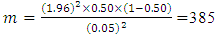 Substituting m in Equation (6) results in 92 respondents as the representative sample:
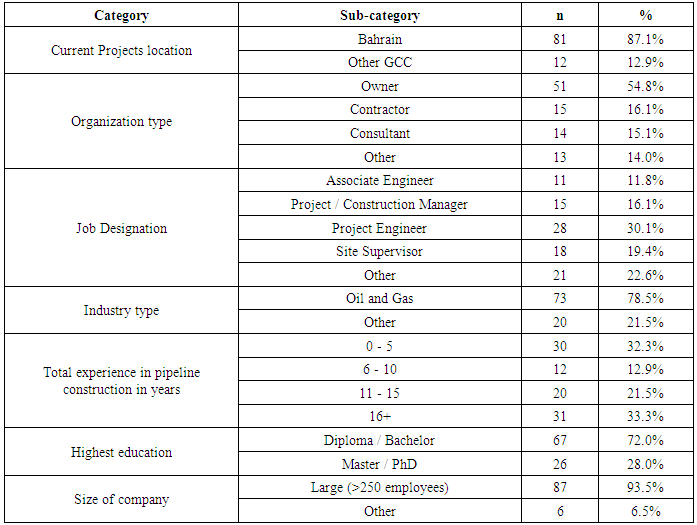
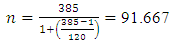 Reliability tests were conducted in SPSS to measure the internal consistency of the questionnaire by generating the Cronbach’s alpha coefficient for both importance and frequency of the delay factors, where 0.7 value of Cronbach Alpha is considered to be acceptable and 0.8 or higher (i.e. up to 1) indicated good internal consistency. The Cronbach Alpha was found to be 0.960 for the Importance and 0.963 for the Frequency. This implied high internal consistency of the data and suitability for the future statistics.Descriptive statistics were generated for the demographic prompts. Specifically, frequency tables were generated for each of the demographic prompts. All the relevant data from the respective frequency tables generated based on the demographic data of the respondents were combined into summary form. The outcome of this combined summaries appears in Table (3) below.
Table (3). Summary of All Demographic Data
 |
| |
|
The importance and frequency recorded Cronbach’s alpha coefficients of 0.960 and 0.963, respectively. This implied high internal consistency of the data and suitability for further statistics.Ranking Comparison between Respondent GroupsTo generate a more robust view of the delay factors and ensure coverage of different categories of respondents, the researcher conducted the ranking of the delay factors for all respondent groups based on their demographic profiles. In other words, the ranking comparison was performed based on the location of current projects, organization type, job designation, industry type, total pipelines construction experience, highest education and the size of the company.Comparisons were conducted between all categories, but 9 significantly strong agreement comparisons were found. These were between Bahrain and other GCC, between owners and contractors, owners and consultants, between contractors and consultants, between project/construction managers and project engineers, between project/construction managers and site supervisors, and between project engineers and site supervisors. Additionally, strong correlations were found in terms of years of experience between respondents with 11 and 15 years and their counterparts with more than 16 years’ experience in pipeline construction. Moreover, strong agreement was found between Diploma/Bachelor and Master/PhD holders in terms of highest education. Each of these categories are discussed below in greater detail.Spearman’s rank order correlation test was performed on the respondent groups of different organization types as captured in the questionnaire. The results revealed statistically significant positive correlation coefficients between owner and contractor organizations (rs = 0.820, p < 0.05). Similar results were reported for the FAII rankings of owner and consultant types of organizations (rs = 0.858, p < 0.05). Likewise, the FAII rankings between contractor and consultant organization types (rs = 0.862, p < 0.05). The FII ranking results reported significant moderately positive correlation between the different organizational types and the others (i.e. designer, subcontractor, supplier, etc.) with correlation coefficient values vary from 0.645 to 0.714. Another Spearman’s correlation coefficient appearing was performed on the experience category. The results indicated significant strong agreement (positive correlation) in FAII rankings between respondents with work experience ranging between 11 and 15 years and those with experience of more than 16 years in pipelines construction with the computed value of 0.852 (p < 0.05). Additionally, significant moderately positive correlation was reported for the FAII ranking values for respondents with below five years’ experience and those with 6-10 (rs = 0.520, p < 0.05), 11-15 (rs = 0.639, p < 0.05), and 16 years or more (rs = 0.735, p < 0.05). Respondents with 6-10 years of experience also registered statistically significant, moderate correlation coefficients with their counterparts that had 11-15 years (rs = 0.475, p < 0.05) and 16 or more years (rs = 0.570, p < 0.05).The results based on the importance (consequences) and frequency (likelihood) data of the delay factors based on survey responses identified inadequate project planning, budgeting, and scheduling as the highest factor in terms of importance and frequency.
5. Means, RII, FI and FAII of Delay Factors
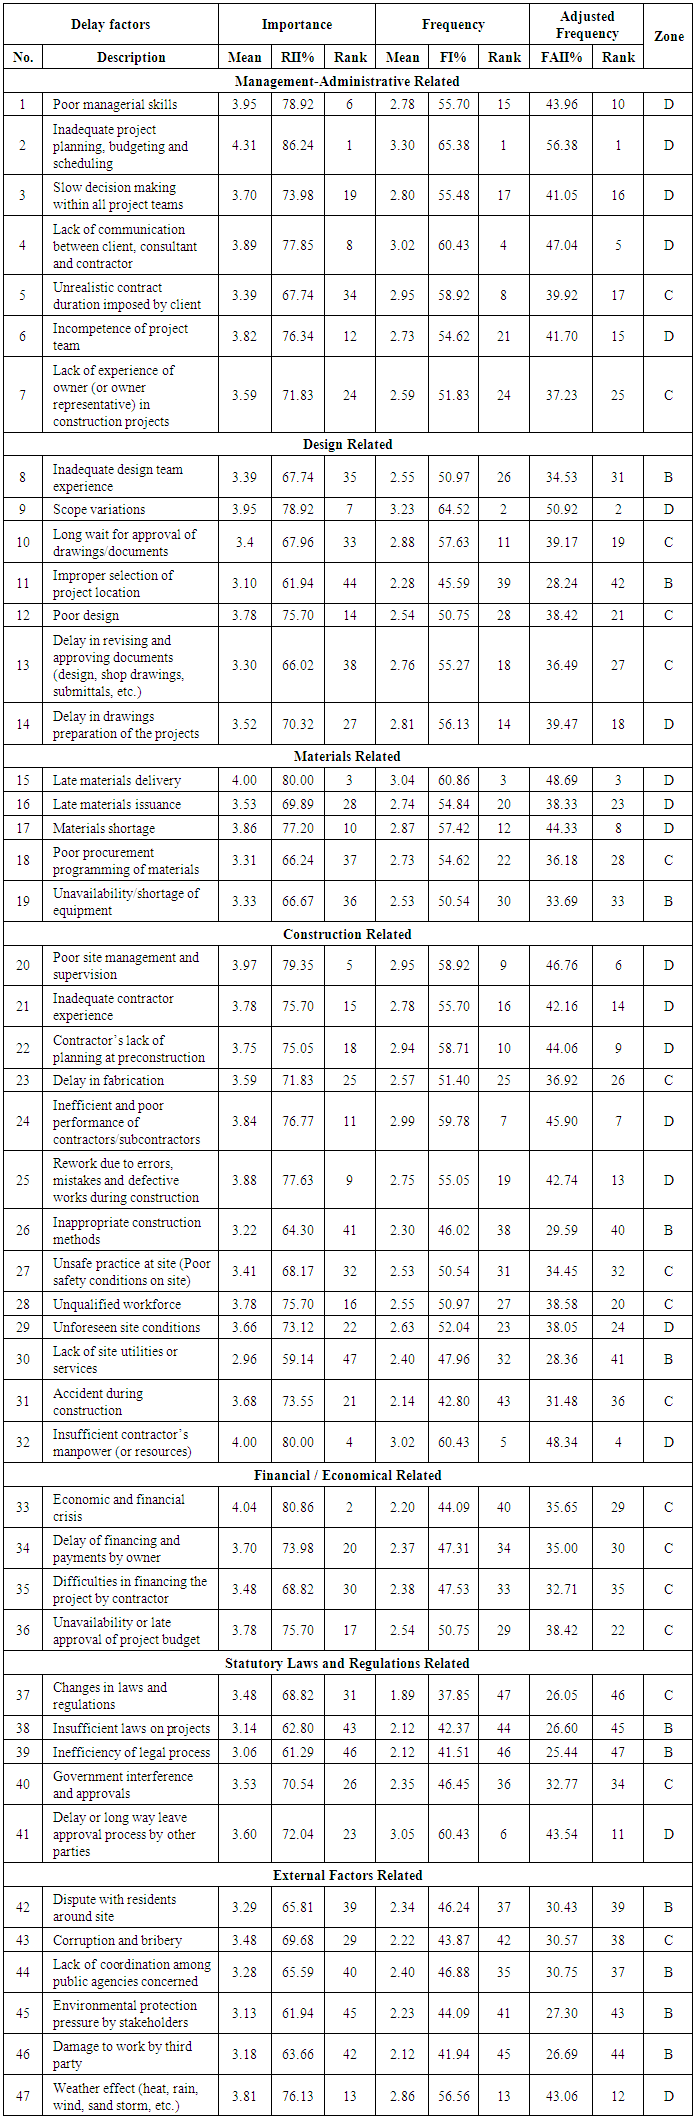
The importance mean values were generated by using Equation (1). The highest delay factor was inadequate project planning, budgeting, and scheduling, which was equal to 4.31 calculated as follows: ([(2×1) + (1×2) + (7×3) + (39×4) + (44×5)] /93). On the other hand, the frequency mean value were generated by using Equation (2). The highest delay factor was again found to be inadequate project planning, budgeting, and scheduling with a value of 3.30, which was calculated as follows: ([(3×1) + (18×2) + (31×3) + (28×4) + (12×5)] /92). Table (4) shows all the 47 delay factors with their importance and frequency mean values.The RII computation based on Equation (3) resulted in ranking inadequate project planning, budgeting, and scheduling as the highest factor with an RII score of 86.24%. With an RII score of 80.86%, economic and financial crisis ranked second highest followed by late materials delivery with a score of 80%. Lack of site utilities or services had the lowest RII score of 59.14% which was lower than the scores of inefficiency of legal process and environmental protection pressure by stakeholders with RII scores of 61.29% and 61.94% respectively.FI ranking based on Equation (4) had the highest factor as inadequate project planning, budgeting, and scheduling had the FI at 65.38%. Scope variations ranked second highest in frequency (FI of 64.52%). Notably, both delay factors were related to owner or agency, i.e. owner representative. Late material delivery (FI of 60.86%) occurred more frequently than 44 other delay factors (Third FI rank). The least occurring delay factor in the pipeline construction in the oil and gas industry in Bahrain was changes in laws and regulations with an FI score of 37.85%.FAII ranking based on Equation (5) concurred with the RII and FI ranking results as inadequate project planning, budgeting, and scheduling had the highest FAII rank with an FAII score of 56.38%. Scope variations also recorded the second highest FAII score (FAII of 50.92%), both top two factors being related to the owner or owner representative. Late material delivery, which was an attribute of material related delay factor, ranked third highest in terms of FAII with a score of 48.69%. However, the factors that ranked from fourth up to seventh in FAII score show that the contractor had a major contribution. Those factors were: insufficient contractor’s manpower (or resources) with an FAII score (48.34%); lack of communication between client, consultant and contractor (47.04%); poor site management and supervision (46.76%); and inefficient and poor performance of contractors/subcontractor (FAII of 45.90%), respectively. Inefficiency of legal process recorded the lowest ranking FAII score (25.44%) of all delay causing factors, while changes in regulations ranked second lowest with FAII of 26.05% and insufficient laws on projects recoded third lowest with FAII of 26.60%. All lowest three factors were grouped under the statutory laws and regulations category. The fourth and fifth lowest ranking FAII scores were environmental protection pressure by stakeholders (27.30%) and damage to work by third party (26.69%). Both factors were related to the external factors group.
6. Risk Mapping Matrix
The risk mapping matrix was developed to classify each of the causing factors under specific risk zones as shown in Table (2). The classification was based on the mean values of importance (consequence) and frequency (likelihood). Any factor with a mean value, whether it was importance or frequency, laid between 1.00 and 1.80, would be considered very low risk and fall under the A zone. If the delay factor was laid between 1.81 and 2.60, it would be considered low risk and fall under the B zone. However, if the delay factor laid between 2.61 and 3.40, it would be considered moderate risk and fall under the C zone. Moreover, if the delay factor laid between 3.41 and 4.20, it would be considered high risk and fall under the D zone. Finally, if the delay factor laid between 4.21 and 5.00, it would be considered very high risk and fall under the E zone.For instance, the importance mean value for factor 2, which is inadequate project planning, budgeting and scheduling, was 4.31 and the frequency mean value was 3.30. This factor had a very high risk value in terms of importance and moderate risk value in terms of frequency. As a result, the factor was laid on the D zone. Table (4) indicated all the 47 delaying factors along with their importance and frequency means. Nineteen high risk critical delay factors, that were singled out based on the KPI data obtained from the Risk Assessment Matrix of XYZ Company, were identified as shown in Figure (3). Those factors needed more attention from the management to mitigate the risks associated with them.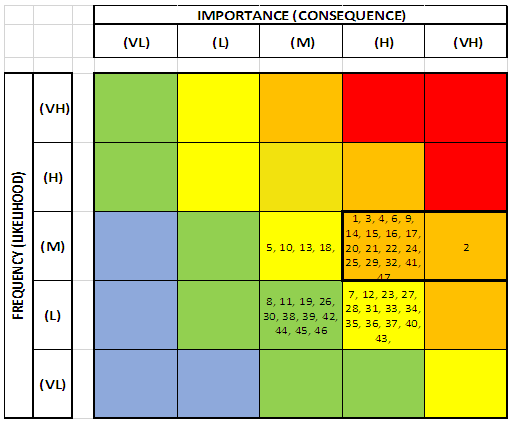 | Figure (3). The Risk Mapping Matrix Indicating the Zones of All the 47 Delay Causing Factors |
The comparison is summarized in Table (4)Table (4). Means, RII, FI, and FAII of Delay Factors
 |
| |
|
7. Discussion
The Risk Mapping Matrix for the 47 critical delay factors indicated that there were no factors detected in the E zone (Red), which meant that there was no need for a specific attention to be addressed by the management in order to mitigate or reduce the risk. However, nineteen factors were laid in the D zone (Orange), which necessitated performing a suitable quantitative or qualitative risk analysis for the verification of the risk level by the asset management. At this level, facility management is required to institute suitable measures for reducing the risk. Moreover, facility management needs to inform promptly the higher authority levels such as senior management when they figure that the risk is irreducible to a lower category promptly. The risk can be managed by number of strategies, such as: avoidance, acceptance, monitor and prepare, mitigation, and transference. The main objective for the risk reduction is to avoid shifting the D zone level of risk to the more critical level, which is the E zone. As for the C zone (Yellow), which was comprised of seventeen delay factors, it demands that the asset management evaluates extra measures for reducing the risk, implementing the measures considered feasible and approving the ongoing operations. Eleven delay factors were found in the B zone (Green), which calls for the asset management to consider how feasible it is to institute measures to reduce risk. Finally, there were no factors found in the A zone (Blue), which basically implies the unnecessity for further studies or actions on the risk factors. Note that documentation is a necessity for all the risk levels which includes potential hazards, risk studies, and measures to reduce risks.The findings of this study established that inadequate project planning, budgeting, and scheduling; scope variation; late materials delivery; insufficient contractor’s manpower (or resources); and lack of communication between client, consultant and contractor were the main delay causing factors in the pipeline construction in the oil and gas industry in Bahrain. The previously mentioned delay factors were ranked the highest in terms of FAII, respectively. Moreover, they were considered as high risk delay factors since they were allocated in the D zone on the risk mapping matrix, which require especial attention by the management. It is important to be noted that most of the top ranked delay factors were related to owners or their representatives and contractors.
8. Conclusions and Recommendations
The study findings based on FAII rankings indicated that owner-related and contractors-related factors were ranked high due to their importance and frequency. Inadequate project planning, budgeting, and scheduling; scope variation; and late materials delivery were the top ranked factors which affected project duration and cost in pipeline construction projects within the oil and gas industry in Bahrain. The findings inspired various procedural recommendations towards addressing ways for risk mitigation of the top ranked high risk delay factors, which are mentioned below:1. Inadequate Project Planning, Budgeting, and SchedulingŸ Considering that the Government of Bahrain is the owner of projects concerning the construction of pipelines in the oil and gas industry, it is imperative that it incorporates planning, scheduling, and budgeting training for Bahraini nationals. In addition, there is need for integration of top-level expertise from other oil and gas countries to help in knowledge transfer and transfusion of management and administration skills.Ÿ There is a need for regular monitoring and mitigation of contractor and owner related factors especially those with high risk impact and frequency, such as inadequate project planning, budgeting and scheduling; scope variations; and late materials delivery. This requires the development of project data about the root triggers of the critical delay factors.2. Scope VariationScope variation is a major problem on projects, especially when the impact of changes on resources, budget and schedule are not fully understood by the stakeholders and the project team. If the initial project scope was clear and changes were carefully managed during the lifecycle of the project, then it will not be a major issue. In order to avoid scope variation and manage continues changing requirements of the project, an online software tool would be helpful for adding new changes and review them in real time.The problem lies in the project team expectation to deliver changes in original project scope within the same resources and time as the original scope.Five vital ways should be considered in order to keep control of the project:Ÿ Document the RequirementsAll the project stakeholders and users should be asked about their exact work requirements and expectations. Those requirements and expectations should be documented. All requirements should be prioritized and captured in a document that can be shared online with all concern parties.Ÿ Set up Change Control ProcessesIf a change is suggested, then it should be reviewed and approved or rejected by a designated party to incorporate it into the project plan if it is approved. A formal team meeting is not mandatory unless the changes are significant and need a thorough review. Ÿ Create a Clear Project ScheduleA project schedule results from knowing what the project will deliver; it should express all the requirements and the way they will be achieved, in the form of tasks and activities. After project schedule preparation, a contingency plan should be addressed to avoid any future delays. Ÿ Verify the Scope with the StakeholdersThe project requirements and schedule should be properly understood and discussed by the stakeholders to insure that all the expected elements are represented in the task list. However, it is useful to remind them with the impact of new changes in terms of time and payment. Ÿ Engage the Project TeamThe project team should be aware about the change control process and how it will affect them. However, any new project changes by the stakeholders must be approved through a formal process. This process should be explained and documented by the project team. 3. Late Materials DeliveryŸ Supplier Performance Measurement and EvaluationThe supplier performance measurement should be conducted through an appropriate system which will provide a general view about the suppliers’ evaluation and selection. The resulting recommendations should be addressed to the initial key suppliers in order to improve their delivery performance.Ÿ Projects and Supply Chain Department Cooperation and Feedback The communication between the projects and the supply chain departments should be enhanced in order to achieve a better delivery performance. This can be done by providing delivery performance feedback through regular meetings.Ÿ Contractors PenaltiesPenalties must be paid by the suppliers if the materials are not delivered on time and as per contract agreement. If there are no economic consequences, there will be no improvement in delivery precision.Ÿ Suppliers SelectionThe suppliers’ selection should be based on many important criteria, such as reputation of the supplier, the quality of service, and the suppliers’ commitment. By focusing on lower cost suppliers, the projects can be jeopardized and the consequences can be disastrous.
9. Limitations of Study
This study had several limitations which require further studies to be carried out given the uniqueness of the topic selected. Some of the key limitations of the study are:1) The model used in the study was not exhaustive. This is because the model developed within the study needs to be enhanced through introduction and testing of additional factors to replace the current ones which show insignificant effect on delay duration and cot,2) No diversification of study’s company data, thus need to use a wide range of companies in order to ascertain the results,3) Over-reliance on regression analysis could cause biasness, thus need to use other methods such as Fuzzy Theory and Neural Theory. This will enhance the accuracy of the results obtained from the study, and4) Limited number of experts used. Use of only two binary analysis experts may not have exhaustively covered the study requirements thus need to diversify through involvement of many researchers and experts.
ACKNOWLEDGEMENTS
I would like to express my sincere gratitude to my supervisor Professor Saad Suliman for the continuous support of my M.Sc. degree study and research, for his patience, motivation, enthusiasm, and immense knowledge. His guidance helped me in all the time of research and writing of this thesis. Beside my supervisor, I would like also to thank Mr Hassan Al Basri for his support, providing ideas, encouragement and insightful comments.Last but not the least, I would like to thank my family: my parents and my wife for encouraging me at the first place and supporting me spiritually throughout my life.
Acronyms
Key Performance Indicators (KPI); Frequency Adjusted Importance Index (FAII).
References
| [1] | Abedi, M., Fathi, M. S., & Mohammad, M. F. (2011). Effects of construction delays on construction project objectives. In proceedings of The First Iranian Students Scientific Conference in Malaysia, 9 and 10 Apr 2011, UPM, Malaysia. Retrieved from https://0x9.me/8VLFc. |
| [2] | Al-Momani, A.H. (2000). Construction delay: A quantitative analysis. International Journal of Project Management, 18(1), pp.51-59. doi: 10.1016/S0263-7863(98)00060-X. |
| [3] | Ayodele, E. O., & Alabi, O. M. (2011). Abandonment of construction projects in Nigeria: Causes and effects. Journal of Emerging Trends in Economics and Management Sciences, 2(2), pp.142-145. |
| [4] | Elhag, T. M. S., & Boussabaine, A. H. (1999). Evaluation of construction costs and time attributes. In Proceedings of the 15th ARCOM Conference, Vol. 2, 15-17 September, Liverpool John Moores University, pp. 473-80. |
| [5] | Ganiyu, B. O., & Zubairu, I. K. (2010). Project cost prediction model using principal component regression for public building projects in Nigeria. Journal of Building Performance, 1(1). |
| [6] | Gebrehiwet, T., & Luo, H. (2017). Analysis of delay impact on construction project based on RII and correlation coefficient: Empirical study. In proceedings of the Creative Construction Conference 2017, CCC 2017, 19-22 June 2017, Primosten, Croatia, pp.366-374. doi: 10.1016/j.proeng.2017.07.212. |
| [7] | Hogg, R.V., & Tanis, E.A. (2009). Probability and statistical inference, (8th Edition). Upper Saddle River, NJ: Prentice Hall. |
| [8] | Khoshgoftar, M., Bakar, A.H.A., & Osman, O. (2010). Causes of delays in Iranian construction projects. International Journal of Construction Management, 10(2), pp.53-69. doi: 10.1080/15623599.2010.10773144 100. |
| [9] | Mohammed, K. A., & Isah, A. D. (2012). Causes of delay in Nigeria construction industry. Interdisciplinary journal of contemporary research in business, 4(2), pp.785-794. |
| [10] | Naimi, M., Elhag, T., & Fenn, P. (2008). Delay and its consequences in construction of Iranian petrochemical plants. In proceedings of the International Conference on Multi-National Construction Projects “Securing high Performance through Cultural awareness and Dispute Avoidance”, Shanghai, China, November 21-23. Retrieved from http://www.irbnet.de/daten/iconda/CIB12183.pdf. |
| [11] | Orangi, P., & Wilson, (2011). Exploring delays in Victoria-Based Australian pipeline projects. In Proceedings of the Twelfth East Asia-Pacific Conference on Structural Engineering and Construction (EASEC), 26-28 January, Hong Kong, pp. 874–881. doi: 10.1016/j.proeng.2011.07.11. |
| [12] | Salama, M., El Hamid, M. A., & Keogh, B. (2008, September). Investigating the Causes of Delay within Oil and Gas Projects in the UAE. In 24th Annual ARCOM Conference (pp. 1-3). |
| [13] | Shehu A, A., Masrom, A. N., & Mohammed, M. (2016). The effects of construction delays on the contractor's reputation in Nigeria - The perception of professionals. Journal of Multidisciplinary Engineering and Science Technology, 3, pp.4154-4160. |
| [14] | Van Thuyet, N., Ogunlana, S.O., & Dey, P. K. (2007). Risk management in oil and gas construction projects in Vietnam. International journal of energy sector management, 1(2), pp.175-194. |

 Abstract
 Reference
 Full-Text PDF
 Full-text HTML