-
Paper Information
- Next Paper
- Paper Submission
-
Journal Information
- About This Journal
- Editorial Board
- Current Issue
- Archive
- Author Guidelines
- Contact Us
International Journal of Construction Engineering and Management
p-ISSN: 2326-1080 e-ISSN: 2326-1102
2019; 8(1): 1-6
doi:10.5923/j.ijcem.20190801.01

Methodology to Reduce Construction Project Schedule Duration Using Activity Aggregation
 Abstract
 Reference
 Full-Text PDF
 Full-text HTML
Darshan Parsuvanathan Chandrasekar, Saravana Kumar
Department of Civil Engineering, S. A. Engineering College, Chennai, India
Correspondence to: Darshan Parsuvanathan Chandrasekar, Department of Civil Engineering, S. A. Engineering College, Chennai, India.
| Email: |  |
Copyright © 2019 The Author(s). Published by Scientific & Academic Publishing.
This work is licensed under the Creative Commons Attribution International License (CC BY).
http://creativecommons.org/licenses/by/4.0/

A methodology to reduce schedule duration of a typically large-scale construction project is proposed and demonstrated. It involves aggregation of simultaneous and repetitive activities identified in a project schedule that was already prepared using a traditional sequencing method. Labor re-allocation and time duration of aggregated activities are used to devise a model for calculating savings in schedule duration. The proposed method is applied to a dry dock construction project. There is a significant reduction in the schedule duration tested for both labor comfort and cost comfort scenarios. The savings in labor comfort case is marginally greater than the savings in cost comfort case. The efficiency of the proposed method seems to depend on the quality of the original schedule upon which the method is applied. It is also found that the frequency of repeated activities within any given management unit, and the variance in duration of those activities, play a key role in choosing and prioritizing activities identified for aggregation purposes.
Keywords: Activity aggregation, Schedule duration reduction, Schedule optimization, Simultaneous activities, Repetitive activities
Cite this paper: Darshan Parsuvanathan Chandrasekar, Saravana Kumar, Methodology to Reduce Construction Project Schedule Duration Using Activity Aggregation, International Journal of Construction Engineering and Management , Vol. 8 No. 1, 2019, pp. 1-6. doi: 10.5923/j.ijcem.20190801.01.
Article Outline
1. Introduction
- Construction costs are expected to increase globally by around 3 to 4% every year, which is significant [1]. Construction industry is one of those well-established industries, and yet to fully leverage innovations in processes involved, especially, in project management and related procedures [2]. One of the important aspects of such construction processes is project duration. The latter entity can influence bidding cost and potentially decrease owner-contractor disputes during or after construction [3].In general, schedule of a project is prepared by giving priority to ease of management of resources such as materials, labor and equipment available. This is applicable irrespective of cost comfort and labor comfort approaches to scheduling. It is referred to as ‘traditional method’ in this paper. Such scheduling practice need not necessarily consider the influence of activities that occur simultaneously and/or occur repeatedly. In our study, we explore and demonstrate that inclusion of aggregation of such activities can lead to reduction in project duration. The method proposed is based on identification of activities on a higher hierarchy level, segregation of simultaneous activities, and prioritization of activities based on characteristics such as frequency, individual duration and its variance. A complete construction schedule of a dry dock was used to evaluate the proposed aggregation method. The dry dock is being constructed in an Indian coastal city. The projected cost of the dry dock is 220 million USD. There are several software packages available for applying and testing the proposed method [4-7]. Microsoft Project was used in this study as it provided satisfactory control over manipulating related variables.
1.1. Structure of Presentation
- The structure of this paper is as follows: first, a review of literature is presented. Then, proposed method is explained in detail. This is followed by an analysis of results obtained when the proposed method is applied to dry dock construction scheduling procedure. Finally, conclusions and areas where this method can be further improved are presented.
2. Literature Review
- There is an increasing number of infrastructure projects, costing in the order of several million US dollars, in both developed and developing countries [8, 9]. The complexity involved in project management is well documented [10, 11]. The challenges in reducing cost and duration had been well-addressed by researchers in this field [12, 13].
2.1. Project Duration
- There had been several innovative efforts in reducing the project duration. Notable works are by Bogus et al [14] and Srour et al [15]. Bogus et al conducted one of the earliest research works primarily focusing on overlapping sequential activities. Our method focusses on aggregation of activities. Srour et al proposed a methodology for scheduling, also considering overlapping, however, giving more emphasis based on dependency information [15]. We too rely on checking dependency information, even more in-depth, at a very microscopic level. Their studies had some limitations though. First, the efficiency of their method depends on contractor’s knowledge and expertise on overlapping and its consequences, which cannot be always relied upon. Our proposed method does not warrant such pre-expertise. In addition, their works deal only with trade-off between time and cost. In our method, we keep the cost as constant and focus on reducing the time, which will eventually reduce cost of the overall project too. Furthermore, large scale or mega projects will have higher frequency of activities with natural precedence relationships, which were not considered in those studies. In our study, we duly incorporate such factors.
2.2. CPM’s Effect on Proposed Method
- The proposed method is to be applied on an existing schedule already prepared using a traditional method, such as involving use of techniques like Critical Path Method (CPM). Therefore, any inefficiency in the existing schedule may affect the performance of our method. Because, disadvantages and occasional inefficiencies in traditional scheduling principles, including CPM, are well known [16] [17]. For instance, if the duration is overly estimated in an existing schedule, the difference between the project durations of existing and proposed may not be a reliable estimate. If the existing schedule is optimized to its best, then the effect of our proposed method will be truly reflected.
2.3. Role of Repeated Activities
- There is scope for reducing schedule duration in a project if it has repeated activities. This had been addressed using qualitative approach [18]. The relation between discontinuous execution of repeated activities and the drop in productivity had also been researched [19]. Our method relies on such presence of repeated activities.
3. Methodology
- The method proposed to reduce schedule duration, fundamentally involves re-allocation among activities, satisfying the following requirements: Ÿ The activities should occur simultaneously. Ÿ The activities should be of same nature, for example, either concreting or piling and so on. Ÿ They should not have same duration compared with each other. More the variance in duration of activities, better they would be suitable for aggregation. Application of the proposed method for a large scale project involving hundreds of activities is described later. Here, the methodology will be explained using a simple case first, as shown in the Figure. 1. The top-most row indicates time scale in days. Two cases are presented namely, ‘before aggregation’ and ‘after aggregation’. The ‘before’ case involves a traditional scheduling method with no aggregation of any kind. The ‘after’ case is what is proposed in this study. Each case involves three activities A1, A2 and A3, consuming 5, 10 and 15 workers respectively. Corresponding durations of activities are 2, 6 and 10 days. The worker-day for each activity is presented inside the gray boxes extending along the time scale. The total worker-day amounts to 240 (30+60+150), in both cases.
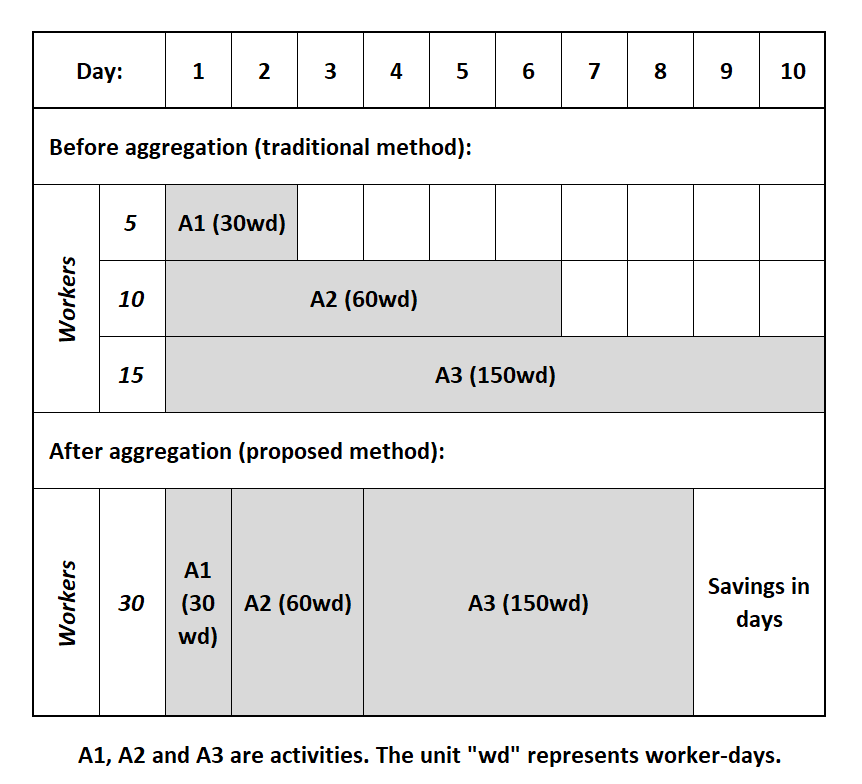 | Figure 1. Basic concept of aggregation - a simple sample case |
3.1. Model Formulation
- The formula used to derive the savings in schedule duration is given below:
 | (1) |
3.2. Aggregation Principles
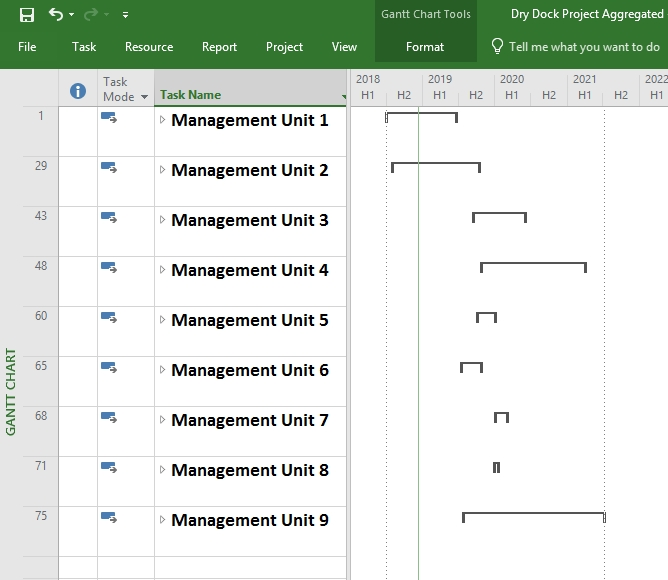
- In a typical project scheduling environment using packages like Microsoft Project, it is necessary to form summary tasks and management units as applicable. Such grouping is explained using a basic example as shown in Figure. 2. A traditional non-aggregated scheduling process will essentially have so called “basic tasks” and “summary tasks” only. In the aggregation process proposed, a higher grouping named “management unit” is required apart from the basic and summary tasks, as shown in Figure. 2. A management unit is a set of inter-related basic tasks while a summary task is a set of tasks within those basic tasks. The sequence of execution comprises of several management units. In Figure. 2, a summary task in management unit-2 is shown to include three basic tasks; all related to one common objective, which is, the pile cap. Each management unit deals with a unique set of basic tasks as well as summary tasks.
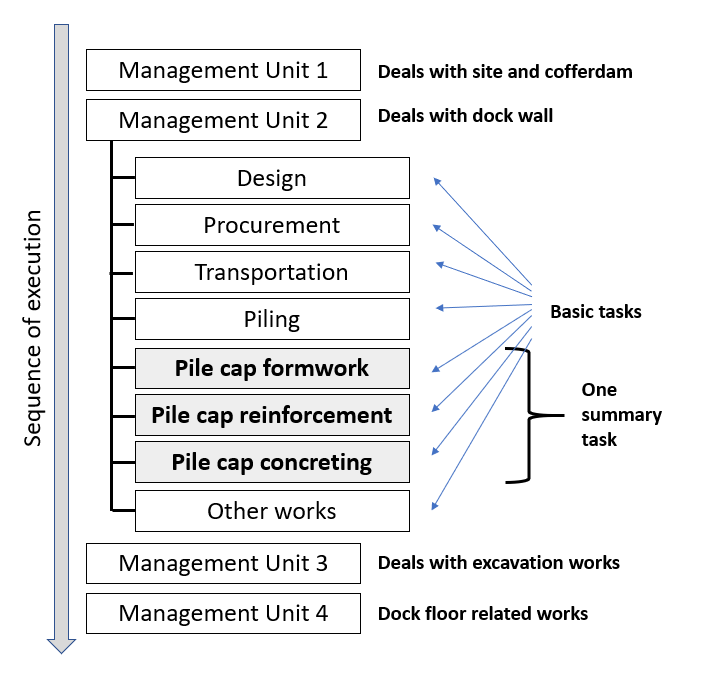 | Figure 2. Management units and summary tasks |
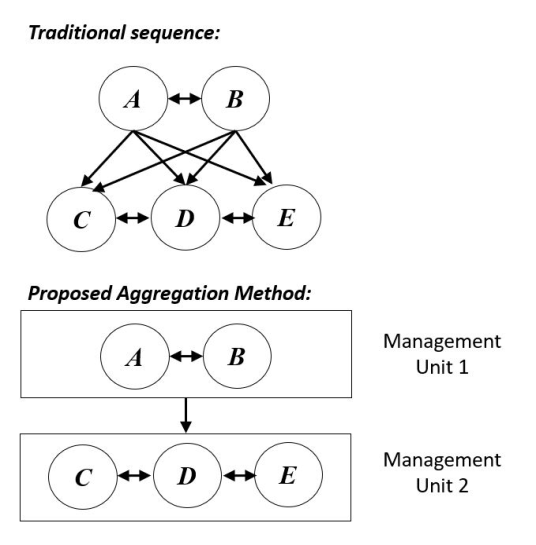 | Figure 3. Simplification of precedence relationships |
4. Results and Analysis
- Method proposed was applied to a large scale scheduling process for a dry dock construction involving around 150 activities spread over 1300 days with an overall cost of around 220 million USD. The equation (1) was used to determine the reduction in schedule duration. This was done after aggregating suitable activities as explained earlier. Before describing the results obtained, a note on criteria for selection of activities is briefly explained.
4.1. Frequency of Activities and Variation in Durations
- In the dry dock case considered, activities had a frequency range of occurrence from 1 to 6. Higher the frequency, better the chance of higher savings after aggregation. However, if repeated activities have no variation in their durations, no savings will occur whether they are done parallelly or serially. Therefore, both the frequency of activity and the variation in duration are required to be considered in choosing candidate activities for aggregation. This is further explained using Figure. 4.Activities of different types are in the horizontal axis (M4T1, M2T1, and others, in Figure. 4). There are two vertical axes; frequency of an activity on the left side and standard deviation in activity’s duration on the right side. Bars represent frequency and line represents standard deviation, across activities. No sorting is applied for any variable here.
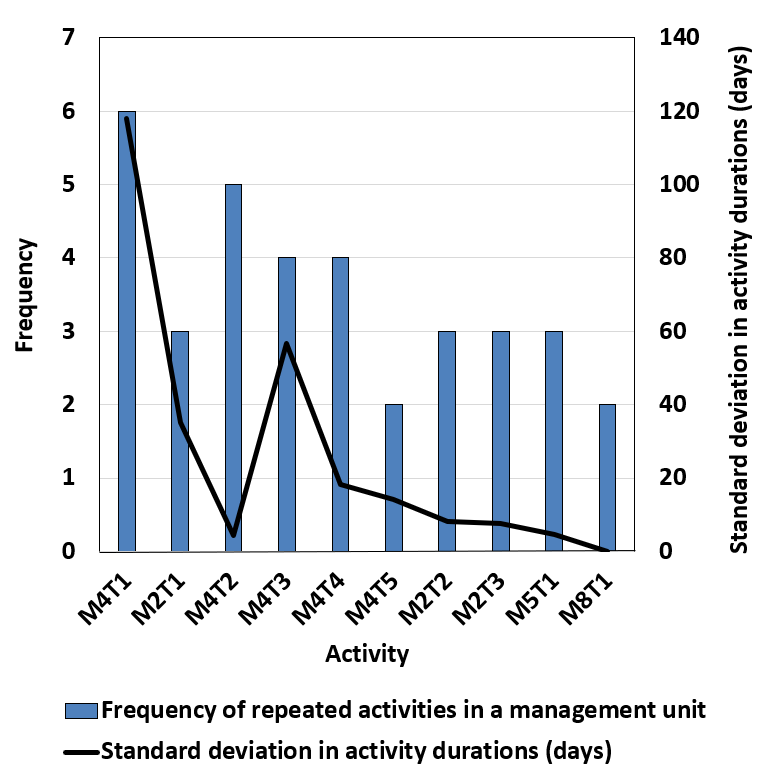 | Figure 4. Effect of activity frequency and duration variation |
4.2. Analysis of Project Duration Savings
- After careful consideration of simultaneously occurring activities, their nature and type, frequency of occurrence and duration of individual activities, equation (1) was applied for the entire project schedule. The results are presented in Figure. 5. Two scheduling cases were considered: labor comfort and cost comfort. This is to make sure our method works in both standard types of scheduling.
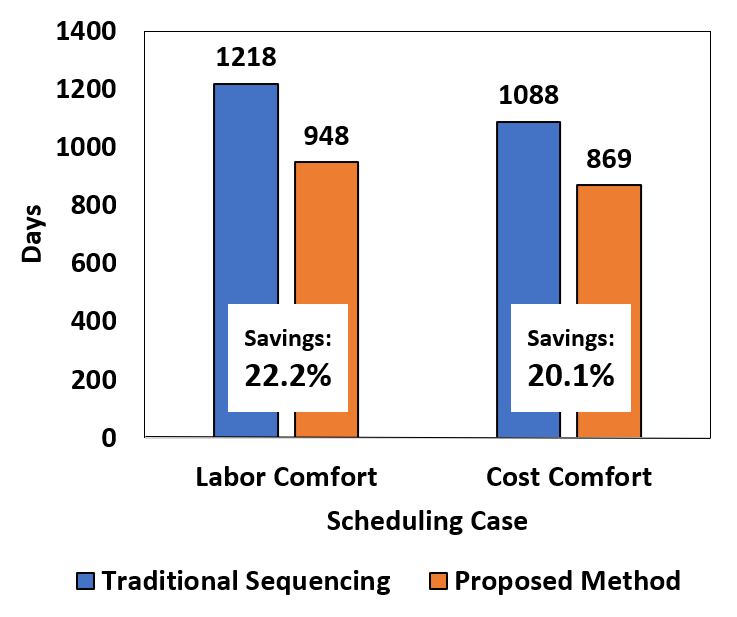 | Figure 5. Savings in schedule duration |
4.3. A Note on Quality of Schedule used for Aggregation
- It is known that critical path method (CPM) has its own disadvantages and might lead to an imperfect schedule [16]. For instance, while using CPM, excessive lag durations that accompany some activities might lead to an inefficient schedule. Furthermore, a CPM schedule which is primarily resource-oriented could also readily cause some inefficiency (as we focus on reducing the time than resources required in our method). Therefore, care should be taken to ensure the quality of the schedule for which the method is to be applied.There can be situations where cumulative reduction of schedule duration related exclusively to aggregated activities may be higher than the reduction in project schedule duration. Because, only those activities present in the critical path can affect the project duration. Within the days saved, a comparison between the savings and cumulative reduction in aggregated activities can be shown as in Figure. 6.
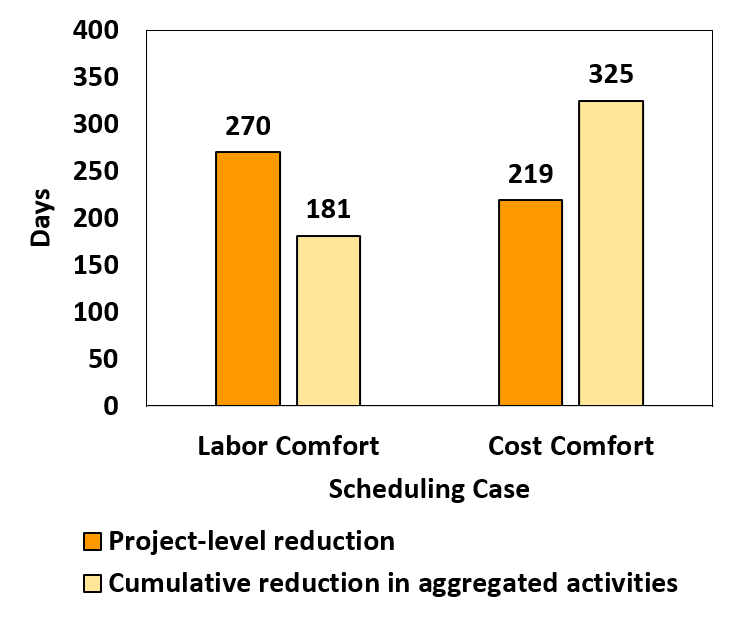 | Figure 6. Effect of the quality of schedule used |
 | Figure 7. Effect of longer management units |
5. Conclusions
- A method to reduce the duration of schedule was presented. The model proposed was applied for a large-scale high-cost dry dock construction project. The method involves aggregation of activities that are repetitive and occur simultaneously. Two different approaches to scheduling were considered for evaluation, namely, labor comfort and cost comfort. This was to ensure that the influence of these approaches on the hierarchy of execution of activities has been taken into account explicitly. There was a reduction of 22.2% and 20.1% in project schedule durations for labor comfort and cost comfort scenarios respectively. There is an added advantage of this method. In both such scenarios, there is a notable reduction in number of activity sequences. Such reduction can result in schedules that are less prone to errors. Aggregation of activities can also eliminate the issues rising from discontinuous execution of repetitive works. Though the data used was from a typical dry dock construction project, the method can be applied to any large-scale project environments. However, applicability of the method in small scale projects is yet to be explored. Furthermore, our study is based on the assumption that the project involves simultaneous and repetitive activities, a strong management and monitoring practice and the presence of continued availability of equipment. Effect of variations in these variables needs to be investigated and hence recommended for future research.It is also possible to apply the methodology demonstrated here, to reduce the cost of the project, keeping the time constant (which could be a separate future exercise).