-
Paper Information
- Paper Submission
-
Journal Information
- About This Journal
- Editorial Board
- Current Issue
- Archive
- Author Guidelines
- Contact Us
International Journal of Construction Engineering and Management
p-ISSN: 2326-1080 e-ISSN: 2326-1102
2017; 6(5): 209-214
doi:10.5923/j.ijcem.20170605.03

Assessment of Compensation for Delay Claims in Case of Partial Disruption in Work
 Abstract
 Reference
 Full-Text PDF
 Full-text HTML
1Ph.D. Student, Osmania University, Hyderabad, India
2Vice Chancellor, JNTU, Kakinada, A.P. India
Correspondence to: Sridhar M., Ph.D. Student, Osmania University, Hyderabad, India.
| Email: |  |
Copyright © 2017 Scientific & Academic Publishing. All Rights Reserved.
This work is licensed under the Creative Commons Attribution International License (CC BY).
http://creativecommons.org/licenses/by/4.0/

Because of delays in project execution due to reasons attributable to project owners, the contractors lodge delay claims for prolongation of work. In case of partial disruption in work, the delay claims are framed by contractors based on actual work turnover achieved which methodology is challenged and disputed by project owners. The arbitrators while judging the fair compensation for delay claims in such cases make an assessment of reasonable turn over using their experience and subjective knowledge. The qualitative factors which influence the turnover have been identified for making an assessment of the turn over under given site specific conditions. For studying the influence of these qualitative factors structured interviews were conducted with the experts through questionnaires. The opinions gathered from the experts have been analysed following Fuzzy Delphi Methodology (FDM). The factors which have considerable and significant influence on the turnover have been listed. Based on the findings, a methodology is suggested for assessment of compensation for delay claims in these cases.
Keywords: Delay claims, Turn over, Overheads, Arbitrators, Expert opinions, Productivity
Cite this paper: Sridhar M., Kumar VSS, Assessment of Compensation for Delay Claims in Case of Partial Disruption in Work, International Journal of Construction Engineering and Management , Vol. 6 No. 5, 2017, pp. 209-214. doi: 10.5923/j.ijcem.20170605.03.
Article Outline
1. Introduction
- Indian construction industry is riddled with many litigations pertaining to delay claims. Because of delays in project execution caused due to reasons attributable to project owners like delays in handing over work fronts, issue of drawings, delays in decisions, delayed payments and approvals etc., the contractors lodge claims seeking compensation for delays. Such delay claims are framed for the periods of delay as actual costs incurred under various heads which could not be recovered because of drop in productivity. Typically, the heads on which delay claims are framed include but not limited to the following.1. Machinery and equipment2. Manpower (Technical, non-technical labour)3. Other resources deployed4. Site Overheads5. General office overheads6. Head office overheads7. Interest, Finance charges8. Charges on Insurance, Bank Guarantees9. Loss of ProfitThe site / field office over heads for a particular project are easily assessable as they are project based with good records keeping and documentation of accounts. The head office overheads (HOOH) are not easily assessable as they are as a whole for head office and hence allocation of them to a single project is complex. There are numerous formulae available for assessing HOOH amongst which Hudson's formula, Emden’s formula and Eichleay formula are popular. The delay claims are lodged as compensation for the losses towards non-recovered costs incurred under various heads as above. The contractors do include such overheads and establishment costs in bids which are intended to be recovered from the work turn over that is monthly billing. When there is total disruption in work for certain periods, there will not be any work out turn. In such cases the quantification of claims is done as actual costs incurred under above heads for the periods of work disruption. Such claims are treated as compensation for losses by way of non recovery of costs incurred due to loss in productivity.In many cases the disruption in work is only partial wherein only some portion of the work is hindered. In such cases the delay claims are framed based on lost productivity. The financial turnover as monthly billed value of the work is taken as a metric for productivity. Thus lost productivity is computed as the difference of originally planned turnover in the month to the turnover actually achieved. The ratio of lost productivity to the planned turnover is termed as underutilization factor. In cases of partial disruption in work, the delay claims are quantified by multiplying the costs incurred under various heads with this factor. The delay claims lodged by contractors with this methodology are often disputed by project owners. The project owners dispute the quantification arguing that the turn over achieved could be more citing contractor’s inefficiency. On the other hand the contractors argue that the turn over achieved is maximum possible under the given site conditions. The arbitrators as judges have challenging task in these cases in assessing the reasonable compensation for the delay claims using their subjective knowledge and expertise. For assessing fair compensation for delay claims in cases of partial disruptions, the turn over that can be reasonably achieved under given site conditions needs to be assessed. The factors that influence the work turn over are qualitative in nature the effect of which can’t be easily quantified. Deterministic mathematical models are not suitable for solving such types of problems where fuzzy set theory and system modelling based on approximate reasoning are found useful. Further the modeling based on human perception and judgment offer solutions to such type of problems.
2. Research Methodology
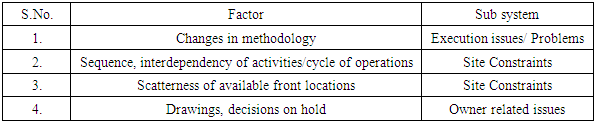
- Numerous studies are conducted on the delay causes and their prevalence, significance concerning project execution. Around thirty such delay causes/factors were shortlisted which have a bearing on the work turn over. From these about fifteen qualitative factors were identified by consulting the experts which influence the work out turn of contractor's resources and thereby the financial turnover. The factors do have varying influence which is qualitative in nature. These factors are categorized in to three distinct subheads. Those factors which are related to site are categorized as 'Site Constraints'. Again the factors which are influenced by Project owner are grouped in 'Owner Related issues' and the problems related to and specific to work execution are taken in 'Execution issues / Problems'I. Site Constraints 1. Quantum of availability of fronts 2. Sequence interdependency of activities/ cycle of operations3. Scatterness of available front locations4. Shifting of site locations5. Constraints on deployment of resources II. Owner Related Issues 1. Drawings, decisions on hold2. Delay in payments3. Delays in sanctions, clearances and approvals4. Non-resolution of issues in time 5. Local problems, issuesIII. Execution issues/ Problems1. Restrictions, constraints in execution (conditions, timings, weather)2. Large scale variations/ deviations3. Changes in methodology4. Frequent disruption in work5. Miscellaneous management issues, coordination It is proposed to study the influence of the above qualitative factors by obtaining opinions from a group of experts who will judge such influence of these factors on work turn over using their subjective knowledge. Such opinions are to be collected from the experts by conducting structured interviews which opinions can be subjected to analysis applying Fuzzy Delphi methodology.
2.1. Structured Interviews
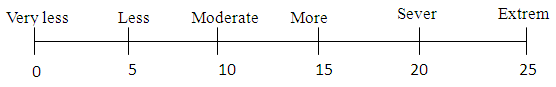
- For studying the influence of these qualitative factors, about 20 experts have been selected who are experienced and involved in deciding the delay claims in arbitration tribunals as arbitrators. These senior persons as experts have experience in judging the issues and disputes related to delay claims using their subjective knowledge. It is proposed to collect the expert opinions from these experts through structured interviews by well-structured questionnaire. The Fifteen Qualitative factors are listed with a brief back ground and introduction of issue as a preamble. A brief note is given narrating the qualitative factors. The structured interviews conducted for the experts opinions, consist two parts of questionnaire. In the first part the experts are asked to rate the importance of the listed qualitative factors on affecting the turnover, on a scale of 1 to 5 as shown below.1. Very low important2. Low important3. Medium important4. High important5. Very high importantIn the second part, the experts were asked to judge the effect of the qualitative factors on turnover in three opinions normal, minimum and maximum effect as they judge. First one is the normal, optimum effects which as experts feel most likely. Again the maximum and minimum effect of variables on the turnover as judged by the experts is asked. For judging the effect, semantic variable scale is provided as exhibited in Fig.1 for easy reference. Thus if the qualitative effect is judged “moderate" a score of 10 or if it is "severe” then a score 20 can be taken as given in scale. Accordingly, experts were asked to quantify the qualitative effect.
 | Figure 1. Semantic Scale |
2.2. Fuzzy Delphi Method
- In this method, the experts use their individual competency and subjectivity in estimating the effect of the fifteen qualitative factors on the turn over as a three time estimate. This is the very reason why the use of fuzzy concepts is proposed for application of Fuzzy Delphi Method. In Delphi method the experts opinions are subjected to statistical analysis for convergence but in Fuzzy Delphi method fuzzy concepts are used for convergence. The three time estimates considered as T.F.N.s are taken as a sheaf for carrying out analysis of experts opinions. The Steps in F.D.M are depicted as follows:1. The sheaf of expert opinions is (A1(i), B1(i), C1(i)). Where i indicates the index attached to expert and 1 indicates this is first phase of the forecasting process.2. These responses from 'n' experts form a sheaf(Al(i), B l(i), Cl(i)), i=1,2,......n.The mean of this T.F.N. sheaf is then computed (A1m, B1m, C1m)3. For each expert the divergence is computed as follows{A1m – A1(i), B1m – B1(i), C1m - C1(i)}Where these divergence numbers can be positive, null or negative. This information is then sent to each individual expert.4. Each Expert now gives a new T.F.N.(A2(i), B2(i), C2(i)) and the process, starting with phase 2 is repeated.5. A study of partial group opinions is realized using the distance between the T.F.N. and the decomposition of the dissemblance relations in the maximal sub-relations of similarity.6. Distances and Grouping of similarities: The Normalized distances between two T.F.N.s are calculated with left and right distances taking two values. 7. The normalized distance between two T.F.N.s is given by
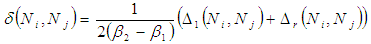 Ni,Nj are respective T.F.N.s given by experts i, j and ∆l,∆r is left and right distances. β2, β1 are arbitrary values at right and left respectively such that 0 ≤ δ ≤ 1.8. Again for A = [a1, a2], B = [b1, b2]; ∆l (A,B) left distance = |a1, b1| Right distance ∆r = | a2, b2|; For T.F.N.s it is (X1+ 2Y1+Z1) / 29. The distances between Fuzzy numbers and similarity of experts opinions with in a permissible range of δ (Ni,Nj) are to be assessed and grouped in matrix form. The similarity of group of experts opinions are also to be exhibited graphically.
3. Presentation of Results and Analysis
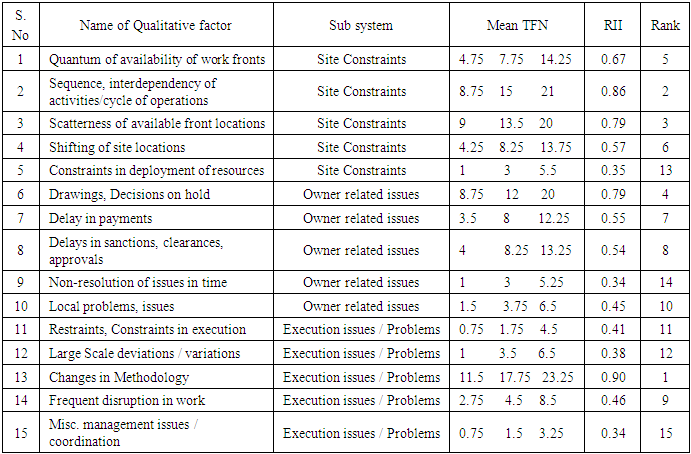
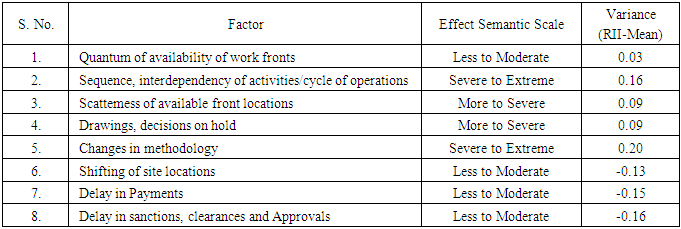
- The experts opinions as a set of three numbers quantified as per semantic scale for each qualitative factor are taken as T.F.N.s for application of F.D.M. Thus for each of fifteen qualitative factors the sheaf of experts opinions are tabulated for carrying out analysis following the steps of F.D.M. For each qualitative factor the mean of T.F.N., Am and the divergence of expert opinions with mean are calculated and tabulated. The normalized distances between the experts opinions (T.F.N.s) are computed for each of qualitative factors as per F.D.M. The similarity of groupings of experts has been made with an allowable range in the form of matrix and tabulated along with graphical representations. Since there is good convergence observed with around 75% experts expressing similarity in opinions, repetition of process was not considered.Based on the importance of the qualitative factors rated by experts, the Relative importance index R.I.I. values are calculated and tabulated in Table 3.1. Relative Importance Index (R.I.I.) = ∑ W / A x NFor each variable (Say for variable i) W = W1 N1 + W2 N2 + W3N3 + …W5N5W1, W2, W3, W5 are respective weightage of importanceN1, N2, N3, N4, N5 are No. of responses for respective importance factor.For each of the fifteen qualitative factors the experts opinions as triplet were considered as T.F.N.s and tabulated for analysis. Each expert is given a code number. Based on the values of T.F.N.s tabulated, the mean of T.F.N.s are calculated for each of the qualitative factor, which are exhibited in Table 3.1 together with R.I.I. values. Based on R.I.I. values, the rank is also assigned as can be seen from Table 3.1. As can be seen from this table, for seven qualitative factors with ranks 9 to 15 the minimum and normal values of mean T.F.N.s are less than 5. Again the maximum T.F.N. value for these factors is in range of 5 to 10. From the semantic scale it indicates that the significance of these seven factors on turnover is less. Again for comparison, the R.I.I. value for these seven qualitative factors is less than 0.5. Thus among 15 qualitative factors, only for about eight factors the experts have opined that their effect is significant. Thus the eight qualitative factors which have significant effect on work turn over, are listed in Table 3.2. The influence of the factors by converting the mean T.F.N. value in to semantic scale are exhibited in Table 3.2. The mean of R.I.I. is calculated and the difference of RI.I. with the mean for each factor as variance is calculated and exhibited in this table.
|
|
|
|
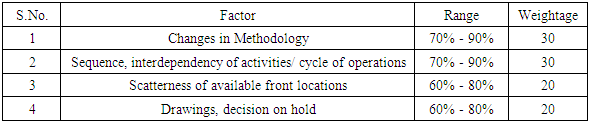
4. Conclusions
- For assessing a fair compensation in case of partial disruption in work, the arbitrators use their expertise, experience. While making the best judgment they keep in mind the influence of the qualitative factors prevailing at site for the particular instance of case. From this study the factors that have significant and considerable effect on the turn over as a measure of productivity have been identified. The quantification of the qualitative effects of these factors on the turnover have been studied under given site circumstances. Based on the above findings, a methodology is suggested for quantifying the effect of the above qualitative factors. By assigning the relative weightage to the factors out of 100 and considering the severity of the variable / factor in a particular case, the methodology consists of computing weighted average to assess the underutilization factor as a measure of lost productivity. The fair compensation can be worked out based on this factor of underutilization so computed. In this research work, an attempt has been made to convert the expertise, subjective analysis based on experience of experts into formal methodology. This is applicable to such cases only if the four qualitative factors listed in Table 3.4 have the influence of some scale. Otherwise the computation of weighted average gives misleading results. The methodology is based on reasonable assessment following the subjectivity which can’t be compared with results proved by exactitude of deterministic mathematical models.