-
Paper Information
- Previous Paper
- Paper Submission
-
Journal Information
- About This Journal
- Editorial Board
- Current Issue
- Archive
- Author Guidelines
- Contact Us
International Journal of Construction Engineering and Management
p-ISSN: 2326-1080 e-ISSN: 2326-1102
2017; 6(5): 197-208
doi:10.5923/j.ijcem.20170605.02

Variations on Forecasted Construction Cash Flows of Building Projects: A Structural Equation Modelling (SEM) Approach
 Abstract
 Reference
 Full-Text PDF
 Full-text HTML
Kimata N. Malekela1, Juma Mohamed1, Stanslaus K. Ntiyakunze2, Musa I. Mgwatu1
1College of Engineering and Technology, University of Dar es Salaam, Dar es Salaam, Tanzania
2School of Architecture, Construction Economics and Management, Ardhi University, Dar es Salaam, Tanzania
Correspondence to: Kimata N. Malekela, College of Engineering and Technology, University of Dar es Salaam, Dar es Salaam, Tanzania.
| Email: |  |
Copyright © 2017 Scientific & Academic Publishing. All Rights Reserved.
This work is licensed under the Creative Commons Attribution International License (CC BY).
http://creativecommons.org/licenses/by/4.0/

There are significant variations between the forecasted and the actual construction cash flows in execution of construction projects due to risk factors inherent in those projects. These risk factors have relationships with variations that occur on forecasted construction cash flows. This research is therefore aimed to analyze the relationships between variations on forecasted construction cash flows and the significant risk factors involved in causing those variations on forecasted construction cash flows in building projects in Dar es Salaam, Tanzania. Also, this study identifies those significant risk factors and formulates a model for analyzing the relationships. This paper reports part of an on-going research concerned with modelling the construction cash flows. A questionnaire survey was administered to different building contractors based in Dar es Salaam, Tanzania. The primary data are mainly analyzed using structural equation modelling (SEM) specifically AMOS software, but statistical package for social sciences (SPSS) version 20 was used for factor reduction in identifying the significant risk factors (analytical variables). The developed model for analyzing the relationships is concluded to be good basing on overall model fit indices which appear quite good (RMSEA = 0.066 < 0.1, CFI = 0.939 and GFI = 0.710 (belong to the range of 0 to 1)). Also, the χ2 test yields a value of 157.824 with 71 degrees of freedom were found to be significant at 0.01. Furthermore, the study found that there are significant causal relationships between identified significant risk factors and variations on forecasted construction cash flows related to substructure, superstructure, finishings and services installations. Additionally, all variations that occur on forecasted construction cash flows for substructure, superstructure, finishing and services installations are found to be positively correlated to each other in executing building projects. The identified significant risk factors are errors in project documents (Bills of Quantities), consultants’ lack of experience and technical skills, poor communication among project participants, unethical practices to consultants, different meanings of specifications, design errors, incomplete information at tender stage and poor/incomplete design. It is therefore recommended that stakeholders in building industry should involve the strategies that can minimize the variations caused by identified significant risk factors on forecasted construction cash flows in execution of building projects. Also, contributing trends of the identified significant risk factors in causing variations on forecasted construction cash flows based on detailed elements of buildings should be established from historical data using contract documents for further modelling.
Keywords: Construction cash flows, Variations, Risk factors, Structural Equation Modelling, Building projects, Tanzania
Cite this paper: Kimata N. Malekela, Juma Mohamed, Stanslaus K. Ntiyakunze, Musa I. Mgwatu, Variations on Forecasted Construction Cash Flows of Building Projects: A Structural Equation Modelling (SEM) Approach, International Journal of Construction Engineering and Management , Vol. 6 No. 5, 2017, pp. 197-208. doi: 10.5923/j.ijcem.20170605.02.
Article Outline
1. Introduction
- Normally, variations between the actual and forecasted cash flows in construction projects are caused by risk factors inherent in those projects [13]. Hence, the existence of those risks makes very difficult to attain an accurate forecast of cash flows in construction projects [27]. Also, it has been revealed that there are large variations happened on forecasted construction cash flows (FCCFs) in most of construction projects due to the risks involved in implementing those projects [21, 23, 24, 27]. In addition, over the past some decades, the issues related to identification of the risk factors and associated variations were ignored by the majority of the developed techniques and literature on construction cash flow forecasting [15, 24]. This situation makes the construction projects to continue experiencing large variations on FCCFs which sometimes disturb the budget of the client [15]. These variations occur in all forms of the project cash flows (i.e. monthly cash flow, staged cash flow and Turnkey cash flow) during execution of the construction projects [8, 13, 28]. According to [13], the risk factors cause variations on forecasted construction cash flows related to various parts of building projects such as substructure, superstructure, finishings and services installations. As well these risk factors may cause cost overruns and delays in construction projects. For instance in Tanzania, according to [5, 12, 19, 20], cost performance is poor in most of construction projects and they are completed with many cost variations compared to their initial budgets. This indicates that risk factors have relationships with variations that occur on forecasted construction cash flows for various works. Basing on various sources (includes [7, 13, 15, 24, 25]) indicate that the empirical data related to the relationships between variations on positive FCCFs based on various work sections and the risk factors causing those variations in building projects are yet to be investigated. Therefore, this study analyzes the relationships between variations on forecasted construction cash flows and the significant risk factors involved in causing those variations on forecasted construction cash flows in building projects in Dar es Salaam, Tanzania. Also, this study includes identifying those significant risk factors and formulating a structural model. As far as the objective of this paper is concerned, this study is delimited to positive construction cash flows derived from staged cash flows in building projects. The word building project means the building project that is procured under fixed price contract. Also, the word variations mean variations that occur on forecasted construction cash flows.
2. Literature Review
2.1. Introduction
- The variations that occur on forecasted construction cash flows of a construction projects deal specifically with the variations between forecasted and actual payments under a particular construction project. In this background, relevant studies on construction cash flows and their inherent risk factors, risk analysis and structural equation modelling are being reviewed.
2.2. Concept of Construction Cash Flows
- Various authors examined the definitions of construction cash flows, but the cash flow is principally the actual movement of money in and out of any business. For positive cash flow is the money flowing into a business while negative cash flow is the monies paid out of a business. In case of net cash flow is the difference between the positive and negative cash flows [21]. Therefore, the movement of money from client to contractor during execution of construction project is termed as positive construction cash flow. This type of construction cash flow is much preferred by client [15]. This study is also concentrated on positive construction cash flows in building projects. Moreover, according to [8, 22, 31], monies received by contractor in the form of staged cash flows or monthly cash flows which make positive cash flows in construction projects are commonly used. These monies can be in the form of payments to works performed, release of retention, settlements of final account, and settlements of profit lost due to termination of contract as exhausted from various materials such as [3, 18].
2.3. Payment Systems for Executing the Construction Project Cash Flows
- Based on broad literature review from various authors on payment systems for executing the construction cash flows; monthly progress payments (or monthly cash flow), staged payments (or staged cash flows) and Turnkey cash flow are the main payment systems which are used for paying contractor during execution of construction projects. According to [8, 28], monthly cash flow involves the periodic positive cash flows which are derived from funds received in the form of monthly payments to the construction works performed by contractor. While [2] pointed out that the staged cash flows constitute a single payment at the completion of the certain stage or element of construction works. Therefore, the funds are received by contractor in the form of staged payments to the performed work stage or element. For example, according to [13], these stages can be related to the completion of substructure, superstructure, finishings and services installations. For Turnkey cash flow is the rarely practiced payment system [28]. This payment system involves a single payment at the completion of the project [8].
2.4. Variations on Forecasted Construction Cash Flows
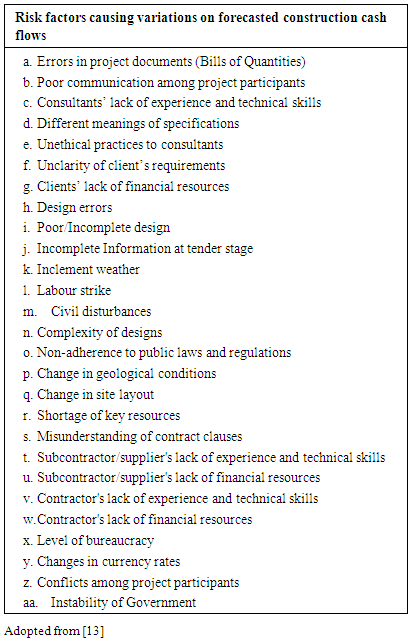
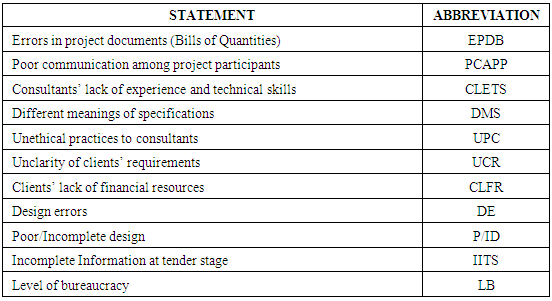
- In this study, variation is the difference between actual and forecasted construction cash flows in executing the construction project [13, 23]. These variations occur to most of contracts which lead to change the amount due to the contractor [23]. According to [10, 13], forecasted construction cash flow is the estimated/projected amounts of money to be received by contractor from client after completion of various work stages of the project. While actual construction cash flows are the actual amounts of money paid to contractor for the various completed work stages of the project after being valued at the site and certified. If the actual construction cash flow has exceeded the forecasted construction cash flow for the specific work stage performed, variation is positive and vice versa. These variations are caused by various risk factors during executing the construction projects [23]. Also, most of these risk factors affect time and quality aspects of the construction projects [31]. The list of risk factors causing variations on forecasted construction cash flows was adopted from the study of [13] as shown in Table 1. This list was also extracted from broad literature review based on different perceptions of the authors on cost issues and tested by pilot study as revealed by [13].
|
2.5. Relationship between Risk Factors and Variations on Construction Project Cash Flows
- Risks are the factors that can cause a project to fail in meeting its goals [26]. Basically, construction cash flow belongs to the cost objective which is one of the key project objectives. Therefore, in this study, risk factor means the factor that can cause variations on forecasted construction cash flows for a certain work part of building project as pointed out by [13]. As previously described, it indicates that there are the relationships between variations on forecasted construction cash flows and risk factors causing those variations during execution of construction projects (Figure 1). This is also supported by the study of [25]. Furthermore, the variations on forecasted construction cash flows based on various work stages have also the relationships to each other due to the nature of the building works.
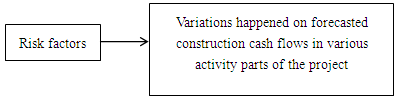 | Figure 1. Relationship between Variations on Forecasted Construction Cash Flows and Risk Factors |
2.6. Risk Analysis
- Since the risk factors causing variations on forecasted construction cash flows is the subject matter embedded in risk management. Therefore, these risk factors are required to be analysed in the way of managing risks during project implementation (i.e. risk analysis). According to [9], all risk factors are always analysed in terms of the potential impacts using either qualitative or quantitative tools. The potential impacts analysed from risk issues enable the setting of risk response planning actions to be done properly. Moreover, relationship analysis is recommended to be one of the tools for quantitative risk analysis. In this study, relationship analysis was used for quantifying the risk impacts.
2.7. Structural Equation Modelling (SEM)
- Principally, structural equation modeling (SEM) includes statistical techniques that allow complex relationships between one or more dependent variables and one or more independent variables [1], such as multiple regression analysis, confirmatory factor analysis and path analysis. SEM analyses the complex interactions among meaningful factors by estimating the direct and indirect interrelations among variable. Then, it confirms the underlying structure among observed and latent factors [4]. This is one of the tools for the risk analysis because it estimates the relationships among variables as pointed out by [9]. These are the main reasons which make this study to use SEM in confirming the risk factors affecting FCCFs, and establishing the relationships between those risk factors and variations on FCCFs in building projects.In SEM, observed variables are tangible variables for which data can be acquired and are shown via rectangles in drawn path diagrams, while latent factors are measured through the impacts of observed variables indicating them and are conventionally depicted with circles or ovals [4].Furthermore, SEM is an appropriate technique that can be used in construction management context for risk analysis, development of decision support systems, expert systems, and predictive models [17]. This reason makes SEM to be used in this study for analysing various relationships between variations and risk factors causing those variations on forecasted construction cash flows to various parts of buildings.
3. Methodology
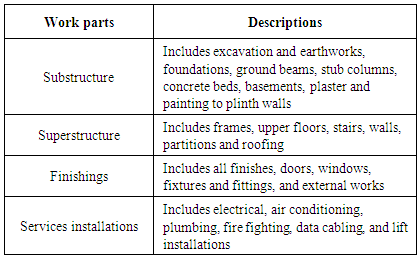
- The data used in this study are primary data obtained through a questionnaire survey of addressing the objectives of the research. The questions were centred on how risk factors cause variations on positive construction cash flows based on staged cash flows related to substructure, superstructure, finishings and services installations (as described in section 2.2). The composition of these work parts is shown in Table 2.
|
3.1. Questionnaire Design
- This research intended to analyze the relationships between variations on forecasted construction cash flows and the significant risk factors involved in causing those variations on forecasted construction cash flows in building projects. The questionnaire design targeted to collect the data related to the objectives of this study from building contractors based in Dar es Salaam City (from class I to class VII). A questionnaire survey was therefore used in this study to collect the data for analysing specifically the relationships between the risk factors and variations using structural equation modelling. The comprehensive list of risk factors causing variations on forecasted construction cash flows of the study of [13] was used as previously stated. Furthermore, the questionnaires used the closed ended questions to collect the data of this study. The scale was developed basing on a 5-point Likert scale defined as “very high = 5”, “high = 4”, “medium = 3”, “low = 2” and “very low = 1”. These rating scales were used by respondents to provide their views on how the risk factors cause variations on FCCFs by rating each of the statements in terms of those scales. The data were therefore collected using a questionnaire survey through quantitative approach.
3.2. Data Collection
- Risk factors causing variations on forecasted construction cash flows in construction projects were identified through literature review. Then, a questionnaire survey was finally used to collect data on how risk factors cause the variations on forecasted construction cash flows from building contractors based in Dar es Salaam. It indicates that most of building contractors have enough experience in executing the building projects because the response showed that most of building contractors had experience of more than 10 years in executing the building projects.
3.3. Sample Size
- The established sample was 281 building contractors (from class I to class VII) based in Dar es Salaam City, but an additional of 26 building contractors was added during distributing the questionnaires so as to overcome the shortage for those questionnaires which were not returned. 307 questionnaires were therefore distributed to building contractors. The sample was calculated using the statistical model (equation 1) presented by [11]. The total population for building contractors based in Dar es Salaam was 1082 (class I–76, II–18, III–31, IV- 97, V-264, VI-235, and VII-361) [29].
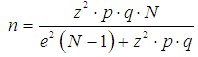 | (1) |
3.4. Response to Questionnaires
- The responses collected were 284 out of 307 that represent 92.51% responses rate. The number of respondents is still above the established sample size (281). This indicates that the number of respondents was good representation for the analysis of this study.
4. Results and Discussion
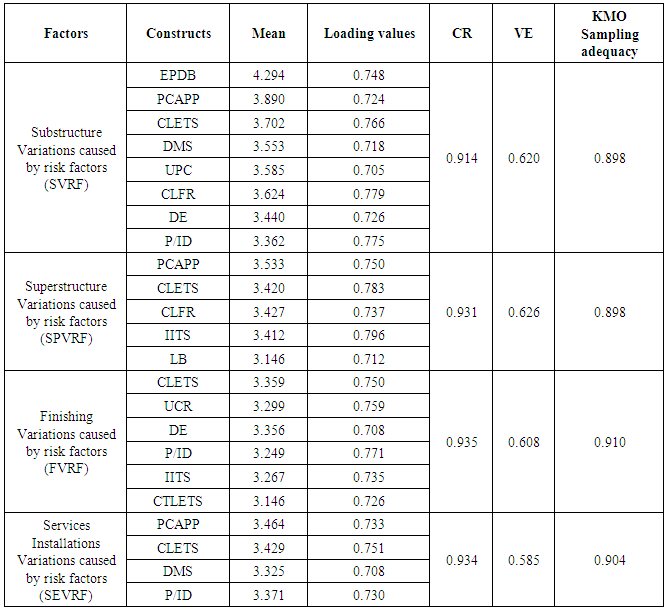
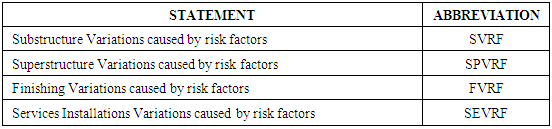
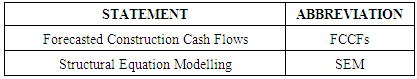
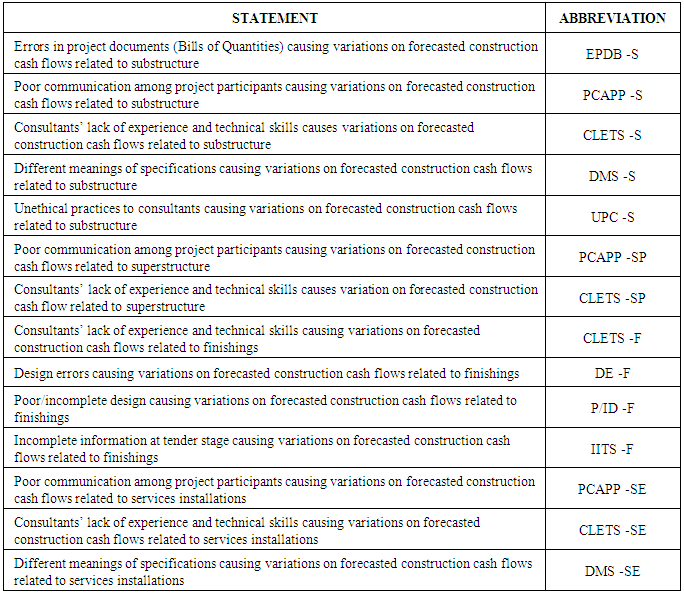
- The data are mainly analyzed using structural equation modelling (SEM) specifically AMOS software for the data obtained from questionnaires. Statistical package for social sciences (SPSS) version 20 was also used for factor reduction in identifying the significant risk factors (analytical variables). While the interactions among meaningful factors and confirmation of significant risk factors were analyzed using AMOS. Furthermore, this study used means, loading values, Cronbach’s alpha tests and Kaiser-Meyer-Olkin to identify significant risk factors (analytical variables). Also, loading values were used to analyze the risk factors through SEM including various structural model fit tests. Both identification of significant risk factors (analytical variables) and relationships analysis were performed from the responses of 284 respondents. The risk factors, variations and other general terms have been presented in abbreviations (short forms) in this study as shown in Table 8, 9 and 10 respectively in order to save space during presenting the data in tabulation form. But the abbreviations of risk factors used in path model are shown in Table 11. Other short forms used in this study are VE (variance explained), KMO (Kaiser-Meyer-Olkin) and GMI (Grand Mean Index) which is the mean of means of all sub-samples within the sample. This part involves mainly three sections namely identification of significant risk factors (analytical variables), estimation of parameters of variables for various relationships, and structural equation model as discussed hereafter.
4.1. Identification of Significant Risk Factors (Analytical Variables)
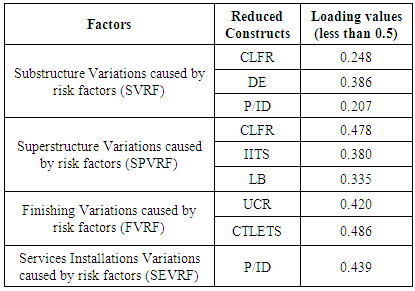
- Literature indicates that risk factors have relationships with variations happened on forecasted construction cash flows. The variations on FCCFs related to various work stages were measured using the risk factors presented by [13] as shown in Table 1. These variations were measured in terms of impacts caused by those risk factors in affecting forecasted construction cash flows basing on a 5-point Likert scale as previously defined in section 3.1. These risk factors were chosen because they are the ones which extracted thoroughly from various related studies, but only significant risk factors were selected for SEM analysis from the list.The significant risk factors were statistically identified through exploratory factor analysis using principal component analysis (PCA) as extraction method and varimax rotated as rotation method. These significant risk factors selected were based on collected data, construct quality, reliability and validity tests as suggested by [16]. Furthermore, the criteria for identification were set as follows;(i) The loading values were set above 0.5(ii) Cronbach's alpha tests were above 0.8 to respective group (latent variable)(iii) All means of the significant risk factors were greater than grand mean index (GMI) to respective group (latent variable). (iv) The Kaiser-Meyer-Olkin (KMO) was also set above 0.8 to respective group (latent variable) for sampling adequacy.(v) The variance explained (VE) was set above 0.5 to respective group (latent variable).Also, the mean scores of significant risk factors were above 3 (i.e. 3/5 = 60%) as suggested by [29]. These are passing criteria in this study for identifying the significant risk factors in causing variations on forecasted construction cash flows in building projects. It should be noted that grand mean index was used in this study because there were sub-samples of various classes within the general sample. The grand mean indices for the risk factors causing variations on forecasted construction cash flows for substructure, superstructure, finishings and services installations were 3.282, 3.144, 3.121 and 3.149 respectively. Therefore, Table 3 indicates variables that remain after exploratory factor analysis basing on mentioned criteria above. In fact, factor analysis reduced the number of risk factors (constructs) from 27 or 26 risk factors to each latent factor to less than 8 significant risk factors to each latent group as indicated in Table 3.
|
|
|
4.2. Estimation of Parameters of Variables for Various Relationships
- This part involves mainly estimating the parameters of the variables to various relationships through doing causal analysis and correlation analysis. The parameters for various significant risk factors (observed variables) in causing variations on FCCFs for substructure, superstructure, finishings, and services installations were estimated. Also, correlation parameters for variations on FCCFs for substructure, superstructure, finishings, and services installations of buildings were estimated.
4.2.1. Estimation of Parameters of Risk Factors (Observed variables) for Causal Relationships
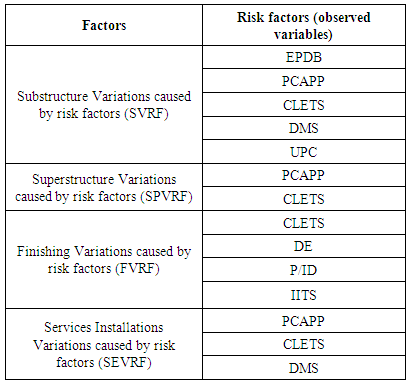
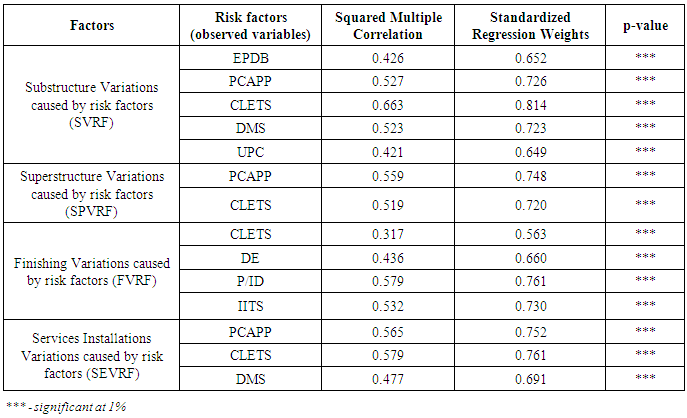
- Table 6 indicates an analysis on contribution of each significant risk factor in causing variations on FCCFs for substructure, superstructure, finishings, and services installations of buildings (all relationships are also indicated in a model (Figure 2)).
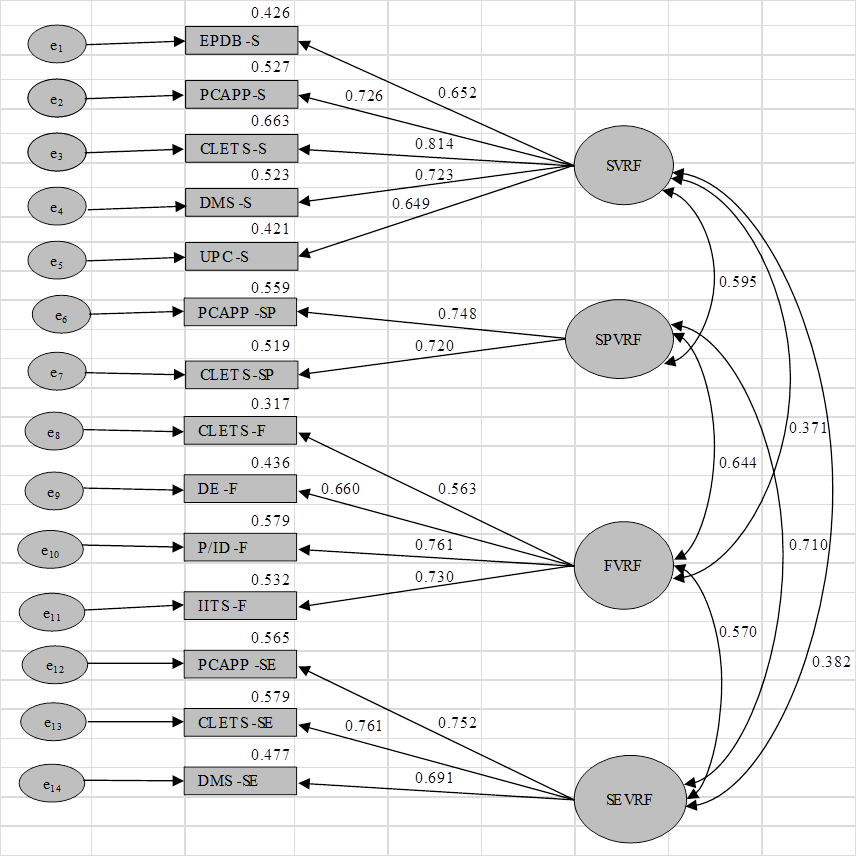 | Figure 2. Structural Equation Model |
|
4.2.2. Estimation of Correlation Parameters of Variations on Forecasted Construction Cash Flows
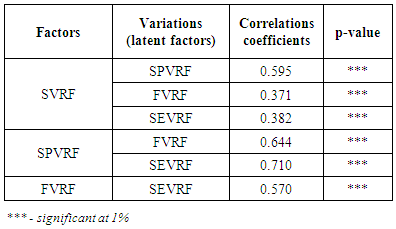
- Table 7 shows correlation analysis for variations on forecasted construction cash flows for substructure, superstructure, finishings, and services installations of buildings (all correlations are indicated in a model (Figure 2)). This study found that the strongest relationship is between variations on forecasted construction cash flows for superstructure works (SPVRF) and the variations happened on the services installations (SEVRF) with correlation coefficient of 0.710. The second strong relationship is between variations on forecasted construction cash flows for superstructure works (SPVRF) and the variations happened on the finishings (FVRF) with correlation coefficient of 0.644. Furthermore, all correlations exist among the variations on FCCFs for various works are positive, but two correlations have correlation coefficients less than 0.5 (i.e. 0.371 and 0.382) as indicated in Table 7.
|
4.3. Structural Equation Model
- Figure 2 indicates the results for SEM analysis. Overall fitness of the structural model was estimated using various model fit tests as pointed out by [13] such as Root mean square error of approximation (RMSEA) should be below 0.1, Goodness of Fit Index (GFI) and Comparative Fit Index (CFI) should be in the range of 0 to 1, then the overall model fit appears quite good. The current analysis reported a RMSEA = 0.066 < 0.1, CFI = 0.939 and GFI = 0.710 (belong to the range of 0 to 1). These tests recommend that the model fit can be concluded to be good. Also, the χ2 test yields a value of 157.824 that is evaluated with 71 degrees of freedom were found to be significant at 0.01, which are good results as revealed by [13]. From the results, it is clear that the tested model (Figure 2) provides better fit to data.Furthermore, eight (8) risk factors were identified as contributing significantly to the variations on FCCFs for various works in building projects. But, 36% of these risk factors explain their variability less than 50% which indicate that the variability of more than 60% of all significant risk factors is maximally explained. Normally, the larger the sample size, the higher parameters can be estimated. The sample size used in this study is appreciable large, because [6] pointed out that a rule of thumb requires 10 observations per variable in setting a lower bound for the adequacy of sample sizes. In this study, a number of variables were reduced to 23 (after passing the exploratory analysis and other tests in Table 3). Also, it should be noted that these 23 variables were subjected for further reduction using SEM as indicated in Table 3 and 4). This reduction enables to make more sense and easy interpretation of results Based on this rule, corresponding number of respondents was supposed to be 230 as lower bound of sample size (since there were initially 23 variables for SEM analysis before final reduction). Therefore, SEM analysis in this study was done using 284 respondents which is greater than the proposed lower bound.Also, Figure 2 indicates that when variations on FCCFs related to substructure works go up by 1 standard deviation, the standard deviations of the substructure variations caused by errors in project documents (Bills of Quantities) (EPDB–S), poor communication among project participants (PCAPP–S), consultants’ lack of experience and technical skills (CLETS–S), different meanings of specifications (DMS-S) and unethical practices to consultants (UPC-S) go up by 0.652, 0.726, 0.814, 0.723 and 0.649 respectively. While variations on FCCFs related to superstructure works go up by 1 standard deviation, the standard deviations of the superstructure variations caused by poor communication among project participants (PCAPP–SP) and consultants’ lack of experience and technical skills (CLETS-SP) go up by 0.748 and 0.720 respectively. Furthermore, when variations on FCCFs related to finishing works go up by 1 standard deviation, the standard deviations of the finishing variations caused by consultants’ lack of experience and technical skills (CLETS–F), design errors (DE–F), poor/incomplete design (P/ID-F) and incomplete information at tender stage (IITS–F) go up by 0.563, 0.660, 0.761 and 0.730 respectively. While variations on FCCFs related to services installations go up by 1 standard deviation, the standard deviations of the services variations caused by poor communication among project participants (PCAPP–SE), consultants’ lack of experience and technical skills (CLETS-SE) and different meanings of specifications (DMS-SE) go up by 0.752, 0.761 and 0.691 respectively. Basing on correlation results as indicated in Figure 2, all variations on forecasted construction cash flows related to substructure, superstructure, finishing and services installations are positively correlated. More than 65% of all correlations have correlation coefficients greater than 0.5 which indicate that they are strongly correlated in execution of building projects.
|
|
|
|
5. Conclusions
- This paper has been concentrated on analyzing the relationships between variations on forecasted construction cash flows and the significant risk factors involved in causing those variations in building projects. Also, it includes identifying the significant risk factors and formulating a structural equation model. The identified relationships have been analysed using SEM. Based on the analysis, eight risk factors were identified as the significant risk factors in causing variations on forecasted construction cash flows related to substructure, superstructure, finishings and services installations. These risk factors showed significant causal relationships with variations on forecasted construction cash flows related to substructure, superstructure, finishings and services installations of building projects in Tanzania. Therefore, it can be concluded that variations on forecasted construction cash flows related to substructure, superstructure, finishings and services installations have significant relationships with errors in project documents (Bills of Quantities), poor communication among project participants, consultants’ lack of experience and technical skills, different meanings of specifications, unethical practices to consultants, design errors, poor/incomplete design and incomplete information at tender stage as shown in the model (Figure 2).Furthermore, consultants’ lack of experience and technical skills is only risk factor that shows the significant relationships with all variations on forecasted construction cash flows related to substructure, superstructure, finishings and services installations. Also, consultants’ lack of experience and technical skills is the most influential risk factor in causing variations on forecasted construction cash flows related to substructure and services installations. All variations that occur on forecasted construction cash flows related to substructure, superstructure, finishing and services installations are positively correlated to each other in executing building projects. But the strongest relationship is between variations on forecasted construction cash flows for superstructure works and the variations on forecasted construction cash flows related to services installations.Basing on the analysis (RMSEA = 0.066 < 0.1, CFI = 0.939 and GFI = 0.710 (belong to the range of 0 to 1)), the model fit can be concluded to be good for analysing all risk factors causing variations on positive construction cash flows related to various works in building projects. This model shows fourteen (14) positive relationships between variations on forecasted construction cash flows related to substructure, superstructure, finishings and services installations, and the significant risk factors causing those variations. Also, the model presents six (6) positive correlations existing among the variations on forecasted construction cash flows for various works in building projects.
6. Recommendations
- The study recommends that stakeholders in building industry should involve the strategies that can minimize the variations caused by identified significant risk factors on forecasted construction cash flows in building projects. Also, contributing trends of the identified significant risk factors in causing variations on forecasted construction cash flows based on detailed elements of buildings should be established from historical data using contract documents such as Bills of Quantities, cash flow projections, work programme, interim valuations for payments and site instructions. This will give actual contributing trends of these identified significant risk factors so as to suggest appropriate measures for minimizing the variations on forecasted construction cash flows. Additionally, this documentation will help to know if there are other significant risk factors causing variations on FCCFs or not basing on contract documents.