-
Paper Information
- Next Paper
- Paper Submission
-
Journal Information
- About This Journal
- Editorial Board
- Current Issue
- Archive
- Author Guidelines
- Contact Us
International Journal of Construction Engineering and Management
p-ISSN: 2326-1080 e-ISSN: 2326-1102
2017; 6(4): 111-132
doi:10.5923/j.ijcem.20170604.01

Critical Factors for Interorganizational Collaboration and Systemic Change in BIM Adoption
 Abstract
 Reference
 Full-Text PDF
 Full-text HTML
Rehema J. Monko1, Charles W. Berryman2, Carol J. Friedland2
1Ardhi University, Dar es Salaam, Tanzania
2Louisiana State University, Baton Rouge, Louisiana, U.S.
Correspondence to: Rehema J. Monko, Ardhi University, Dar es Salaam, Tanzania.
| Email: |  |
Copyright © 2017 Scientific & Academic Publishing. All Rights Reserved.
This work is licensed under the Creative Commons Attribution International License (CC BY).
http://creativecommons.org/licenses/by/4.0/

Interorganizational collaboration and systemic change are necessary for best realization of Building Information Modeling (BIM) benefits but can be difficult where a clear consensus on the critical influential factors is lacking. This study identified those distinct factors that are critical to the interorganizational BIM adoption. Measures interrelated beyond organizational boundaries were previously identified, through a meta-analysis of factors and sub-factors, and termed collaborative. The identified measures, however, were numerous and varied between studies. An online survey of 165 US contractors was conducted on the measures, which yielded six critical factors that established a clear consensus on measures spanning 13 interorganizational BIM literatures. The identified critical factors (organizational variety, team BIM capability, duty of care, risk and liabilities, scope of work, and data preservation), formed the final scale that provided an instrument for evaluating collaboration and systemic change necessary to adopt BIM.
Keywords: BIM Critical Factors, Interorganizational Context, Collaboration and Systemic Change
Cite this paper: Rehema J. Monko, Charles W. Berryman, Carol J. Friedland, Critical Factors for Interorganizational Collaboration and Systemic Change in BIM Adoption, International Journal of Construction Engineering and Management , Vol. 6 No. 4, 2017, pp. 111-132. doi: 10.5923/j.ijcem.20170604.01.
Article Outline
1. Introduction
- Interorganizational collaboration and systemic change are necessary to adopting Building Information Modeling (BIM) for best realization of benefits but can be difficult where a clear consensus on the critical influential factors is lacking. The extant literature identifies significant influential factors for BIM or virtual design and construction (VDC) technologies, e.g. open systems (Chau & Tam, 1997), collaborative technologies (Nikas, et al., 2007), BIM (Ashcraft, 2008; Deutsch, 2011; Mutai, 2009; Oluwole, 2011; Redmond, et al., 2012; Singh, et al., 2011; Succar, 2009), and systemic innovations (Taylor & Levitt, 2004). Despite previous efforts, variations between studies make the distinct critical measures (factors and sub-factors) unclear, requiring further research. A meta-analysis of factors and sub-factors, introduced two categories of factors, basic and collaborative, that influence BIM adoption. Basic factors (technology-organization-environment), are consistent with the classic technology-organization-environment (TOE) theory (Tornatzky & Fleischer, 1990), while collaborative factors (interoperability-legal-social) relate to the interdependency of activities beyond organizational boundaries; respectively representing organizational and interorganizational contexts. Distinct measures for the basic factors fall entirely within the scope of the TOE theory and, as a consequence, were accepted here as critical to the adoption of BIM at an organizational or a company level. Meanwhile, the identification of collaborative measures was numerous and varied between studies. The variation necessitated further research to determine those distinct measures that are critical to the interorganizational level. The following section examined background information to the study and evidence that begins to address the need for establishing distinct measures for interorganizational collaboration and systemic change in BIM adoption, with survey results from a representative sample of the US contractors.
2. Review of Literature
- Most BIM or VDC studies identify the factors influencing the adoption process but do not particularly focus on the interorganizational context (Becerik-Gerber & Rice, 2010; Deutsch, 2011; Eastman, et al., 2008; Gu & London, 2010; Khanzode, et al., 2006; Mutai, 2009; Neff, et al., 2010; Nikas, et al., 2007; Succar, 2009; Taylor & Levitt, 2004; Thomson & Miner, 2006; Won, et al., 2013). For studies that include a discussion on the interorganizational context, results vary between studies, lacking a common agreement on the critical influential factors. Moreover, only a few of these studies presented their report as a result of a survey. It is assumed that respondents’ perception and knowledge is representative of their organization’s view point in terms of philosophy and company goals (Ku & Taiebat, 2011).Among the reviewed cases leading to this present study is a dissertation by Mutai (2009). Mutai surveyed 113 leading construction companies in the US and examined the factors influencing BIM use. The study was general to BIM adoption, although discussed big BIM that was likened to interorganizational BIM (Fox & Hietanen, 2007) and systemic innovations (Taylor & Levitt, 2004). Mutai’s theoretical model was derived from theories including, Technology Adoption Model (TAM) (Davis, et al., 1989), TAM-2 (Venkatesh & Davis, 2000), Diffusion of Innovation (DOI) (Rogers, 1995), and Task-Technology Fit (TTF) (Goodhue & Thompson, 1995). Unlike the TOE theory, these theories have been criticized for not considering the influence of technological characteristics of the novel technology being adopted (Nikas, et al., 2007). Nikas, et al. (2007) examined factors influencing the adoption of web-based collaborative technologies, through modification of the TOE framework. Their research surveyed a sample of 285 design, construction, and consulting companies. However, it has been noted that the level of trust placed on web-based applications, and similar services such as email and social sites that synchronize information, has not yet transferred to the construction managements solutions (CTI, 2012). Further research was necessary to determining the critical factors that commonly apply to the construction management solutions, particularly BIM. Chau and Tam (1997) also modified the TOE theory and developed a model for open systems adoption. Significant factors were identified through a survey of 89 construction companies. However, the factors were not conceptualized as being interrelated, and the end structure did not differ from the TOE framework. Redmond, et al. (2012) interviewed 11 experts on “Cloud BIM” and identified significant influential factors. However, conceptualization of factors was different from the present study. In addition, generalization of results to a larger population of BIM users is limited by sample size. Utilizing a focus group and a case study, Singh, et al. (2011) focused on identifying the technical requirements for using BIM-server, which was described as a platform for multidisciplinary collaboration. While provided a detailed discussion on collaboration, focusing on the technical requirements suggested the need to adequately incorporate non-technical requirements for a comprehensive strategy. Other studies (Ashcraft, 2008; Oluwole, 2011; Thomson & Miner, 2006) identified influential factors to BIM adoption, primarily focusing on legal factors. Through BIM ontology, Succar (2009) identified influential factors to BIM adoption. The research developed an interlocking framework, which was not derived from the TOE theory and did not conceptualize the factors as basic and collaborative in an interrelated fashion. In addition, the study was general to BIM adoption and did not particularly provide clear distinction relative to the contexts of adoption. Deutsch (2011) identified influential factors to BIM adoption by examining a design/architectural company as a case study. However, literature indicates that design companies take the lead in BIM adoption while contractors lag behind (Mutai, 2009; Suermann & Issa, 2009). Expanding research to other stakeholders, particularly contractors, was necessary to contribute to a more comprehensive interorganizational BIM strategy. The following; level of BIM use, project delivery method, and levels of interaction in BIM projects, are discussed next in connection with interorganizational BIM usage.The level of BIM useIt has been noted that issues related to the use of BIM technology arise from either the technology itself or from the way the technology is used (Ashcraft, 2008). Further, Ashcraft noted that utilizing BIM internally, within organizational boundaries, such as for production of better quality design documents, receives limited resistance from users. However, when used for collaborative data sharing, BIM creates not only opportunities for reforming project delivery, but also new challenges that need to be addressed and resolved (Ashcraft, 2008; Mutai, 2009). Different studies have discussed the need for all project teams to be able to use BIM technology; referring to this as team BIM capability (Eastman, et al., 2008; Fox & Hietanen, 2007; Succar, 2009). The challenge, however, is to ensuring that every participant to the project has the requisite technology and skill set, and the willingness to participate in the creation and use of BIM models (Eastman, et al., 2008). The reason being, companies involved with BIM projects are required to commit in collaborative arrangements and accept changes in a coordinated fashion. This requirement is contrary to a fragmented work environment of the construction industry that promotes competition and does not support collaboration. It was therefore expected that interorganizational BIM users would have more encounters with the collaborative factors than companies that exchange data within organizational boundaries.Project delivery methodDepending on the project delivery method, the level of challenges encountered at an interorganizational level may vary between companies. New approaches such as integrated delivery methods have been proposed to solve fragmentation related problems and case studies on the successful use of the approaches have been documented (Khanzode, et al., 2006). It is argued, for example, that the set-up of design/build companies supports BIM adoption due to the fact that team collaboration is made easier (Ashcraft, 2008; Eckblad, et al., 2007) as everything is done under one roof. Researchers on BIM note that the design/build delivery system helped the construction industry take a step toward a more collaborative project environment. They believe that that integration of BIM technology into the process will be the industry's next revolutionary step (Thomson & Miner, 2006). The two overlapping categorical factors (i.e. basic and collaborative), that emerged through a meta-analysis of factors and sub-factors assessed in this study, represent best practices for interorganizational collaboration and systemic change in the construction industry. The overlapping of factors echoes the design/build companies’ set-up. It was expected that design/build companies, whose team collaboration is made easier, would find the collaborative factors significantly less inhibiting in practice than non-design/build companies.Levels of Interaction in BIM ProjectsIn effort to clarifying the impact of BIM technology on projects, its adoption has been described in various ways including, interaction types (Grilo & Jardim-Goncalves, 2010), BIM paradigm trajectories (Taylor & Bernstein, 2009), BIM stages (Succar, 2009), impact level (Taylor & Levitt, 2004), or scale (Mutai, 2009). Grilo and Jardim-Goncalves (2010) described inter-company processes at coordination and cooperation levels as having no difference from the traditional approaches. This suggested that certain elements of cooperation are shared both at the coordination and collaboration levels. They exemplified the cooperation level by supply chain activities. Meanwhile, Taylor and Bernstein (2009) and Succar (2009) both put supply chain at the highest level (level 4) of interaction. Similarly, interdisciplinary BIM models and complex analyses were presented at the highest level of interaction (Succar, 2009). As a consequence, this present study adapted the four levels of interaction that share common features across these studies; communication, coordination, collaboration, and network-based that includes supply chain (Table 1). These were incorporated into the survey instrument for determining the most influential factors relative to the company’s level of interaction.
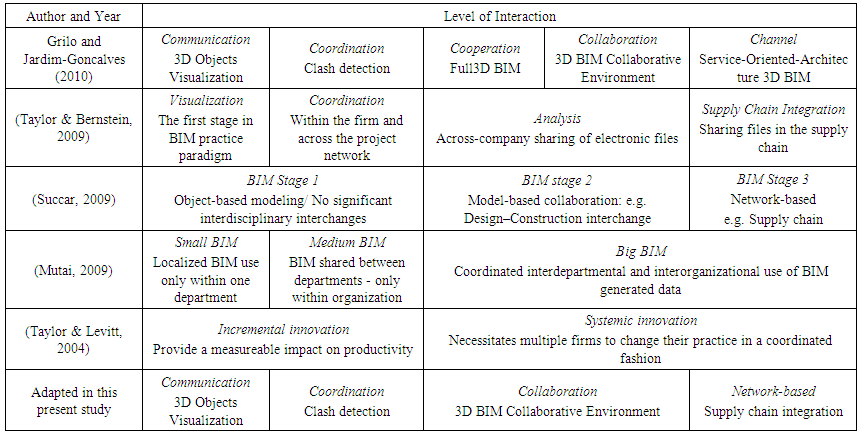 | Table 1. Levels of Interorganizational Interaction in BIM Projects |
3. Method and Settings
- The purpose of this study was to identify those distinct factors that are critical to the interorganizational BIM adoption. Various hypotheses were tested to determine statistical significant differences between groups of respondents, based on the level of BIM use, primary service offered to clients, level of interorganizational interaction, company size, company set-up (design/build vs. non-design/build), and the level of BIM experience. Results are presented in the following sections following the research method. MethodAs utilized in some of the aforementioned studies (Chau & Tam, 1997; Mutai, 2009; Nikas, et al., 2007), a survey methodology was applied in this present study to examining 64 research variables (32 enablers and 32 inhibitors) in the form of an online survey questionnaire. The survey methodology has the advantage of involving, in the process, the real end users and is relatively easy in administration, although can be limited by subjectivity in opinions and the lack of face to face interaction (Vuolle, et al., 2008). The present study derived its strength from, including into the research instrument, only previously identified measures, some of which have been tested through a survey methodology.The research instrumentThe research instrument/questionnaire comprised a total of seventeen questions addressing three parts including, company profile, level of BIM use, and evaluation of the variables. The collaborative variables presented in Figure 1 were used with some necessary validation and wording changes being made. Half of the variables were worded with proper negation (inhibitors) in order to ensure the desired balance and randomness in the questionnaire. The remaining items were considered enablers to the exchange of BIM data across organizations. This approach also served as a reliability check (in a form of alternate-form evaluation). Grouping the two was supported by consistencies found in literature, where barriers/inhibitors appeared to mirror the enabling factors. The items were then randomly sequenced to reduce the potential ceiling (or floor) effect. This is the effect that induces monotonous responses to the items for measuring a particular criterion (Hung, et al., 2003). The variables were measured using a five-point Likert-type scale with anchors ranging from “unimportant” to “very important” for enablers, and “strongly disagree” to “strongly agree” for inhibitors. Unlike previous studies, the developed questionnaire required only BIM users to evaluate the variables in order to obtain more practical knowledge regarding the interorganizational BIM use rather than speculative responses from non-BIM users. The variables were reviewed by a panel of five experts, including a statistician, to refining the research instrument before it was distributed to the research participants.
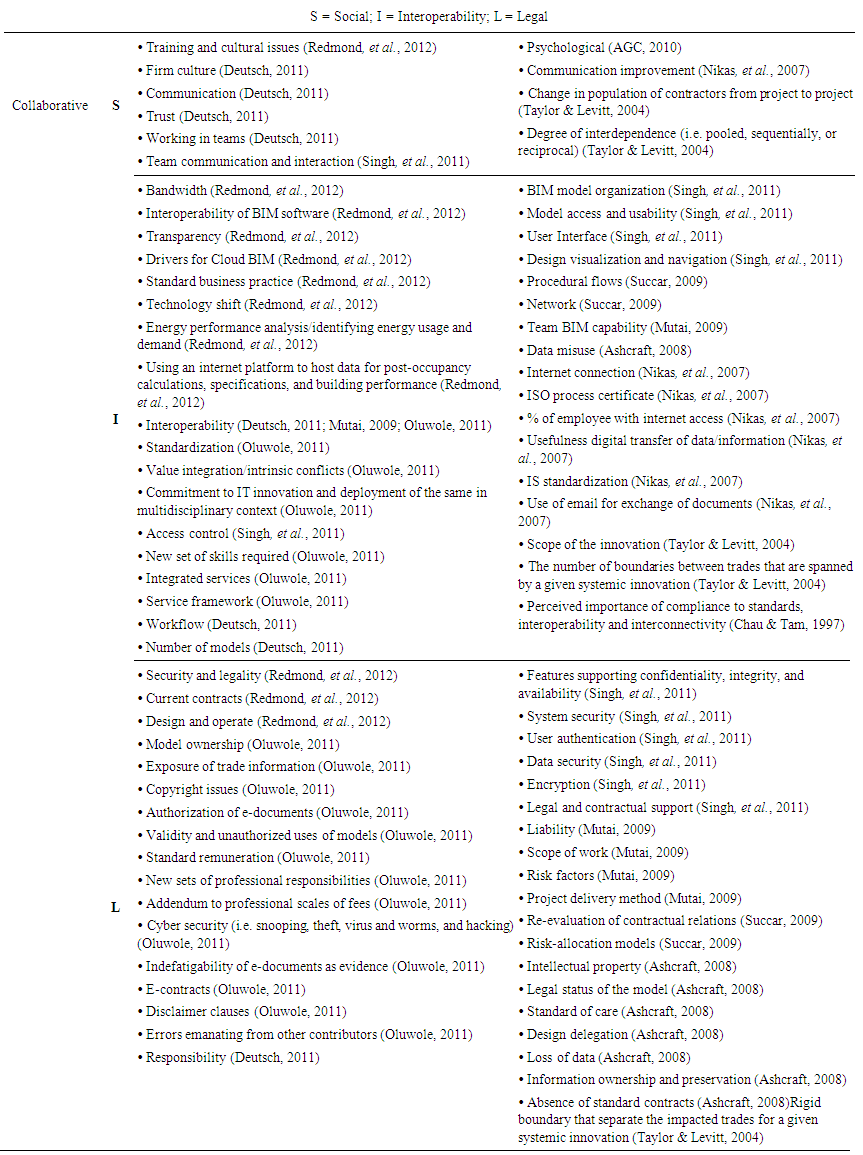 | Figure 1. Categorized Factors and Sub-Factors by Factor |
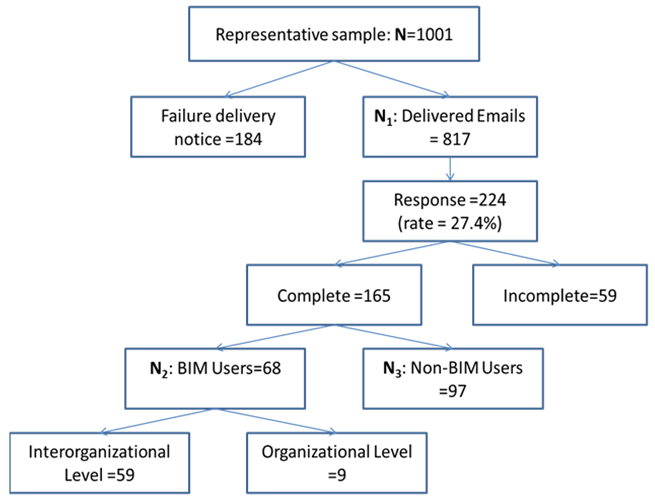 | Figure 2. Survey Response |
4. Results
- Descriptive analysis was utilized on questions that did not involve evaluating the research variables. Results are presented in frequencies, percent, valid percent, and cumulative percent figures. Meanwhile, quantitative analysis involved statistical analysis of the research variables.Descriptive analysisAmong 165 respondents, 97 (58.8%) indicated they had not utilized BIM technology on their projects (non-BIM users), while only 68 (41.2%) of respondents had used BIM technology (BIM users). Respondents to this study (Figure 3) predominantly held top management positions (31.3%) followed by project managers (23.9%) and CAD/BIM managers (20.9%).
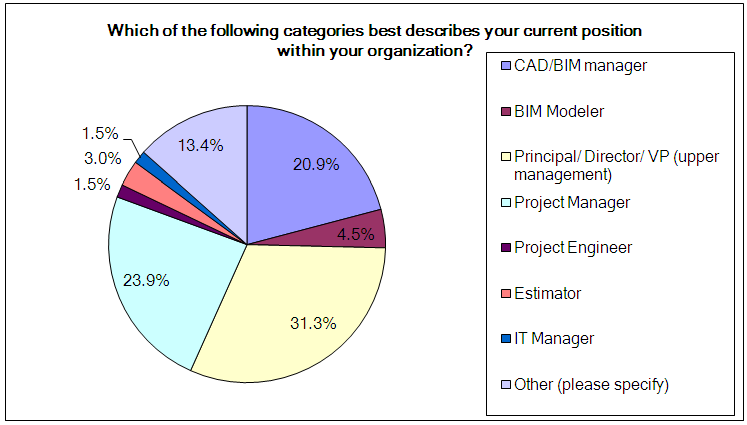 | Figure 3. Respondents Categories |
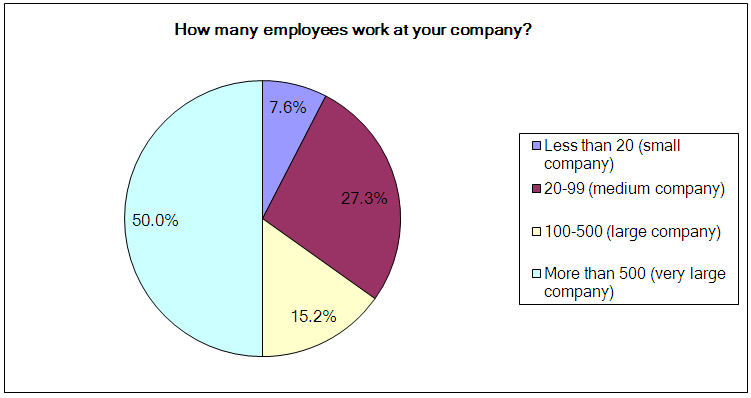 | Figure 4. Company Size |
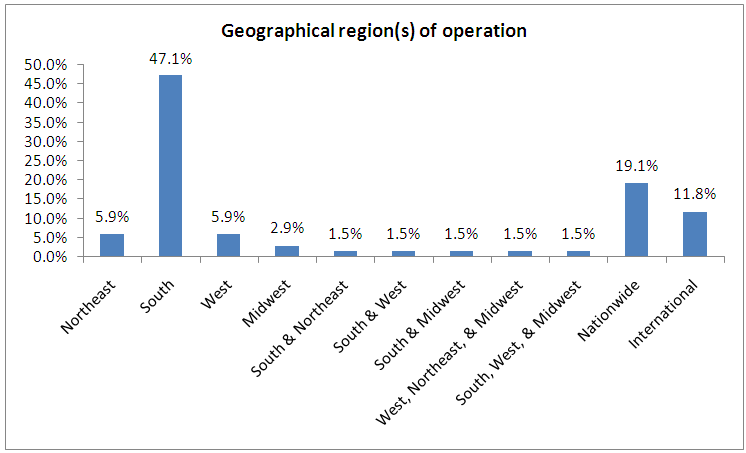 | Figure 5. Geographical Region(s) of Operation |
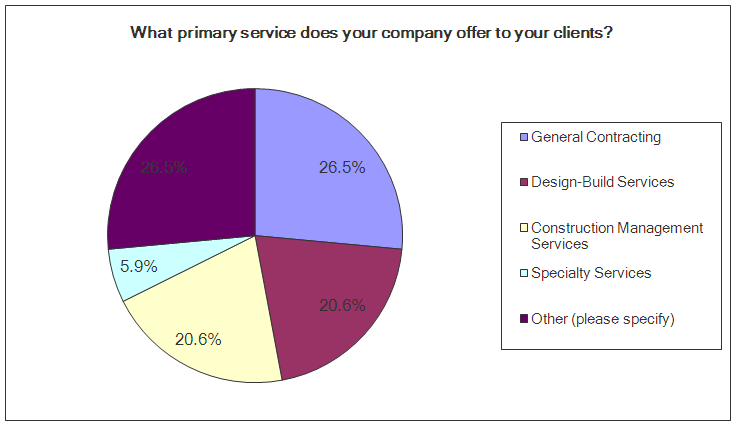 | Figure 6. Type of Services Offered to Clients |
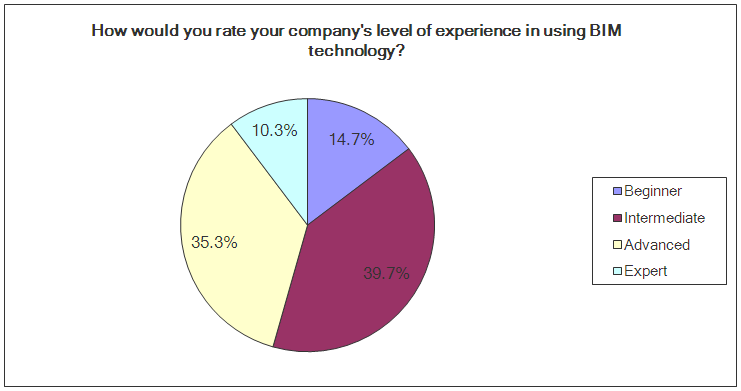 | Figure 7. Respondents’ Level of Experience in BIM Use |
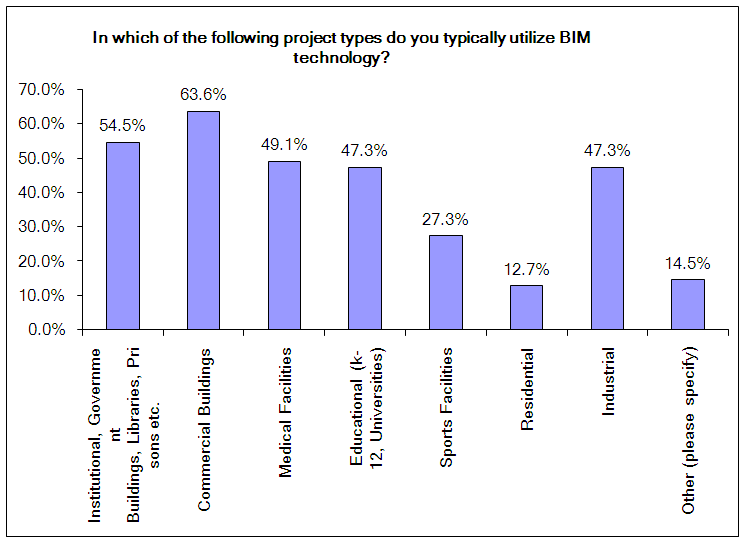 | Figure 8. Project Types on which BIM was Utilized |
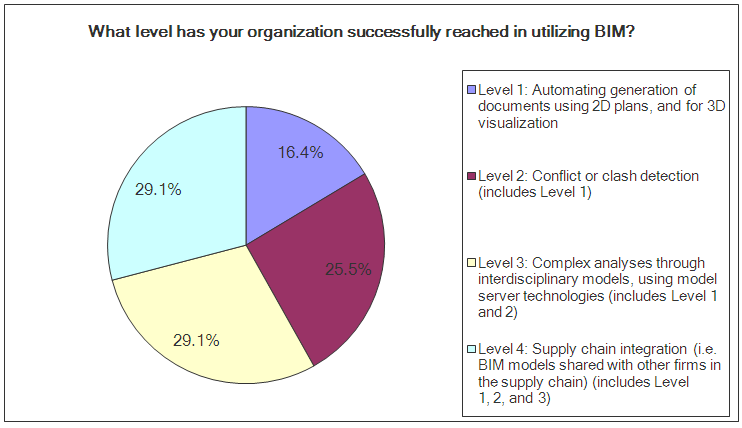 | Figure 9. Interaction Levels at an Interorganizational Level |
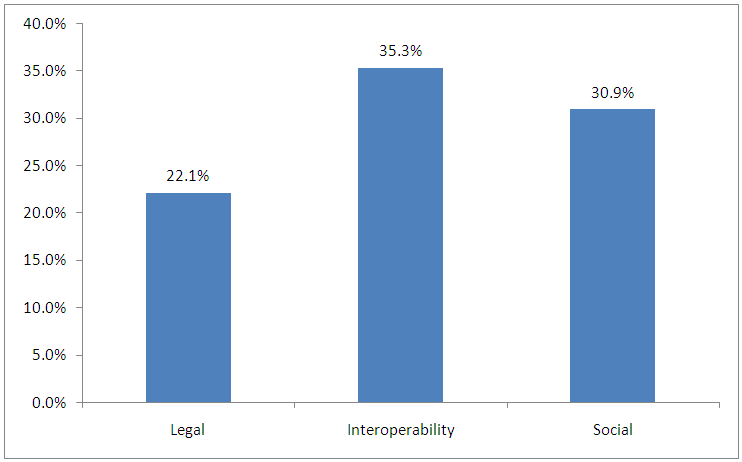 | Figure 10. Companies’ Biggest Concern in BIM Use |
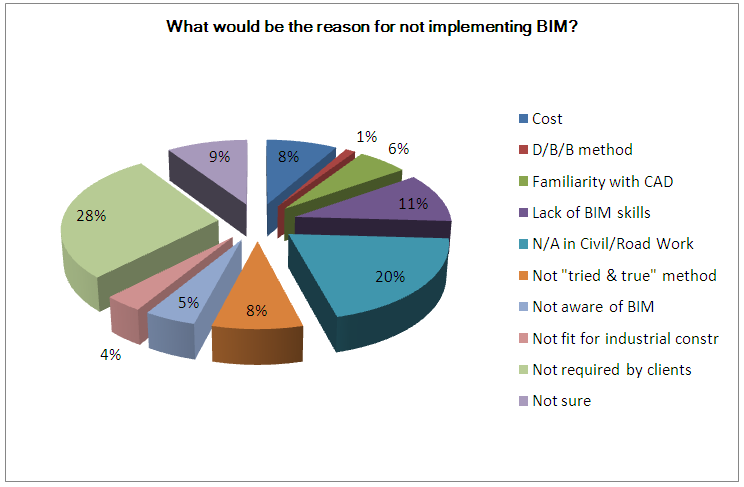 | Figure 11. Reasons for not Implementing BIM on Projects |
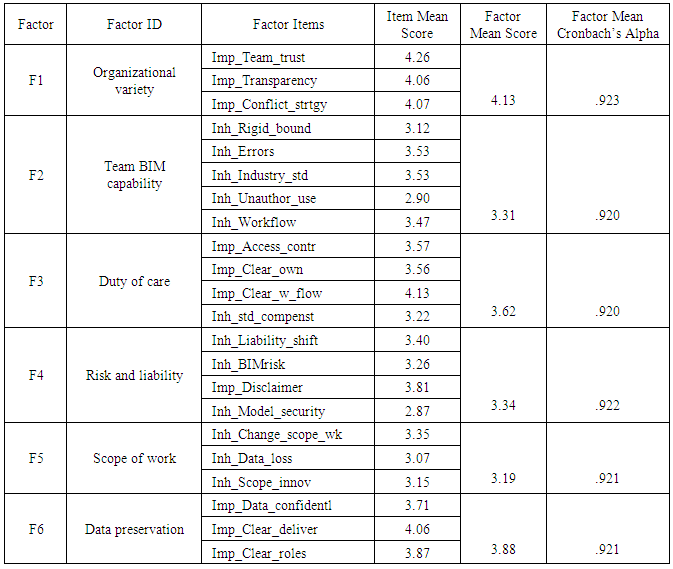 | Table 2. Item Means, Factor Means, and Cronbach’s Alpha Values |
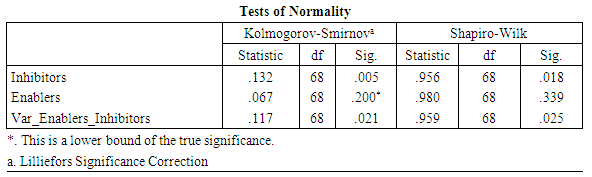 | Figure 12. Test of Normality |
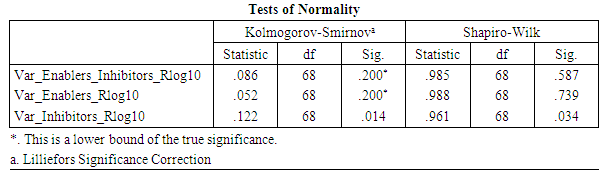 | Figure 13. Test of Normality of the Transformed Data |
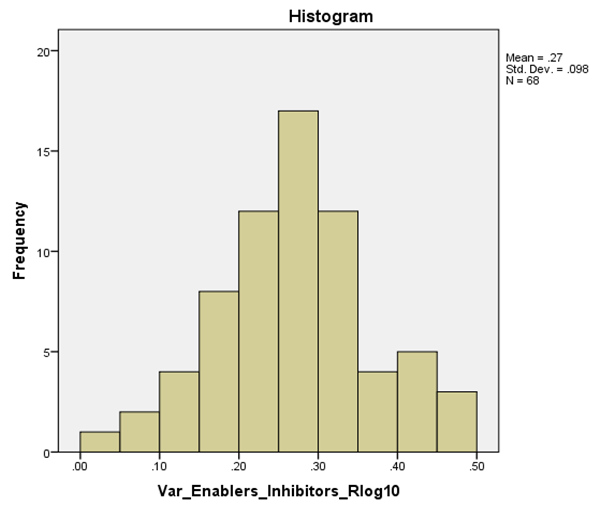 | Figure 14. Test of Normality for Transformed Data |
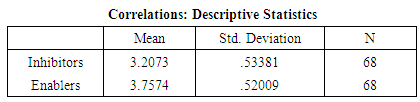 | Figure 15. Descriptive Analysis on Correlations |
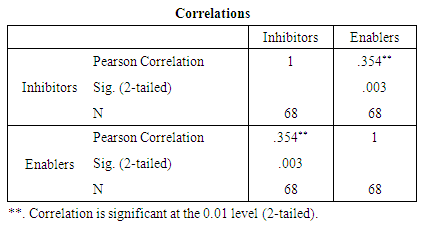 | Figure 16. Correlations |
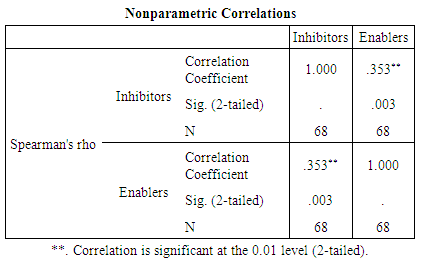 | Figure 17. Nonparametric Correlations |
 Independent Sample Test was performed to determine if there was a statistical significant difference in contractors’ perception on the factors based on the level of BIM use (organizational level = 0, interorganizational level = 1). The assumption of homogeneity of variances was tested and found tenable using Levene’s test (sig. = .498), which indicated equal variances were assumed. A significant difference (p-value = .022) was found between the two levels with regard to the social factors (organizational variety). Mean for interorganizational BIM users was 4.2147 while that of organizational BIM users was 3.5926. Hence, results supported a hypothesis (H1) that there was a significant difference in contractors’ perception of the collaborative factors based on the level of BIM use. Figure 18 summarizes results. Other tests had p-value > .05.
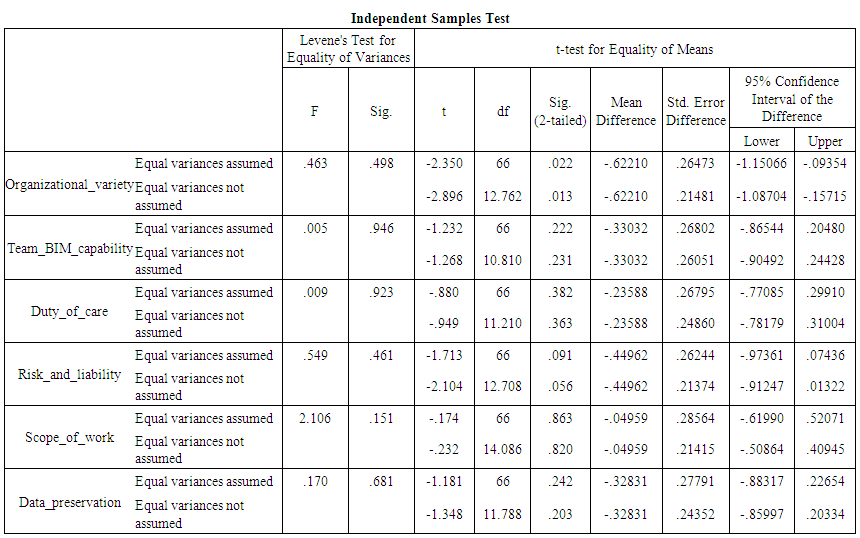 | Figure 18. Independent Samples Test based on BIM Level |
 Results for this test did not show any statistical significant difference between groups (all tests indicated p > .05), as shown in Figure 19. Post hoc test was, therefore, not necessary. In this test, the hypothesis (H2) was not supported.
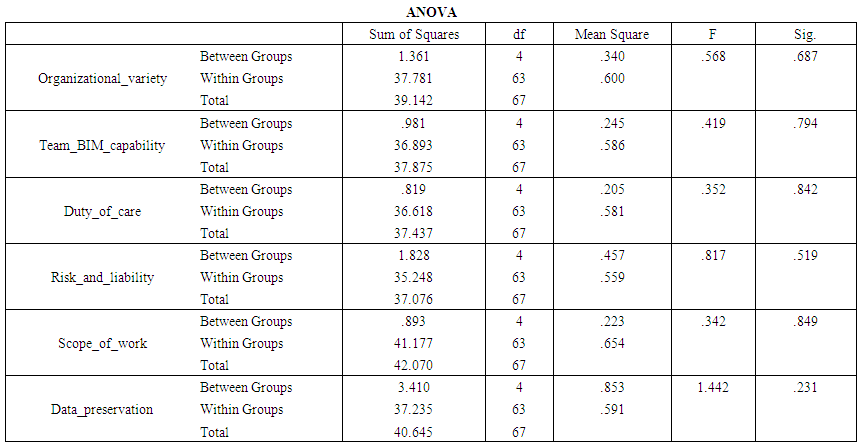 | Figure 19. ANOVA Test based on the Type of Primary Service Offered |
 Results indicated a significant difference existed between groups with regard to the social factors (organizational variety), (p-value = .02), as shown in Figure 20. The dependent variable, level of interaction, included four levels: level 1 (M= 3.48, SD=1.05, n=11), level 2 (M= 4.23, SD=.86, n=16), level 3 (M= 4.3, SD= .60, n=20), and level 4 (M= 4.24, SD=.48, n=21). The ANOVA was significant, F (3, 64) = 3.531, p-value =.02 and Levene’s test (sig. = .02). Thus, it was inferred that there is a statistical significant difference in contractors’ perception of the collaborative factors based on their companies’ level of interaction.
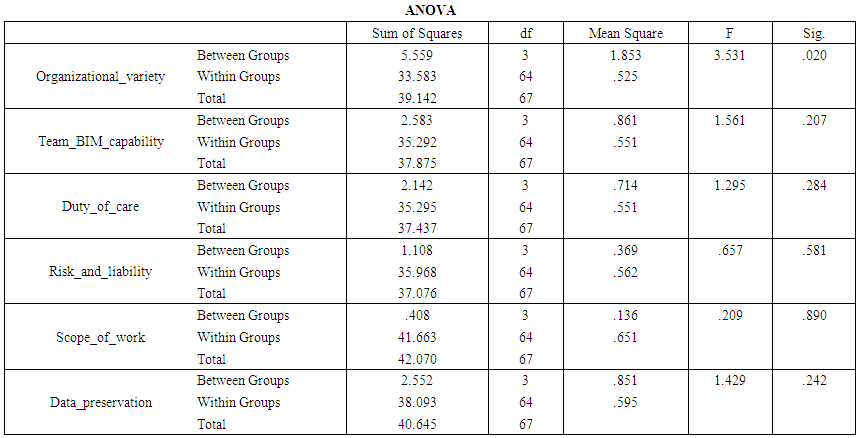 | Figure 20. ANOVA Based on Interorganizational Level of Interaction |
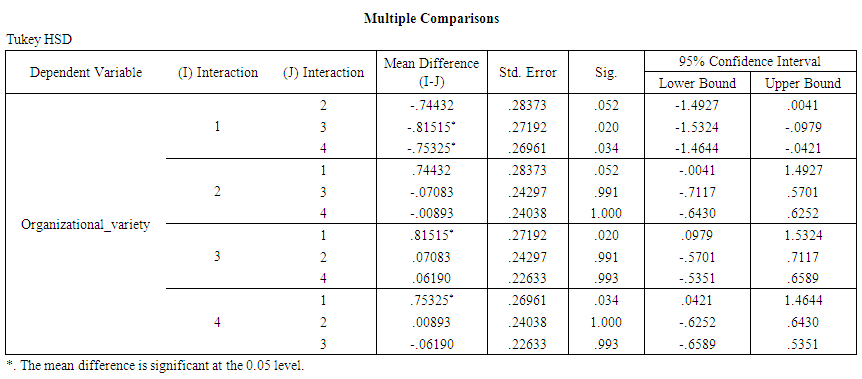 | Figure 21. Tukey HSD-Multiple Comparisons based on the Level of Interorganizational Interaction |
 Results indicated no significant difference existed between groups (p-values > .05), as shown in Figure 22. Hence, the hypothesis (H4) was not supported.
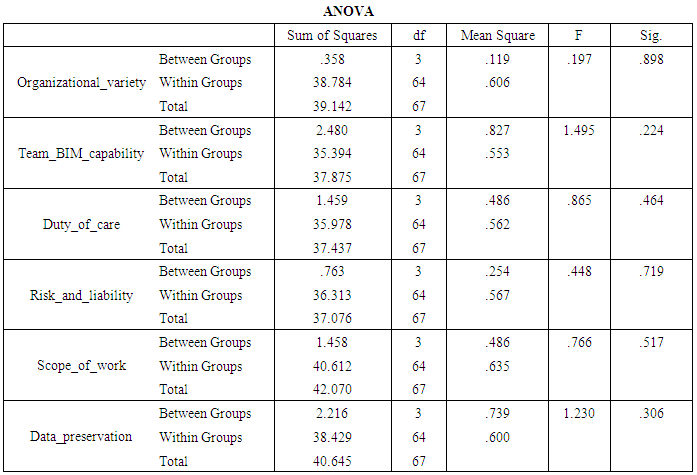 | Figure 22. Company size-ANOVA |
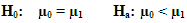 There was no statistical significant difference between groups (all tests indicated p > .05). Results are presented in Figure 23.
 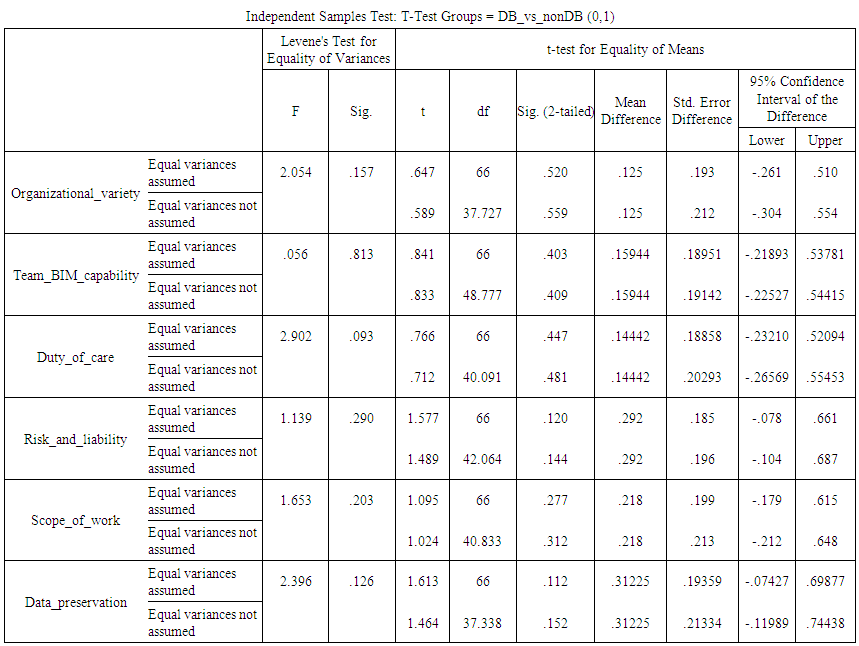 | Figure 23. Independent Samples Test on DB_vs_nonDB |
 Results (Figure 24) indicated no statistical significant difference exists between companies’ factor mean scores based on the level of BIM experience. Post hoc test was, therefore, not necessary. In this test, the hypothesis (H6) was not supported.
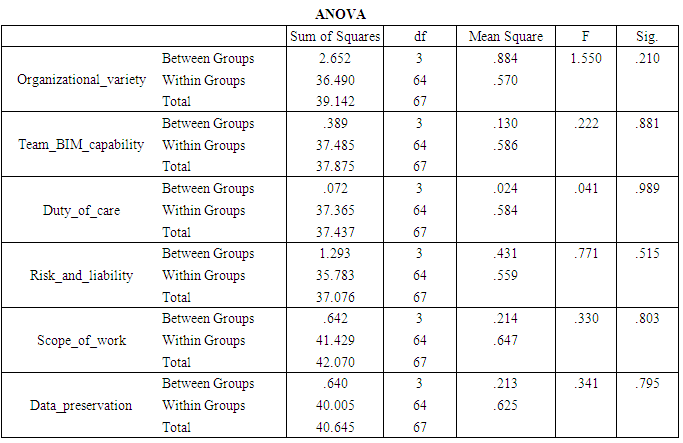 | Figure 24. ANOVA based on Level of BIM Experience |
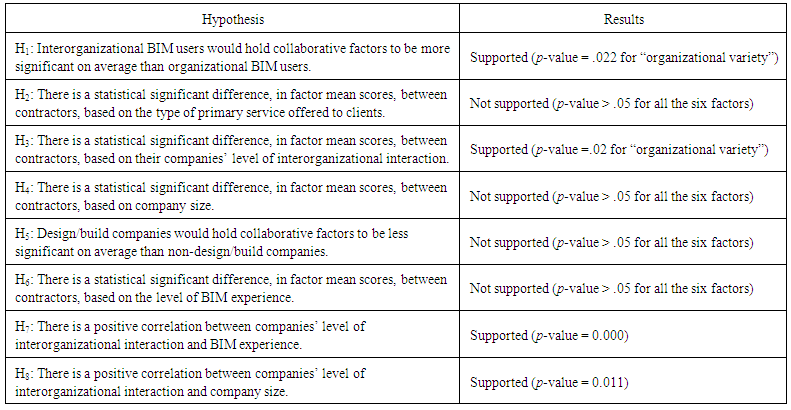 | Table 3. Summary of the Research Hypotheses as Detailed Above |
5. Discussion
- The objective of this study was to establish a clear consensus on the critical factors influencing interorganizational BIM that are inadequate in the classic TOE theory. The findings, consistent with previous studies and suggestions, revealed that social, interoperability, and legal, factors are important to the interorganizational sharing of BIM. The present study extends these findings by demonstrating that the three collaborative factors are contextual specific (interorganizational), which are inadequate in the classic TOE theory. Moreover, these findings not only support the extension of the TOE theory, but also demonstrate (through meta-analysis of factors), that the three factors are in a continuous interaction in practice. Figure 10 also provided companies’ biggest concerns in BIM use, which generally supported the three collaborative factors’ influence to the sharing of BIM data at an interorganizational level.Results indicated that companies utilizing BIM at an interorganizational level have more encounter with the collaborative factors and held higher mean scores (particularly on organizational variety) on average compared to companies that utilize BIM within organizational boundaries. This was consistent with Ashcraft (2008) who noted that more challenges arise when BIM is shared beyond organizational boundaries. Other studies (Grilo & Jardim-Goncalves, 2010; Mutai, 2009; Oluwole, 2011; Redmond, et al., 2012; Succar, 2009; Thomson & Miner, 2006) presented results that are consistent to these findings but with conceptualization of factors different from the current study. Significant difference between groups was also found based on the level of interorganizational interaction. Results showed that companies at collaboration and network-based levels of interorganizational interaction found the collaborative factors more important and inhibiting in practice than companies at a communication level. Specific differences were particularly on social factors (organizational variety). Based on cross-tabulation test, results indicated a positive correlation between levels of interaction and BIM experience. These findings were consistent with Taylor and Bernstein (2009) but their study was not based on a survey methodology. Overall, however, majorities (60.3%) of surveyed companies in this present study interacted at higher levels (3 and 4). This was contrary to Taylor and Bernstein (2009) who found that about 50% of the companies studied had difficulty transitioning beyond coordination (level 2).Based on the ANOVA results, construction stakeholders need to pay attention to the collaborative social factors, where a statistical significant difference was found between companies, as the levels of interorganizational interaction evolve. As a result of the structural mechanisms of project-based organizations, social reconstruction is considered high if groups’ constituents change from one project to the next (Stinchcombe, 1968 ; Taylor & Levitt, 2004). Although review of literature found a dearth of research on the social factors, survey results indicated the three collaborative (social, interoperability, legal) factors are significantly influential within the interorganizational context.To summarize, this study findings added to the body of knowledge in BIM adoption by confirming the critical influences of social, interoperability, and legal, factors in the sharing of BIM generated data across organizations. More importantly, results not only explored into the key roles of the three collaborative factors within the interorganizational context, but also confirmed that the three factors are inadequate in the TOE theory. By excluding the TOE consistent factors, survey results verified the distinct significance of the collaborative factors to the collaboration and systemic change within the fragment and competitive work environment. As earlier described, this condition is necessary to maximizing adoption of revolutionary technologies, such as BIM, whose interdependence of activities beyond organizational boundaries has proven difficult to adopt to the fullest extent. In addition to the identified factors, the following comments were provided by respondents:Ÿ “We are a huge company that is way behind in BIM. Most of our company doesn't realize what it is or what it could do for us”. Ÿ “We are essentially in the early stages of utilizing BIM. The main impetus for use is knowing that BIM is here to stay and will be utilized now and in the future with increasing importance”. Ÿ “My firm does not directly use BIM but some of our clients do and that is how we are connected to BIM. Detailed quantities of work are hard to get to in the hard bid public building arena. Detailed info (BIM) would allow for better planning of the work”. Ÿ “On design - bid - build projects, the design team needs to have a clear understanding that the BIM model needs to be turned over to the General Contractor -GC to allow proper BIM coordination among the trades to begin…forcing a GC to develop a 3D model from scratch wastes valuable coordination time, and also results in the potential of too many errors (particularly dimensional errors)”. Ÿ “Time scheduled in the project for BIM and clash detection is a challenge…every job wants it done, but little or no time is allowed in the schedule of construction”. Ÿ “I have not personally been part of the BIM development/creation process, only managing the process to stay on task & schedule. For the past 3 years, every project I have been a part of has used BIM modeling and it has been a huge part of our success”.Comments provided by respondents indicate that the use of BIM is sporadic and the knowledge of the most influential factors is lacking. The research findings are therefore expected to enhance understanding of the critical influential factors to maximize BIM adoption for best results. Meanwhile, companies that had not adopted BIM at the time of the survey indicated that lack of BIM requirement by clients was their biggest obstacle to adopting BIM. This was consistent with Eastman, et al. (2008). Their work noted that many owners do not require new types of deliverables, such as 3D Models, for a fear of limiting the pool of bidders willing to participate in their projects. This fear is linked to the potential increase in project price. Managing challenges related to the identified collaborative factors can help resolve such conflicting opinions and maximize interorganizational BIM adoption. While many surveyed contractors in the US stated the inapplicability of BIM in civil/road work as their second top most reason for not using BIM, generalization of this specific finding should always be accompanied by the most recent findings. This is mainly because BIM is evolving and its functions, definition of terms, as well as applicable standards, are continuously being developed and improved. In UK, for example, the Uniclass system, that is currently being improved, can accommodate infrastructure and civil works, in addition to buildings (John, 2014/06/01). These improvements have the potential to influence and change BIM users’ perceptions in future.Non-BIM users indicated that familiarity with computer aided design (CAD) was one of the reasons for not adopting BIM. Literature shows that most companies are currently using 2D technology and claim to have a long, proven track record with the technology (Gilligan & Kunz, 2007). The extant literature also notes that many companies cannot envision a clear business case from using BIM, and have difficulty justifying the return on investment (AGC, 2006). Hence, the industry needs to be clearer on how much of the BIM benefits outweigh the traditional approaches, to maximize adoption.Meanwhile, a significant number of respondents noted that BIM was not a “tried and true” method. Ashcraft, et al. (2006) noted, rather than viewing BIM as a technology, it should be viewed as a new project delivery method with new risks, rewards, and relationships. They added, however, that these new business process models do not yet exist in the market. As a result, project teams struggle to integrate BIM technology into conventional practices. Some of the representative comments provided by non-BIM users included:Ÿ “Given the size of our organization, and the scale of the projects we build, we've always felt that BIM would be over-kill. Additionally, we're of the impression that the learning curve, as well as the costs associated with BIM, would make it less than cost effective”.Ÿ “We do not have access to the models. Most design firms that we are working with are not creating models. We do not have the expertise to create them”.Ÿ “Cost and lack of qualified employees”Ÿ “No clients have requested BIM utilization”.Ÿ “We are civil contractor and are unfamiliar with BIM and any possible benefit from its use”.Ÿ “We are an underground utility contractor that receives civil plans for installation designed by an Engineer…as built for virtually all underground does not exist and our resource is not large enough to house the data for every area of ground that we excavate”.Ÿ “Have seen the program and love how it works, just don't have the personnel to implement”.Research Implication and LimitationsThe critical factors identified in this study confirmed that collaborative factors are inadequate in the TOE theory. Results presented here confirm that the six factor structure (basic and collaborative) is the most appropriate theory for studying technologies that involve interdependency of activities beyond organizational boundaries. Inadequate categorization of these factors limits comprehensive strategies that have the potential to maximize adoptability and benefits of such technologies, particularly BIM. In order to maximize BIM adoption, it was notable that the industry’s focus should be on 1) managing organizational variety to enhance teamwork, 2) acquiring adequate team BIM capability to facilitate seamless sharing of BIM generated data, 3) understanding the scope of work, 4) providing clarity on duty of care of the shared BIM model, 5) protecting companies from BIM risk and liabilities, and 6) providing standard for preserving the shared BIM generated data. Study findings indicate it is necessary that these key factors be viewed in an interrelated fashion rather than separation to facilitate collaboration and change in a coordinated fashion within the fragmented and competitive construction environment.Certain limitations were found in this study. First, the survey focused on contractors, and did not include architects and engineers who are important stakeholders to the sharing of BIM data beyond organizational boundaries. It is therefore advised that the two disciplinary groups be involved in future studies to identify those key collaborative factors that are critical across the three disciplinary groups. Any significant differences that may exist among the three groups should be utilized to further corroborate the current findings. Establishing a clear consensus on the critical factors across disciplinary groups will enhance development of a standard instrument for evaluating effectiveness of interorganizational interaction in BIM adoption. Second, the basic factors fully within the scope of the TOE theory were not tested in this study. Future studies should consider testing the two categorical factors (basic and collaborative) together; to determine specific percentage contributions of each category towards overall BIM projects success.
6. Conclusions: Critical Factors for Interorganizational Collaboration and Systemic Change in BIM Adoption
- This research examined the key collaborative (social, interoperability, legal) factors to establish a clear consensus on those critical measures for interorganizational collaboration and systemic change in BIM adoption. Principle components analysis identified six factors (organizational variety, team BIM capability, duty of care, risk and liability, scope of work, data preservation) as more important than other influential factors in interorganizational BIM adoption. Respondents’ perception of the factors was examined relative to the level of BIM use, the type of primary service offered to clients, company set-up (design/ build vs. non-design/build), level of interorganizational interaction, company size, and BIM experience. Results indicated that companies engaged in BIM data exchange beyond organizational boundaries have more encounter with the collaborative factors and held higher significant scores of the factors than companies that are not. Hypotheses 1 and 3 were affirmed through statistical analysis. This meant that as companies engage in exchanging BIM data, collaborative factors begin to significantly influence the adoption process. Further, as the levels of interaction evolve (to levels 3 and 4), the focus should be on social factors to enhance teamwork. In addition, statistical results indicated that companies answered the questions similarly, regardless of primary service offered, and whether or not the companies were design/build set-up (H2 and H5). The design/build outcome was not expected, especially if one argues that, in design/build companies, collaboration is made easier as everything is done under one roof with one large team. Further research is necessary to examine specific case studies to explore specific reasons to these findings. Meanwhile, statistical results showed that the level of interorganizational interaction positively correlates with both the BIM experience (H7), and company size (H8). Results of this study established a clear consensus of factors, spanning 13 interorganizational BIM literatures.