-
Paper Information
- Previous Paper
- Paper Submission
-
Journal Information
- About This Journal
- Editorial Board
- Current Issue
- Archive
- Author Guidelines
- Contact Us
International Journal of Construction Engineering and Management
p-ISSN: 2326-1080 e-ISSN: 2326-1102
2016; 5(4): 108-117
doi:10.5923/j.ijcem.20160504.03

Factors Affecting People Preferences toward Environment Landscape, Case Study: Shopping Mall in Kuala Lumpur
 Abstract
 Reference
 Full-Text PDF
 Full-text HTML
Ahmad Hami1, Fazilah Fazle2, Farzin Emami1
1Department Landscape Engineering, University of Tabriz, Iran
2Faculty of Design and Architecture, Universiti Putra Malaysia, Malaysia
Correspondence to: Ahmad Hami, Department Landscape Engineering, University of Tabriz, Iran.
| Email: |  |
Copyright © 2016 Scientific & Academic Publishing. All Rights Reserved.
This work is licensed under the Creative Commons Attribution International License (CC BY).
http://creativecommons.org/licenses/by/4.0/

This study focused on the influence of socio demographic factors on patrons’ preference for interior landscape of shopping mall. Three dimensions namely green, business, and seating dimensions were identified, besides the effect of gender, age, income, ethnicity, house type, and usual spent time on preference dimensions were tested. The results showed no significant between gender groups. The other factors such as age, income, ethnicity, house types, and spent time groups had significant different effect on people preferences towards the three dimensions in shopping mall. The findings showed as the age and income level go up people prefer green dimension more. In other word, younger visitors like to see more business features rather than green and seating features. In addition, the results portrayed that green features received the highest preference from those spend much time in shopping malls.
Keywords: Socio demographic Factors, Gender, Age, Ethnic, Income Level, House Types, and Interior Landscape Dimensions
Cite this paper: Ahmad Hami, Fazilah Fazle, Farzin Emami, Factors Affecting People Preferences toward Environment Landscape, Case Study: Shopping Mall in Kuala Lumpur, International Journal of Construction Engineering and Management , Vol. 5 No. 4, 2016, pp. 108-117. doi: 10.5923/j.ijcem.20160504.03.
Article Outline
1. Introduction
- Unlike western developed countries, developing countries in Asia such as Malaysia has started to establish mega shopping mall centres in the recent decades. However, the research on the understanding of patrons’ interaction with shopping mall interior landscape is lacked. However, a prior study revealed that demographic and social factors exert in forming environmental preferences [1]. This research motives to establish basic information regarding interaction of landscape attributes and human characteristics in shopping malls. Thus, the study aims to identify effect of the socio demographic factors on preference for interior landscape design in shopping mall. The research sub-questions to answer the objective is followed:1. Is there significant difference between gender groups toward interior landscape design in shopping mall in Kuala Lumpur, Malaysia?2. Is there significant difference between age groups toward interior landscape design in shopping mall in Kuala Lumpur, Malaysia?3. Is there significant difference between race groups toward interior landscape design in shopping mall in Kuala Lumpur, Malaysia?4. Is there significant difference between income groups toward interior landscape design in shopping mall in Kuala Lumpur, Malaysia?5. Is there significant difference between housing types groups toward interior landscape design in shopping mall in Kuala Lumpur, Malaysia?6. Is there significant difference between spent time groups toward interior landscape design in shopping mall in Kuala Lumpur, Malaysia?In this view, socio demographic factors those might influence preference for landscape are described in below.
2. Socio Demographic Factors Influence People’s Preferences towards a Particular Landscape
- Besides various factors such as the content and spatial quality of the scene which affect people’s preferences, there are also many other factors involved in determining these preferences towards the environment. Some researchers have found that different factors influencing people’s preference include the factors on culture or ethnicity [2-6]. The other factors identified include educational level [7-9], expertise [4, 9], income level [8, 9], gender [8, 9], age [8, 10]. All these are related to people’s background information, but there are also other factors which have significantly found to affect the people’s preferences such as the living environment [4], familiarity [9], housing density [9], and housing types [11]. Other than above-mentioned factors, Dearden (1984) carried out a study on the effect of environmental awareness, while Tips and Savasdisara (1986) studied on the effects of environmental background (urbanity, travel experience and macro-geographical background, etc.) towards preferences [12]. In their research on landscape preferences, there might be dual basic mod that would be useful to determine the influence of various factors towards landscape preference score [12]. The first mode involves the characteristics of landscape, the origin of the landscape scenes and the dimensional medium used for presentation, such as colours and the time the photos were shot. The researchers further added that the second mode was started from the interview and looking at background criteria to analyse their influences on the evaluation of one set of landscape view or its impact on preferences. The second mode is more important and much needed in landscape because it can help designers and architects to plan a setting based on people’s backgrounds, while the first mode can be controlled by researcher during photo preparation procedures. The next section discusses on several background factors that may influence people’s preferences.
2.1. Age
- Yamashita (2002), Oguz (2000) and Malinowski and Thurber (1996) found that age indeed does have influence on the preferences towards a particular landscape [8, 10, 13]. Malinowski and Thurber (1996) found that younger boys were more interested in places for particular activities, while older boys were more inclined to places for aesthetics and cognitive values [13]. According to Oguz (2000), the age of the respondents did impose an influence on the frequency of visits to the three parks included in his study and the choice towards the favourite park. The findings of the study by Hami et al (2009) also revealed that people in the age group between 19 and 29 years old (47%) and the age group of 30 to 39 years (29.4%) used the park more often compared to those in the other age groups [14]. The choices towards their favourite parks were also found to be influenced by the age of the respondents, whereby this was influenced by the kind of activities and services or facilities provided at the park. For example, Oguz (2000) indicated that the people in the age groups of 12 – 18 years and 19 – 14 years preferred mostly a park with complete miscellaneous facilities and activities, including sport activities [8]. However, the people in the age groups of 56 and above preferred park with good catering service and more natural green environment. Therefore, it was proven in the previous studies that different age groups preferred different settings but this was still related to the other aspects which exist in the environment. Understanding the differences in terms of age could therefore guide designers in creating public places for the different age levels with a pleasant surrounding or environment at shopping malls.
2.2. Gender
- The gender of the respondents (male and female) has also been speculated to have different needs and preferences in certain matters. On the other hand, Yu (1995) revealed that gender did not influence the people’s preference towards landscape though only a few differences were detected for the sceneries with water domination. This finding is almost similar to the ones found by Gwo-Fang (2002) who revealed that there were no significant differences between the male and female respondents in their presences towards the water element in interior spaces [2]. However based on the finding of Gwo-Fang research in 1999, the male respondents were found to be more eager towards water elements in interior spaces compared to the females [2]. Hami and his colleague stated that the male participants compared to the female were major park users in urban park in Tabriz [15, 16]. As a conclusion, the findings of these studies indicate that the effect of gender on the people’s preference towards a landscape remains unproven. Therefore, it was important for this study to look further into this issue as it might be useful in the planning of the interior public spaces at shopping malls in Malaysia.
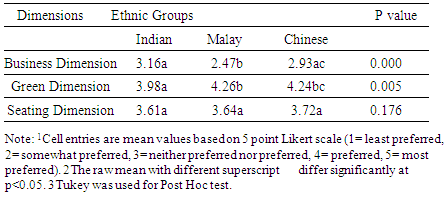
2.3. Ethnicity
- The difference in race and culture might contribute to different preferences because different races or cultures have different background, living environment and living styles. Nonetheless, Yu (1995) in his comparison, among a small group of Chinese and Americans regarding the variants in culture and preference towards landscape, found that a different sub-culture (East and West) was rather weak but it was very important for a number of specific landscapes which added special cultural meanings. Nevertheless, the findings by Fraser and Kenny (2000) on the cultural impact towards the perception of the urban forest in Canadian City were much different, whereby they found that certain community cultures showed different reactions towards a particular landscape and its elements. They also came to know that the British community showed a strong positive reaction towards shady trees and they were the only group which preferred hiking paths. This is in contrast with the findings gauged for Italians and the Portuguese community who had more preferences for fruit trees, vegetable gardens and showed a negative reaction towards having shady trees in their gardens. However, in the same study, the Chinese community was shown to react positively toward scenes without trees and that they preferred a park which required less maintenance and no trees in comparison to the other communities.There are a number of studies which show that people in same cultural group prefer foreign landscape style rather than their own. For instance, the studies by Yang and Brown (1992), and Yang and Kaplan (1990) revealed that both the Western and Korean groups preferred foreign landscape style (i.e. Japanese style) than their own styles [5, 6]. This finding seems to suggest that people do not prefer whatever is familiar to them in their own culture.
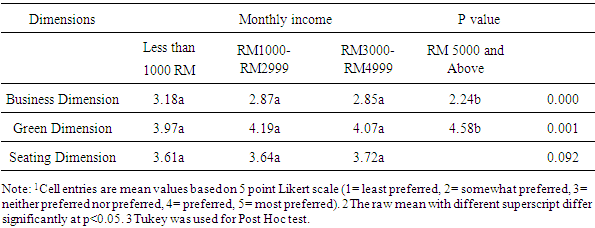
2.4. Income Level
- The respondents’ preferences and their responses towards an environment might also be influenced by their income level. For instance, in his study on the preferences towards the urban parks in Ankara, Oguz (2000) found that even each park was used by the people with different income groups, which obviously it was dominated by those of the lower-middle income groups in his study, and the people of different income groups’ preferred different parks or spaces [8]. People of the low-income group were found to prefer Genclik Park, which is classified as the oldest park and has a low quality of service, whereas those from the middle-income group were indicated to choose Altinpark and Segmenler Parks. The findings of his study also revealed that the people from the high-income group also preferred Segmenler Park, which possesses a more organized natural landscape, is well-maintained and with more greenery. Nevertheless, it is important to highlight that Genlick Park, Altin Park and Segmenler Park are surrounded by different housing areas; Genlick Park is surrounded a housing area which is owned by the people of the lowest income group, Altin Park is located in the middle-income neighbourhoods, while Segmenler Park is surrounded by houses of those from the upper income group. Based on Oguz’s findings, the income level had also been indicated as one of the factors which might influence people’s preferences [8]. In shopping malls, purchasing power is always determined by the level of income, but one aspect which should also be considered is the fact that different income groups may prefer different settings; the fact which can be used by designers and architects to plan indoor public spaces at shopping malls.
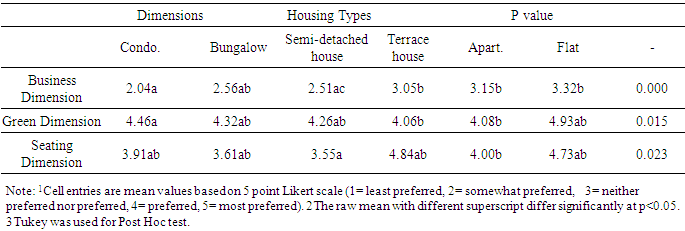
2.5. Current Housing Types
- Sullivan (1994) found that the participants’ current housing types significantly affected their preferences. The finding is supported by Dearden (1984) who found that the effect of housing density was significant in influencing people’s preferences. Dearden (1984) revealed that the participants who occupied a low-density housing environment preferred natural scenes and vice versa. The findings of Sullivan’s study also suggest that the participants who are currently living in single family house showed a significantly higher preference towards the ‘Large-Lot Category’ (scene which consists of houses, mature trees in the background and lacks of trees in foreground) as compared to the participants who are currently living in multiple family houses. For the purpose of this study, the effects of the participants’ current housing types would also be identified to provide a useful implication for the architects and developers in developing indoor public spaces at shopping malls. This is largely due to lack of research conducted on the influence of housing types on the people’s preferences in Malaysia. In fact, most of these malls are located in the urban areas, usually surrounded by low-cost and medium-cost housing types such as flats, apartments, single- and double-storey houses. Meanwhile, the malls which were built in the city centre (especially in Kuala Lumpur city centre) are surrounded mostly by the medium-cost to high-cost housing types, such as single and double-storey houses, semi-detached, bungalows and condominiums. Apart from these, another possibility which could be taken into consideration is that the users of certain malls mostly of those who own certain housing types in the areas where the malls are located. Based on this discussion, it might be useful for designers to plan and design public spaces in malls based on housing types of the people.
3. Research Method
- The research was held by doing a photo- questionnaire among 240 participants who visit shopping malls in Kuala Lumpur, Malaysia. 204 respondents were selected by using Mitra and Lankford (1999) formula explaining that sampling error = Square root of [(p) (1-p)/proposed sample size], where p is the probability which condition exists, p value is assumed to be 50% [17] Regarding to the photos, after selecting 32 photographs, four extra photographs were then added at the beginning and another four photographs at the end of the photo sequence. The purpose of having four extra scenes at the beginning was to make the participants familiarise the photo rating procedure, whereas the four extra photos at the end of photo-questionnaire was to prevent the participants from anticipating, which could cause them to make it easier [17, 18]. The reliability analysis demonstrated that all the reliability indices for each category are higher than 0.7 as minimum value and any item with value below 0.3 should be removed from the category.
4. Results
- The data analysis revealed three dimensions for interior landscape design in shopping mall namely green, seating, and business dimensions. The results of data analysis also showed that gender groups didn’t have significant mean difference towards preference dimensions for interior landscape design in shopping mall. However, there was significant differences towards preference dimensions among the other socio demographic factors such as age, income level, ethnic, current housing types, and spent time in the mall. More details about these results are explained in the below paragraphs.
4.1. Preference for Interior Landscape Dimensions of Shopping Mall
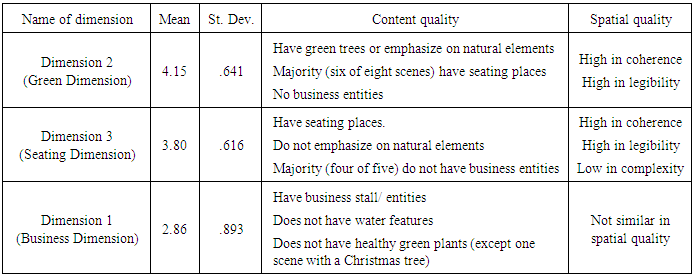
- The purpose of this analysis is to identify the magnitude of preference in shopping mall landscape dimension. From table 1, the green dimension has the highest mean (mean = 4.15, s.d. = .641), followed by seating dimension (mean= 3.80, s.d.= .616), and business dimension (mean= 2.86, s.d.= .893). The business dimension has the lowest mean because it only highlights the businesses in the public spaces at shopping malls. On the contrary, the green dimension has the highest mean and all scenes in this dimension show high coherence and high legibility. The green dimension also has natural elements especially plants, water features, and seating places. The seating dimension, which somehow emphasized on the interior landscape elements for the customers especially in the form of seating places, received moderate mean score.
|
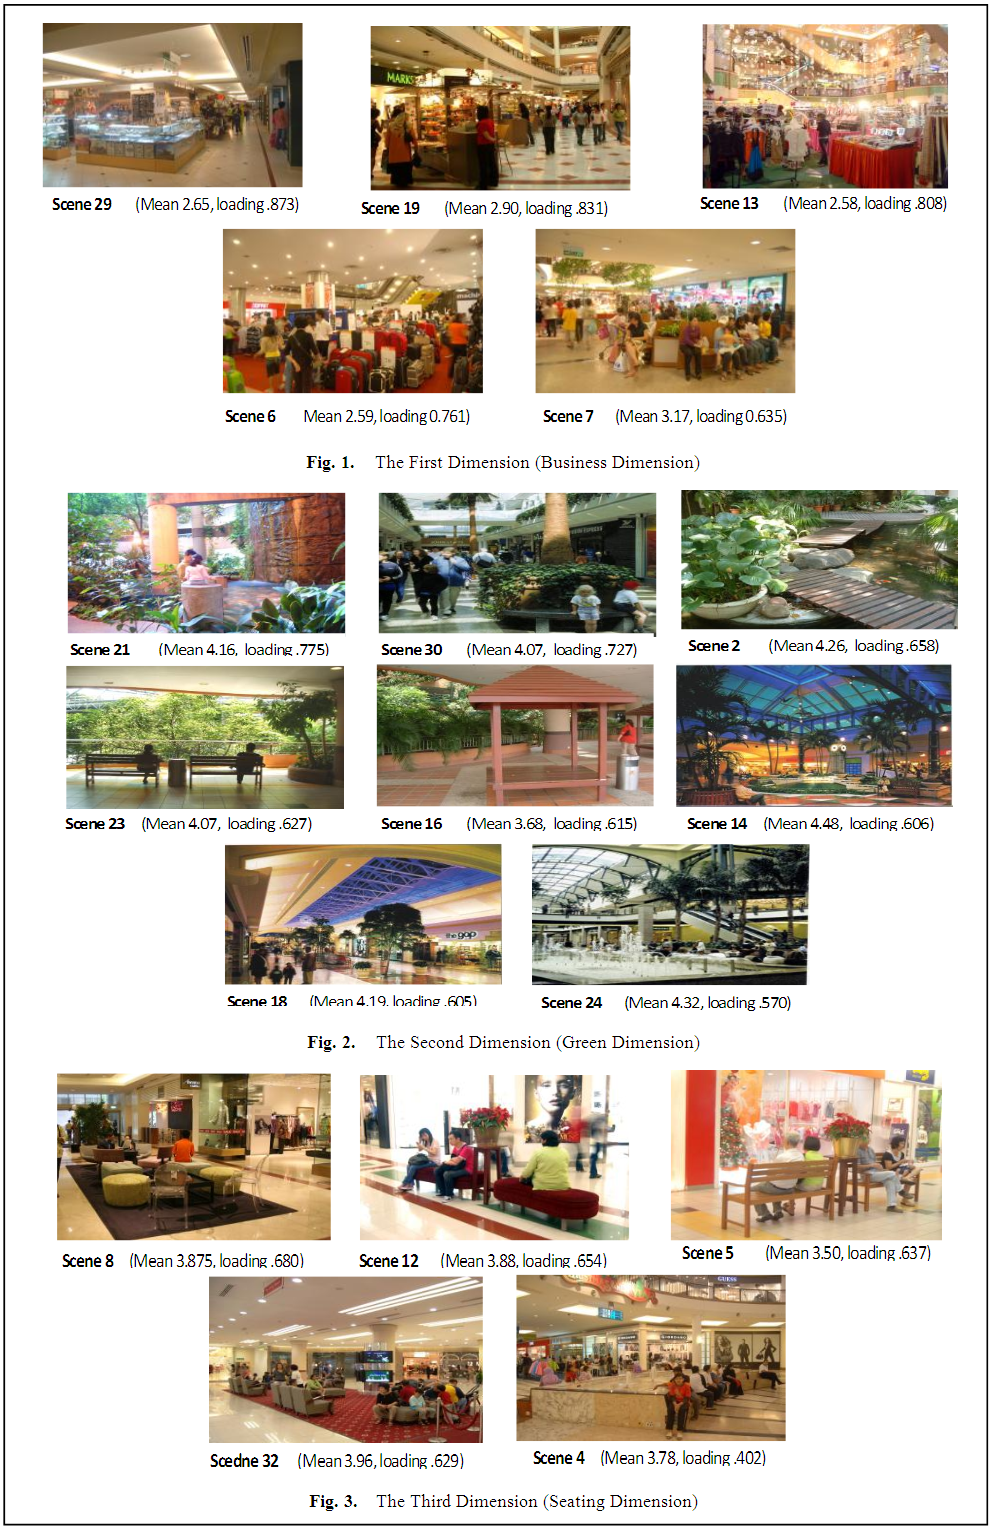 | Figure 1. Mean values for components of three dimensions |
4.2. Participants’ Background Information
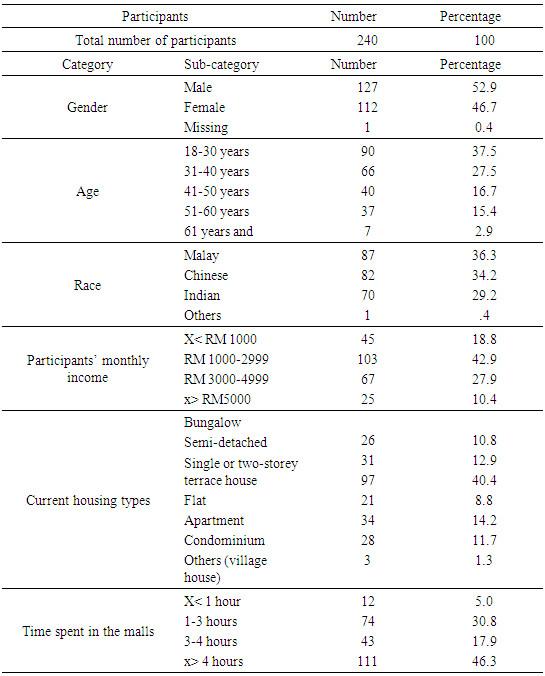
- The participants for this study have various backgrounds in terms of gender, age, ethnicity, monthly income, and current housing types. Table 2 shows that 240 participants were involved in this study. There are 127 males (52.9%) and 112 females (46.7%), while one participant missed to indicate the gender. Most of the participants are in the age group of 18 to 30 years (n = 90, 37.5%), followed by 31 to 40 years (n = 66, 27.5%), 41 to 50 (n= 40, 16.7%), and above 50 (combined groups of 51-60 and above 60 years old) years old (n= 44, 18.3%). Generally, majority of the participants are between 18 to 50 years old (table 2).
|
4.3. Effect of Socio demographic Information on Shopping Mall Interior Landscape Dimensions
- The part analysed the impact of the various participants’ backgrounds on three preference dimensions namely green, seating, and business dimensions. The independent t-test was applied to identify the impact of gender on each preference dimension while one-way between groups ANOVA was applied to identify the impact of age, ethnic groups, monthly income, and current housing types on the visual preference in each dimension.
4.4. Effect of Age on Shopping Mall Interior Landscape Dimensions
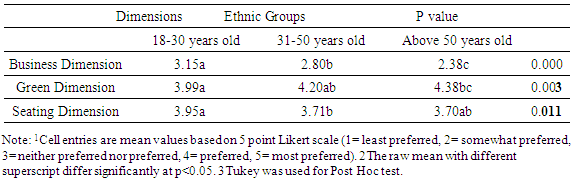
- 1. Is there significant difference between age groups toward interior landscape design in shopping mall in Kuala Lumpur, Malaysia?All dimensions showed significant differences among the age groups. As summarized in Table 3, Business dimension (using Welch test) showed a significant difference at p< .05 followed by green dimension F (2, 237) = 6.079, p < .05 and Seating dimension F (2, 237) = 4.595, p < .05 showed significant differences. This result concurred with Yamashita’s (2002), Oguz’s (2000) and Malinowski and Tuber’s (1996) which stated the age of the participants did affect their level of preferences [8, 10, 13].
|
4.5. Effect of Ethnic Groups on Shopping Mall Interior Landscape Dimensions
- 2. Is there significant difference between ethnic groups toward interior landscape design in shopping mall in Kuala Lumpur, Malaysia?Table 4 shows only business and green dimensions which showed significant mean difference for ethnic group, p <.05, while, there was no significant difference between ethnic group for seating dimension at p > .05.
|
4.6. Effect of Monthly Income on Shopping Mall Interior Landscape Dimensions
- 3. Is there significant difference between income groups toward interior landscape design in shopping mall in Kuala Lumpur, Malaysia?Table 5 shows there was a statistically significant difference between income levels towards business dimension p < .05, and green dimension F (3, 236) = 5.615, p < .05, however, there was no significant difference for seating dimension F (3, 236) = 2.168, p > .05.
|
4.7. Effect of Current Housing Types on Shopping Mall Interior Landscape
- 4. Is there significant difference between housing types groups toward interior landscape design in shopping mall in Kuala Lumpur, Malaysia?From one-way analysis result, as stated in Table 6, all three dimensions showed statistically significant differences at the p < .05 level of significance in visual preference scores for the current housing types being studied.
|
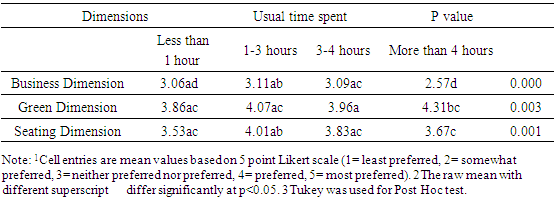
4.8. Effect of Usual Time Spent in Malls on Shopping Mall Interior Landscape Dimensions
- 5. Is there significant difference between spent time groups toward interior landscape design in shopping mall in Kuala Lumpur, Malaysia?As shown in Table 7, from the one-way analysis, time spent category showed significant differences with all dimensions namely business dimension at p < .05, followed by green dimensions F (3, 236) = 4.690, p < .05 and seating dimension F (3, 236) = 5.604, p < .05.
|
5. Findings and Conclusions
- The results exposed that only gender groups did not affect their visual preferences of the interior public spaces at shopping malls. This study found that the participants’ age, monthly income, ethnicity, current housing types and usual time spent in the malls significantly affected the subjects’ preferences in two different extremes (the most and the least preferred dimensions). However for the seating dimension, only the age of the participants, their current housing types and the usual time spent in the malls significantly affected their preferences. One of the main findings of the study showed that the mall’s indoor space in Kuala Lumpur is a place where the public spend their time. The findings revealed that the greatest percentage (46.3%) of the participants spent more than four hours during each visit to the malls compared to the others. Nevertheless, besides those who spent their time in the mall, the most important thing was the participants’ usual time spent in the malls significantly affected their visual preferences. Those participants who spent more than four hours in the malls preferred the green dimension better than the business dimension. It can be argued that people consider shopping mall not only for buying needs and goods but as public space that they can spend weekend leisure times. Therefore, green and seating dimensions might play important role in providing comfortable and joyful venue for visitors.
5.1. People’s Age Matter
- The age factor is a critical issue in this study because the analysis of the participants’ background showed that few elderly participants utilized the malls (18.3% for the category of 51 years and above) and most of the malls’ users were dominated by those in 18 to 30 years and 31 to 50 years groups. In this study, even though the results generally stated that the most preferred dimension was Green Dimension and the least preferred dimension was Business Dimension, the magnitude of preferences were different in relation to age. Older participants preferred the Green Dimension more than the Business Dimension. The study revealed that, as the participants’ age increased, their preferences towards the Green Dimension would also increase. However, their preferences towards the Business Dimension would decrease as they aged. Based on this evidence, it could be assumed that the older participants less utilise the malls since the current conditions of the malls did not provide the interior public spaces with a comfortable environment. They may want a better condition of public spaces in malls because of their age; they might become tired easily, thus need the interior public spaces, which could help them to relax physically or psychologically. The finding was supported by previous research who studied a big scale multipurpose centre [21]. Their research identified that the elderly needed special condition as they sat the longest in seating places (mean = 11.2 minutes), followed by the teenagers (mean = 6.8 minutes) and the children (mean= 10.2 minutes) [21]. Therefore, this required the malls’ designers and architects to plan and design the interior public spaces with great consideration to the elderly customers.
5.2. Designing the Interior Public Spaces for People of All Ages
- A great consideration is needed in designing public spaces that can cater to everyone’s need regardless of the age. The results of this study also suggested that all the participants showed similar preference to the Green Dimension of the environment in public spaces at malls but their magnitude in each dimension differed. In order to develop a mall in certain areas, the mall’s architects must work together with the policy makers, town planner and the other parties to identify the customers’ age. Based on the above discussion, before planning and designing a mall, a series of survey must be conducted at new malls development areas especially based on the people’s age. They should accentuate the best quality of interior public spaces in areas where many older generations are found as the customers. However, since the findings showed that all participants preferred a green environment and certain interior landscape elements, which contribute to form a comfortable venue, the architects and mall designers should plan such areas in every mall’s indoor public spaces. This will also provide an opportunity for the public from all age groups to enjoy themselves at the comfortable public spaces, thus influence them to spend their time at the mall. The results of this study verified that the participants’ backgrounds (especially age, which became a critical issue in this study) gave an impact on their visual preferences. Therefore, it might be necessary for the designers and mall architects to plan and design the malls’ public spaces upon considering that the public who utilise the spaces come from various age groups.