-
Paper Information
- Paper Submission
-
Journal Information
- About This Journal
- Editorial Board
- Current Issue
- Archive
- Author Guidelines
- Contact Us
International Journal of Construction Engineering and Management
p-ISSN: 2326-1080 e-ISSN: 2326-1102
2016; 5(2): 55-64
doi:10.5923/j.ijcem.20160502.03

Development of a Model for Estimating the Duration of Bridge Construction Projects in Ghana
 Abstract
 Reference
 Full-Text PDF
 Full-text HTML
Isaac Mensah , Gabriel Nani , Theophilus Adjei-Kumi
Department of Building Technology, College of Art and Built Environment, Kwame Nkrumah University of Science and Technology, Ghana
Correspondence to: Isaac Mensah , Department of Building Technology, College of Art and Built Environment, Kwame Nkrumah University of Science and Technology, Ghana.
| Email: |  |
Copyright © 2016 Scientific & Academic Publishing. All Rights Reserved.
This work is licensed under the Creative Commons Attribution International License (CC BY).
http://creativecommons.org/licenses/by/4.0/

Duration estimation for bridge projects is problematic in the construction industry and has generated much concern. The purpose of this study is to develop a working model for estimating the duration of prefabricated steel bridge projects on rural roads in Ghana. Data for 18 completed bridge construction projects were collected from the Department of Feeder Roads. The data collected comprised of final payment certificates which included quantities of all work items completed under each project as well as the actual durations. Data relating to the prefabricated steel bridge components for each of the selected project were also collected through a questionnaire. The principal component analysis (PCA) was first employed to reduce the data to a smaller number of items, namely the bridge span and formwork as independent variables/items. The artificial neural network (ANN) was then used to develop the model using the two independent items as input variables and the actual durations as output variables. The results show that the duration of a bridge project is strongly related to the bridge span and the formwork used for the reinforced in-situ concrete. The developed model produced accurate results with a coefficient of determination (R2 =0.998) and MAPE of 4.05% or an average accuracy of 95.95% at the validation stage. The study has shown that the developed model is suitable for estimating the duration of a bridge project.
Keywords: Duration, Principal Component Analysis, Artificial Neural Network, Bridge Projects, Ghana
Cite this paper: Isaac Mensah , Gabriel Nani , Theophilus Adjei-Kumi , Development of a Model for Estimating the Duration of Bridge Construction Projects in Ghana, International Journal of Construction Engineering and Management , Vol. 5 No. 2, 2016, pp. 55-64. doi: 10.5923/j.ijcem.20160502.03.
Article Outline
1. Introduction
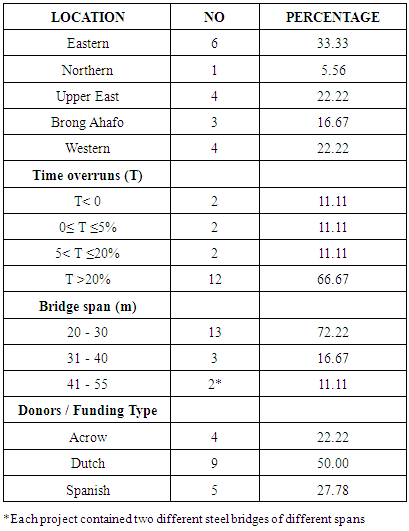
- During the last decades, demand for small span bridges has increased drastically in Ghana simply because rivers and streams have routinely cut off access to the main roads for villages. This has prevented the rural folks from accessing health care and transporting farm produce to the market centers. The Department of Feeder Roads which is the agency responsible for the construction of bridges on rural roads in Ghana and its development partners teamed up to provide prefabricated steel components for the construction of bridges in the country. The development partners mainly provided the prefabricated steel components for the bridge superstructure whilst the Ghana Government took care of the other civil works. However, estimating the contract duration for these bridges by professionals at the agency has been a problem resulting in most of these bridge projects experiencing time overruns. Duration overrun is problematic in the construction industry and has generated much concern [20]. In view of this, numerous studies have been carried out all over the world to determine the duration for building and road construction projects (see [18], [16], [10], [22], [6], [27], [20], [23], [34], [3]). However studies in the area of bridge construction projects are limited as a search by the authors revealed only four conducted by [19], [14], [17] and [12]. As a result [34] in his study recommended for studies to be conducted in the area of duration determination for bridge construction projects. The Government of Ghana, its donor partners and other stakeholders for rural bridge construction projects are dissatisfied with time overrun on bridge projects in the country. Of the 18 projects selected for this study, 12 of them representing 67% experienced a time overrun beyond 20% (see table 2) suggesting that a tool needs to be developed for the implementing agency to reasonably estimate duration for such specialized work. The aim of this study therefore is to develop a working model for predicting the duration of bridge construction projects after the design of the bridge is completed and a bill of quantities have been prepared.
2. Literature Review
- A literature search for studies conducted in the determination of duration for bridge projects revealed only [19], [14], [17] and [12]. In the study by [19] project factors that influenced the duration of bridge projects were identified. 416 bridge projects from the North Carolina Department of Transportation were analyzed and a regression model was developed. Their study revealed a mean absolute percentage error of 21% at the validation stage.[14] developed models for highway and bridge construction projects in the state of Indiana in the United States. The variables used in the developed models were the anticipated project cost and the contract type. They indicated that the developed models can help project administrators provide improved estimates of project duration at the planning stage and thus reduce project time delays.[17] developed time -cost models for bridge replacement, bridge rehabilitation and highway projects for the Indiana Transportation department in the United States. [22] also developed both regression and artificial neural network (ANN) for small span bridges. They indicated that the developed ANN model is superior to estimating the duration of bridge projects as compared to the regression model. [12] used the concept of quantity significant items to develop integrated models for the determination of cost and duration for reinforced concrete bridges. [12] used the Critical Path Method (CPM) for duration determination using work operations of the quantity significant items.Unlike bridges, a number of studies for predicting duration for building and roads have been carried out by researchers. [3] derived a model, which predicted construction duration T = KCB where T is the duration of the construction period from date of site possession to practical completion, in working days, C is the final cost of building, K is a constant describing the general level of time performance and B is a constant describing how the time performance is affected by project size, as measured by cost. [18] developed a case based reasoning (CBR) model for estimating the duration of building projects using 83 multi housing projects. Their test results confirmed the strong potential of the applicability of the CBR model with minimum information at the preliminary stage. Another recent study by [16] confirmed Bromilow’s model in Kuwait using 113 residential and 74 office buildings. [16] further developed a multiple regression model using construction area (CA), number of floors above ground (NFAG) and number of floors below ground (NFBG) as determinants. [10] developed a multiple regression model for predicting the duration for building projects in Nigeria using data for 96 completed projects. [26] developed an artificial neural network to forecast the final budget and duration of highway construction projects in Thailand using data for 51 highway construction projects between 2002 and 2007. They found that the developed ANN model (with a mean absolute percentage error of 8.51%) forecasts the duration for highway projects better than the current earned value method (with a mean absolute percentage error of 19.90%).[6] used the simple regression model to 100 sampled road projects completed between the periods 2003 to 2008 in southwestern Poland to predict duration. [27] used the linear regression and artificial neural network to develop models for the prediction of duration of building projects in Bosnia and Herzegovina using data for 75 building projects with good predictive ability (Coefficient of determination, R2 = 0.97) and mean absolute percentage error of 2.5%.[34] identified the project factors which influence highway construction duration early in the design development. His work quantified the relationship between the duration-influential factors and highway construction duration using statistically significant relationship and developed a regression model for highway projects. From existing literature, only four studies have been done for bridges which are considered to be a specialized area. The study by [19] is limited to the preconstruction stage and the independent variables used are totally different from that used in this study which is mainly the quantities of work items in payment bill of quantities. It has been suggested that the duration of a project depends more on the quantities of work items rather than its costs [12]. Therefore this study uses the quantities of work items executed in final payment certificates as independent variables. Since the independent variables used in this study are known to the agency before a contract is let, it is expected that professionals at the rural road agency can apply the model in predicting the duration for bridge projects in the country.
3. Research Methods
3.1. Data Collection
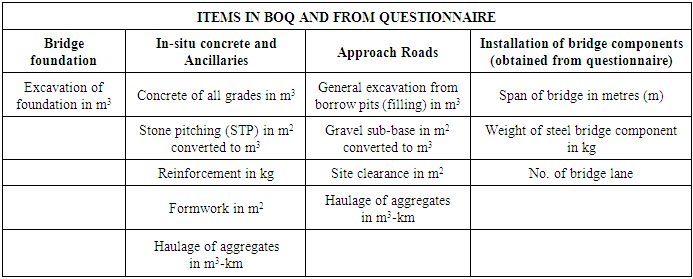
- Five of the Regional offices of the Department of Feeder Roads were contacted to provide information on bridge projects completed in their regions. One of the authors was part of the team who managed six of the selected bridge projects in one of the regions. The regions were Eastern, Western, Brong Ahafo, Northern and Upper East. Data for eighteen (18) bridge projects completed from 2008 to 2014 were provided. The data collected were final payment certificates including bill of quantities (BOQ) of work items at 100% completion. The data on the payment BOQ extracted are as shown in Table 1. Other information available were the start date, intended completion date and revised completion dates. Data on the steel bridge components were in amounts (sums) in the BOQ. Therefore data pertaining to the bridge components in the form of bridge weights, bridge spans and bridge lanes were not available from the regions. As a second step, a questionnaire was designed to solicit this information for the eighteen selected projects at the bridge section of the Department of Feeder Roads in Accra, Head office. The information requested for in the questionnaire include the total bridge span (ranging from 20 – 54m), weights of the steel components and the total number of lanes of the bridge components for each of the eighteen (18) selected bridge projects.
|
3.2. Data Preparation
- It was necessary to prepare the data to enable the neural network recognize patterns in the dataset. The categories in the payment BOQs were the Bridge foundations, In –situ Concrete and its Ancillaries, Approach Roads and Bridge components. Before the analysis of the collected data, items in the BOQ which were similar in nature but were measured in different units were converted to the same unit [29], [12]. As an example, gravel sub-base which was measured in square meter in the payment BOQ was converted to cubic metre by multiplying the superficial values by the thicknesses specified in the item description. This is because under the category of Bridge foundations and Approach roads, items such as excavation of foundation, excavation for inlet and outlet channels for culverts and excavation from borrow pits are all measured in cubic meters. For projects which had concrete U culverts which served as reliefs to the main bridge, these concrete U culverts in linear meter in the payment BOQ were converted to cubic metres. These linear items were inclusive of excavation of the culverts, formwork and reinforcement in the item description. The associated ancillaries such as formwork and reinforcement were computed for each of the selected projects. These computations were done using an excel spreadsheet containing taking – off of all the drainage structures used by the Department of Feeder Roads (i.e. rural road agency). The total volume of in-situ concrete in m3, total formwork in m2 and total reinforcement in kg for each project were then obtained by adding the volumes of all in-situ concrete of all grades, formwork in m2 and reinforcement in kg respectively. The total volume of concrete also included the volume of stone pitching which was measured in m2 in the BOQ but converted to m3 by simply multiplying the superficial quantity by the thickness of stone pitching in the item description. The total haulage for each project was also obtained by adding all the haulages in m3 -km under each work category. In two (2) out of the eighteen (18) projects, there were two steel bridges that were completed under each contract. For such contracts, the spans, weights and lanes of the bridge components were added together to arrive at the total span, weight and number of lanes which were then used for the analyses. The actual completion dates for each of the bridge projects were also obtained. Table 2 shows the characteristics of the bridge projects selected for this study.
|
3.3. Data Analysis and Discussion of Results
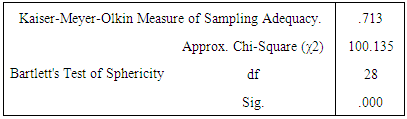
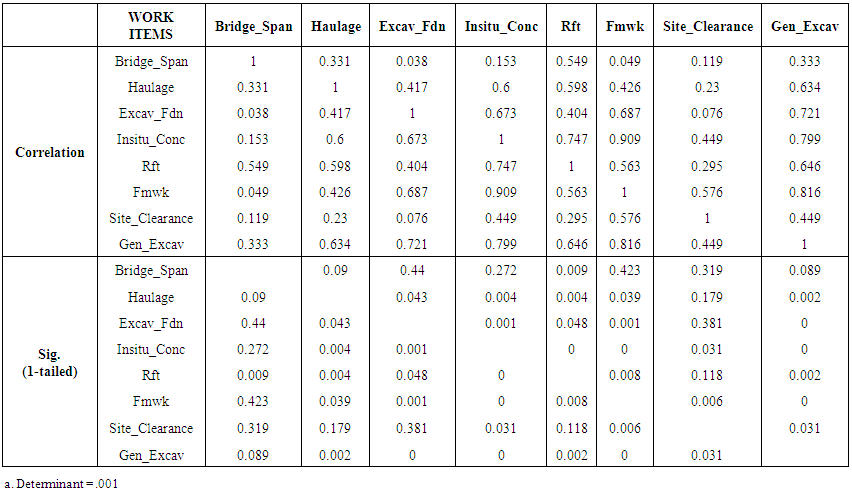
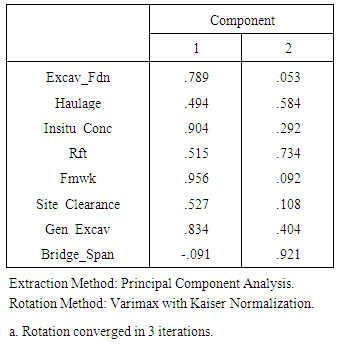
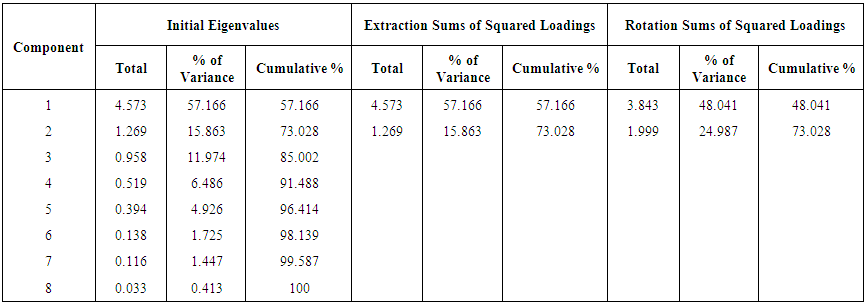
- The principal component analysis (PCA) was employed in this study to determine the significant items which can be used for model development and in detecting multicollinearity which is likely to be present within the dataset. Multicollinearity is a situation where the correlations among the independent variables (quantities of work items) are strong. When two variables are correlated, they essentially convey the same kind of information. From table 1, it was obvious that some items such as bridge weight, bridge span and bridge lane are correlated since they convey the same kind of information (i.e the steel bridge component). As opined by [35], variables that have issues with multicollinearity should be removed from the dataset. Therefore a preliminary analysis was carried out by running a correlation matrix with the aid of SPSS version 17 to detect and remove highly correlated quantities of work items. Because of space, the correlation matrix is not presented here. Work items, such as bridge weight, bridge lane and sub-base determined to have high correlations were removed after the thorough preliminary analysis to ensure that multicollinearity is eliminated or reduced within the datatset. The resulting correlation matrix after elimination is shown in table 4. After the elimination of correlated variables, the principal component analysis (PCA) was performed using the following steps: (i) Testing for the appropriateness of using PCA and extracting the principal components, (ii) Establishing that the determinant (R) of the resulting correlation matrix (table 4) must be greater than 0.00001[8] and (iii) selecting the significant quantity of work items as input variables for the development of the model. From table 4, the determinant R = 0.001 > 0.00001 satisfying one of the criteria. The KMO and Bartlett’s test of sphericity is another criterion to be met. Kaiser (1974) as cited in [8] recommends values greater than 0.50 as acceptable. From table 3, the KMO value of 0.713 > 0.50 satisfying the KMO sampling adequacy criterion.The Bartlett’s measure tests the following hypothesis: Null hypothesis (Ho): All correlation coefficients are zero and the alternative hypothesis (H1): All correlation coefficients are not zero. This hypothesis is tested using the significance test (i.e.) whether the significant value is less or greater than 5% level of significance. If the Bartlett test is significant (that is p < 0.05, then Ho is rejected and H1 accepted).
|
 | Table 4. Correlation matrix after preliminary analysis to eliminate correlated variables |
|
 | Table 6. Total variance explained |
|
4. Neural Network (NN) Development
- Before the development of the model, a brief background and the reasons for its application in this study is made.
4.1. Brief Background of Neural Network
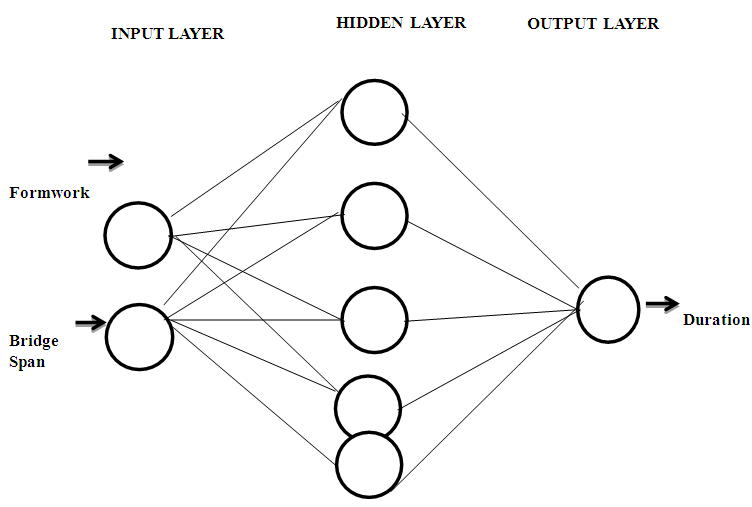
- The neural network is an artificial intelligence which consists essentially of many interconnected but artificial neurons which weighs, sums and threshold incoming signals to produce an output [33]. The ANN makes use of processing units which are connected by links with the processing unit grouped into three main layers, namely input layer, hidden layer and output layers [2]. The input layer receives information from the outside world (which in this study is bridge span and formwork) with the hidden layer serving the purpose of creating an internal representation of the problem. The output layer gives solution to the problem through activation functions (such as identity, sine, tanh and exponential) and corresponding weights by offering a more accurate prediction which is the target duration (see figure 1). The architecture in figure 1 which is a multi-layer perceptron (MLP) with a back propagation feed forward network has 2 input neurons, 5 hidden neurons and 1 output neuron which is duration in this case.
 | Figure 1. Model architecture of a neural network |
4.2. Reasons for Application of Artificial Neural Network
- The artificial neural network (ANN) has proved to have successfully provided solutions to many engineering problems. The network is able to solve complex or non –linear problems [28] and have gained popularity in construction management and engineering. The neural network has been found to produce better results or has a better accuracy than regression techniques ([28], [31]). Unlike the regression techniques, the ANN does not make prior assumptions about the distribution of the data or the form of interactions between factors [31]. The neural network is robust, has the ability to adapt to unknown datasets and has a good learning capability [15]. In view of the suitability of the neural network, a number of studies have been carried out using the ANN technique. [21] developed an ANN model for predicting the duration for new software projects. [30] used the neural network to develop a cost estimating model for rubberized asphalt pavement rehabilitation projects in the United States. [27] used the ANN to develop a model for estimating the duration for building projects in Bosnia Herzegovina.[29] also used the ANN for developing cost estimating models for utility projects in the USA. [28] also used the ANN to develop a cost estimating model for road tunnels in Greece. There seems to be a general consensus among researchers about the appropriateness of the ANN technique in predicting dependent variables. According to [28], the ANN model has a superior forecasting performance. This study therefore uses the ANN technique in the determination of a dependent variable which is duration in this case.
4.3. Training of the Developed Network
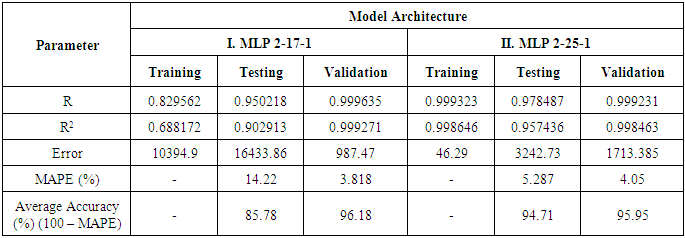
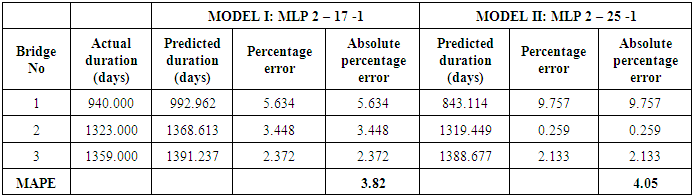
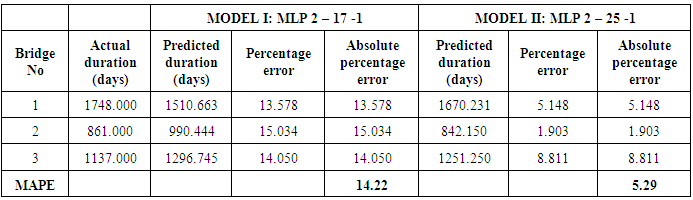
- The statistica software release 8 was used in developing the network. Before training the neural network (NN), the data splitting method was employed. 60% of the dataset were used for training the network, 20% for testing while the remaining 20% was used for validation. This ratio was adapted from [29] as well as [32]. This means that 12 projects were used for training and the remaining 6 projects were set aside for testing and validation, 3 in each case. The dataset used for the testing and validation were randomly selected by the statistica software to prevent modeling biases. The two independent variables/items, bridge span and formwork determined as the significant items were used as input variables with the actual durations of each of the projects as the target or output variables.The number of neurons in the hidden layer was obtained by trial and error. The automated network search (ANS) of the statistica software was used in order to select the most appropriate architecture for the dataset. Two of the networks with a feed forward back propagation algorithm were developed. The results showing the correlation coefficient (R) and determination (R2), the mean absolute percentage error (MAPE) obtained from tables 9 and 10 as well as average accuracies of the two networks are shown in Table 8.
|
4.4. Testing and Validation of Developed NN Models
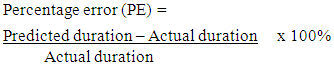
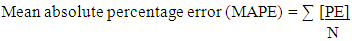
- The process of determining the degree to which a developed model is an accurate representation of the real world from the perspective of the intended uses of the model is termed validation. The validity of a model is usually assessed in terms of predictive accuracy [4]. That is the predicted values obtained from the developed model are compared with the actual observed values to verify the predictive efficacy [5]. To further confirm the predictive value of the model as shown in table 8, the 6 projects which were set aside for testing and validation and not used in the development of the models were used at this stage. This idea was adopted from [4] as well as [5] Tables 9 and 10 summarize the comparison of the observed (actual) values from the collected dataset and the predicted values generated from the developed network models at the validation and testing stages respectively. Two measures of accuracy dealing with percentage error were used to compare the forecasting performance of the model. The percentage error (PE) and the mean absolute error defined by [9] are:
 | (1) |
 | (2) |
|
|
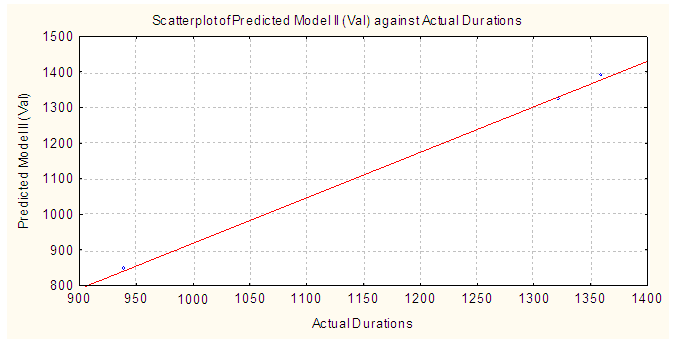 | Figure 2. Predicted versus actual durations for model II at the validation stage |
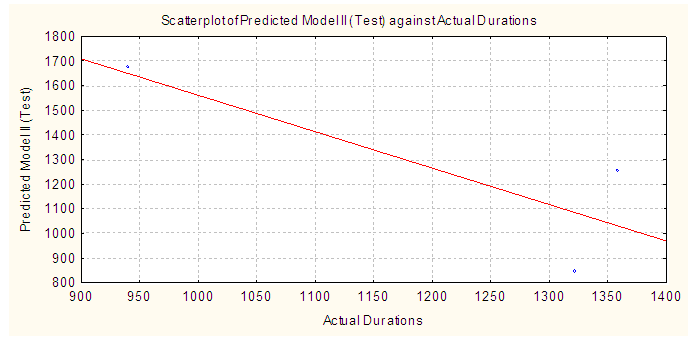 | Figure 3. Predicted versus actual durations for model II at the testing stage |
5. Limitation of Study
- The sample size was small as the rural road agency had limited number of completed bridge projects at the time of this research. However, some of these bridge projects are still on –going and since the study is an on-going one, it is expected that additional data will be obtained in order to improve the predictive ability of the model. Apart from the above limitation, the duration of a construction project is affected by several factors apart from quantities of work items. According to [13] and [24], there is a relationship between the attitude of the workforce and management practices to the duration of a construction project. This study is however, limited to the relationship between duration and quantities of work items in a BOQ. It does not incorporate the implications of other likely factors that can influence the total time required for the completion of bridge construction projects.
6. Conclusions
- The duration of a bridge project should be estimated reasonably by the professionals at the Department of Feeder Roads in order to avoid time overruns and deduction of liquidated and ascertained damages from contractors. The duration of bridges can be determined or estimated based on the quantum of work involved and the complexity of the project. The primary contribution this study makes to the body of knowledge is that the duration of a bridge can be estimated from only two work items, the span of the steel bridge components and the quantity of formwork in a BOQ. This study used these two items to develop a working model which can be used by the agency to reasonably estimate the duration of a bridge construction project with an MAPE of 4.05%. As illustrated in this study the actual durations of the validation set were very much consistent with the predicted durations indicating that the developed models are useful for predicting the duration of new bridge projects. All that is required for the application of this model is for the duration estimator to obtain the total quantity of formwork in a BOQ of a new project. Together with the bridge span of the prefabricated steel component, the duration of a new bridge project can be obtained by deploying the developed neural network. The study has shown that the best neural network is the multi-layer perceptron with an architecture 2-25-1. The approach used in the study can be employed by professionals in other countries to develop a tool for estimating the duration of bridge projects in their countries. It is the hope of the authors that professionals at the Department of Feeder Roads would use the developed model to estimate the duration of bridge projects.