-
Paper Information
- Next Paper
- Paper Submission
-
Journal Information
- About This Journal
- Editorial Board
- Current Issue
- Archive
- Author Guidelines
- Contact Us
International Journal of Construction Engineering and Management
p-ISSN: 2326-1080 e-ISSN: 2326-1102
2015; 4(4): 95-105
doi:10.5923/j.ijcem.20150404.01
Predicting Cost Overrun in Construction Projects
 Abstract
 Reference
 Full-Text PDF
 Full-text HTML
A. M. El-Kholy
Civil Engineering Dept., Faculty of Engineering, Beni-Suef University, Beni-Suef, Egypt
Correspondence to: A. M. El-Kholy, Civil Engineering Dept., Faculty of Engineering, Beni-Suef University, Beni-Suef, Egypt.
| Email: |  |
Copyright © 2015 Scientific & Academic Publishing. All Rights Reserved.
Two models for predicting cost overrun percentage in construction projects are presented. The first model based on regression analysis. 44 factors that impact cost performance in construction projects gathered from literature. A questionnaire survey was made on construction contractors in Egypt to evaluate the relative importance of these causes from contractors' perspective. Eleven factors were obtained as the most significant causes that lead to cost overrun and these are the independent variables of the proposed model. Data was collected for occurrence of the previous factors on yes/no basis and the corresponding cost overrun percentage (dependent variable) for 30 construction projects and was divided into two sets. The first set contains 20 projects for model building. The results revealed that there is a strong linear relationship between cost overrun percentage and the previous 11 causes that significantly affect cost overrun of projects. These causes are: financial condition of the owner, cash flow of contractor, method of procurement (open tender or selective tender), material cost increase due to inflation, competition at tender stage (aggressive or not), fluctuations in the currency that the payment will be made, project size (small or large), delay in design and approval, risk retained by client for quantity variations, drawings (detailed or not), and inaccurate material estimating. The second set contains 10 projects for validation purposes. The second model is a case based reasoning (CBR) model. CBR method can be an effective means of utilizing knowledge gained from past experience to estimate percentage cost overrun in construction works. Validation of the two models using projects of the second set revealed that regression model has prediction capabilities higher than that of CBR model. Applying the absolute value of standardized coefficient (β) as attribute weight method provides the highest prediction accuracy of cost overrun percentage. Also, feature counting gives results better than the original value of (β).
Keywords: Regression Analysis, Questionnaire Survey, Construction Projects, Case Based Reasoning Model
Cite this paper: A. M. El-Kholy, Predicting Cost Overrun in Construction Projects, International Journal of Construction Engineering and Management , Vol. 4 No. 4, 2015, pp. 95-105. doi: 10.5923/j.ijcem.20150404.01.
Article Outline
1. Introduction
- The accuracy of early cost estimates in engineering and construction projects is extremely important to both owners and project teams [1]. Decision making in the early stage of a project has a significant impact on the project. To evaluate alternatives, quick and accurate decision making is needed under a limited definition of scope and constraints in available information and time [2]. However, limited and uncertain information on the project and a complex correlation among various factors that affect the project's construction cost makes it difficult to predict and manage pertinent task [3]. Several studies have attempted to determine the factors creating risk for construction projects. [4], has conducted a survey to study the risk attitudes of large U.S. construction firms. Among the 23 risk factors included in this survey, labor, equipment and material availability, labor and equipment productivity, defective design, changes in work, differing site conditions, safety, delayed payment on the contract, and quality of work were presented as risks with high importance. [5] focused on the contract related factors which play an important role in the allocation of risks between the owner and the contractor. [6] explained that country risk rating, material availability, type of contract, advance payment were the major factors mpacting contingency decisions of the contractors. [7] developed a multivariate regression model to predict cost estimate accuracy for capital projects. The previous studies used various methodologies to solve the problem of predicting construction cost, cost contingency, and cost overrun for construction projects. Some of the methods used in the previous studies include:• Statistical methods such as multiple regression analysis (MRA) for predicting construction cost [8-10]. [11] presented a regression model for predicting cost overrun of reconstruction projects. [7, 12, 13] presented models for predicting cost contingency.• Repetitive learning methods such as artificial neural networks (ANN) for predicting construction cost [12, 13]. [11] presented an ANN model for predicting cost overrun of reconstruction projects in addition to the regression analysis mentioned above.• Stochastic methods such as Monte- Carlo simulation (MCS). [14] conducted a simulation model for predicting the construction cost. • Analogical methods such as Case-based reasoning (CBR) for predicting the construction cost [2, 12, 15-17].[3] stated that such methodologies have distinct characteristics in terms of applied fields, analysis of data, methods of system establishment, and types of results. Multiple regression analysis arrives at the result through statistical analysis, but its result is too linear to be used as a standardized model. Artificial neural networks are more accurate than MRA, but it has a black box that cannot explain the structure of the model. Monte Carlo simulation has the function of analyzing the outlier using the probability approach [3]. In their work, [18] conducted an analysis of time and cost overruns for a sample of 102 educational projects. They showed that about 32.35% of the selected projects have exposed to cost overrun. On the other side, time overrun was only noticed on about 28.43% projects. The average percentage of the actual cost overrun was found to be inversely proportional to the project size. They developed regression models for cost and time overruns. They tested the validity of these models which assessed in expected cost and time overruns for any future projects at level of confidence 96.67% and 94.88% respectively. [19] conducted a research to determine the influence ranks of 52 factors causing cost variation for constructing wastewater projects in Egypt based on the quantified relative importance indices. The factors were classified under four primary classifications: (1) Owner originated category; (2) Designer originated category; (3) Contractor originated category; and (4) Miscellaneous category. The results were grouped under experience-based group and professional cadre of respondents. This study revealed the importance of owner originated category effect on causes of cost variation for constructing wastewater projects over the other arranged three categories. The most predictable and significant factor was ‘‘Lowest bidding procurement method’’ related to ‘‘Owner Originated Category’’. Also, he declared that the most cost variation can also be made by the owner due to additional work and bureaucracy in bidding/tendering method. On the other hand, the less effect factor was ‘‘Domination of construction industry by foreign firms and aids’’ related to ‘‘Miscellaneous Category’’. On the other hand, CBR has characteristics that are similar to humans' heuristic approach in which decisions are made on experience.In this paper a MRA model is developed for predicting cost overrun percentage for construction projects. A second model is developed depending on CBR for the purpose of comparison. The major objectives of this paper are as follows: (1) Investigate the causes that significantly affect cost overrun of construction projects; (2) Propose two models: based on regression analysis and case based reasoning method to predict percentage of cost overrun for construction projects. Hereinafter, the two words: factor and cause are Synonymous.
2. Research Scope and Methodology
- In the current research two proposed predictive models are intended to be applicable for predicting cost overrun percentage of construction projects. These models are based on regression analysis and case based reasoning. A standard methodology will be adopted. As an initial step to meet the objectives, previous research papers that deal with causes of cost overrun in construction projects were reviewed in previous section to investigate causes of cost overrun in these projects. CBR technique is explained. A list of causes of cost overrun in construction projects is prepared to collect data about the significance of these causes through questionnaire survey. The next step is to analyze the survey results to obtain the most significant causes of cost overrun to be incorporated into the predictive models. Building regression based model is then demonstrated and a numerical example is prepared to show how the model predicts cost overrun percentage of a project. The next step is to apply the case based model to an example project to show how the model performs step by step. The last step of this research is to validate the proposed models. Based on the validation results, the prediction accuracy of the two models is compared and conclusions are drawn.
3. Case Based Reasoning
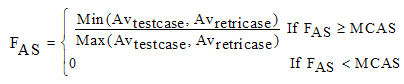
- CBR is the process of retrieving previous cases similar to a new problem, solving the new problem by adapting previously determined solutions of similar previous cases, and storing the new successful solution for future use [20]. [15] stated that CBR utilizes knowledge gained from past experiences and can be viewed as an effective method for estimation in construction. It has been observed that CBR methods can increase the accuracy of construction cost estimates [21-24]. [2] reported that CBR requires usually four steps; case representation, case retrieval, case adaptation, and case retaining. Cases are represented by attributes describing the circumstance of the problem and its solution. Similar previous cases best matching the new problem are retrieved. The solution(s) of the retrieved cases are adapted to fit the new problem. New solution(s) are retained for future use once it has been approved. [15] explained that there are two challenges related to the retrieval process that still needs to be addressed. One issue is the computation of attribute similarity which is particularly important during the retrieval process. For calculating attribute similarity: if an attribute is of nominal scale, and its value in a previous case is the same as in a new case, then the attribute is rated as one, otherwise it is rated zero [3]. On the other hand, if an attribute is either of interval scale or ratio scale, it is scored by Eq. 1. The second challenge is how to assign the attribute weight values that enable the most similar case to be identified by an index of corresponding features. [3] declared that more than one methodology can be used for calculating attribute weight, as follows:• Feature counting: this method applies the same weight to all the attributes.• MRA: this method uses the original standardized value of the coefficient (β) as the attribute weight. On the other hand, [25] used the absolute value of standardized coefficient (β). • ANN: this method uses the sensitivity coefficient as the attribute weight.In the current research, the attributes are of nominal scale, since the data gathered depends on a yes/no basis. Thus, any attribute will be rated one if its value in case base is the same as in test case, otherwise it will be rated zero. Also, for calculating the attributes weights: feature counting, original value of the standardized value (β), and its absolute value will be used for the purpose of comparison to improve the prediction capacity of CBR model. To calculate the case similarity, the attribute similarity is multiplied by its weight of importance and summed up to obtain total similarity score of each case as given in Eq. 2, [2].
 | (1) |
 is the function of the attribute similarity,
  is the attribute value of test case,
  is the attribute value of the retrieved case, and MCAS is the minimum criterion for scoring the attribute similarity.
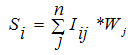 | (2) |
 = case identification number;
  = attribute identification number;
  = similarity value of case
  ;
;  = similarity value of attribute
  ; and
; and  = weight of attribute
  .
.4. Factors Impact Cost Performance in Construction Projects
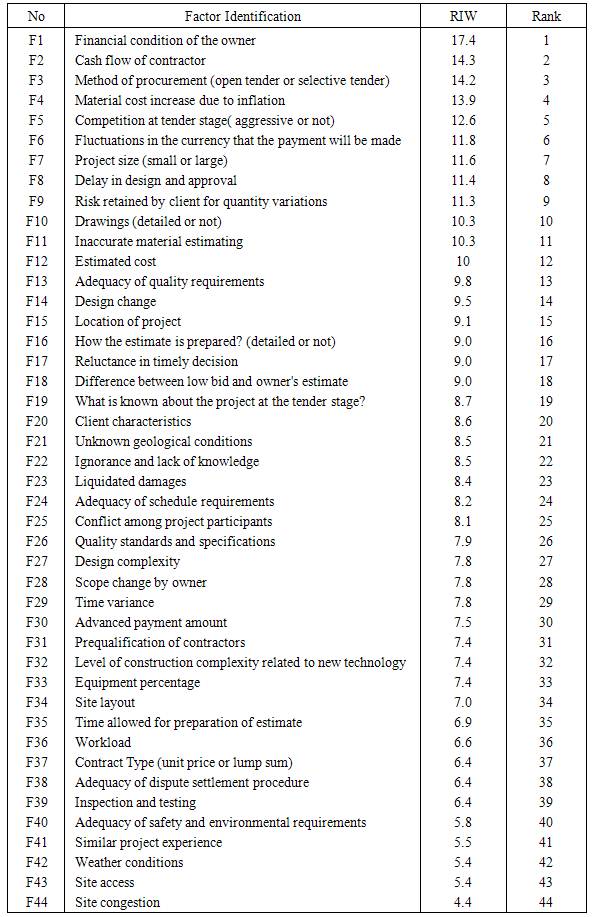
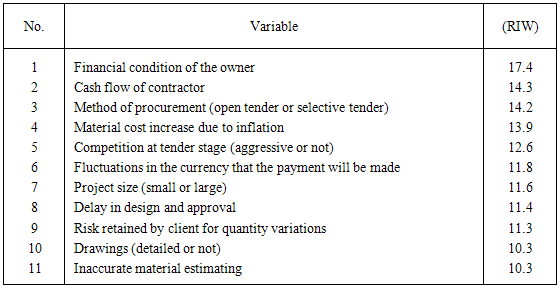
- In this study, 44 factors are identified as causes of cost overrun in construction projects were gathered from literature: [1, 6, 11, 26-33] as shown in Table 1. These factors serve as the independent variables in the predictive model of cost overrun percentage for construction projects.
|
5. Questionnaire Survey
- A questionnaire was developed to collect data about the significance of the causes that impact cost of construction projects compiled in Table 1. The questionnaire was divided into two main parts. The first part gathered basic information about the experience of the respondent, experience of the company, and volume of work of the company. In the second part the factors compiled in Table 1 was organized in the form of two priority scaling, one for occurrence frequency, while the other for severity scaling. The priority scaling for occurrence frequency was as follows: 5=Always, 4=often, 3=usually, 2= sometimes, and 1=scarcely, while the severity scaling was: 5=very severe, 4=severe, 3=somewhat severe, 2=little effect, 1=very little effect. The participants were asked to assign a number from 1 to 5 to each cause for both occurrence frequency and severity according to its significance. Besides, the questionnaire included collection of data for actual past construction projects. The data included occurrence of previous factors impact cost performance of construction projects presented in Table 1 on a yes/no basis . In other words, if in a past project, one of the previous causes occurred, the respondent assigns yes to this cause otherwise, he assigns no. Also, the actual cost overrun percentages of these projects are gathered.To determine the sample size of the questionnaire three criteria usually will need to be specified: the level of precision, the level of confidence or risk, and the degree of variability in the attributes being measured [34]. [35] reported that, the level of precision is the range in which the true value of the population is estimated to be. This range is often expressed in percentage points, (e.g., ±10 percent). Thus, if a researcher finds that 60% of respondents in the sample have adopted a recommended practice with a precision rate of ±10%, then he or she can conclude that between 50% and 70% of respondents in the population have adopted the practice. For the confidence or risk level, if a 95% confidence level is selected, then 95 out of 100 samples will have the true population value within the range of precision specified earlier. The third criterion, the degree of variability in the attributes being measured refers to the distribution of attributes in the population. The more heterogeneous a population, the larger the sample size required to obtain a given level of precision. A proportion of 50% indicates a greater level of variability than either 20% or 80%. This is because 20% and 80% indicate that a large majority do not or do, respectively, have the attribute of interest. Because a proportion of 0.5 indicates the maximum variability in a population, it is often used in determining a more conservative sample size.For population that are large, [36] developed Eq. 3 to yield a representative sample size for large population
 If the population is small, one can use Eq. 4., where
 is the sample size for small population.
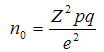 | (3) |
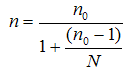 | (4) |
 is the abscissa of the normal curve that cuts off an area at the tails (1 – equals the desired confidence level, e.g., 90%), e is the desired level of precision,
  is the estimated proportion of an attribute that is presented in the population, and
  is
is  . The value for
  is found in statistical tables which contain the area under the normal curve.
  is the population.The questionnaire survey was performed in Egypt, the population is 465, which represent the number of contractors works in construction projects with LE 2.5 millions or more, this number was obtained from Egyptian Federation for Construction & Building Contractors. The population is large, thus Eq. 3 is applied first for determining an initial sample size
  . A confidence level, 90% is assumed, thus
  =1.65 from normality tables,
  is assumed 0.5,
  is assumed (±15%). Substituting about:
  ,
,  ,
,  , and e in Eq. 3, results in an initial sample size
  =30.25. Substituting about:
  and
and  in Eq. 4, results in sample size
  =28.5.Logically the anticipated response rate, will not be 100%. Accordingly, the questionnaire was sent to 43 contracting companies specialized in construction projects. Some of the questionnaires were sent via mail after contacting the participants through telephones, whereas, the other part was through individual meetings. Most of the participants were at the level of general managers.
6. Survey Results and Analysis
- A total of 30 questionnaires were completed and returned. The response rate was 69.8%. This response rate is considered acceptable for a survey focusing on gaining responses from industry practitioners [37]. The respondents included general managers, technical office managers, and construction managers. All the participants are involved in building projects in addition to other specializations. 82% of them are involved in public water and sewage projects. Also, 42% of them are involved in civil works (bridges, roads, and airports). The author believes that the variations in positions besides the variations in the specialization for the participants enrich this study to a great extent. This is because data reliability is related to data source and the identification of the position held by the person who completed the questionnaire [38].To give additional credibility for the findings of this survey, the participants were asked about their length of experience and length of experience of their companies. 89% of the respondents have an experience more than 10 years, whereas, 57% have an experience more than 20 years. 92% of the companies have an experience more than 10 years, whereas 50% have an experience equal to or greater than 25 years. 78% of the companies have an annual volume of work more than LE 25 millions, whereas 42% have an annual volume of work equal to or more than LE 250 millions. In order to assess the significance of the identified causes, an importance index for each factor was calculated, as illustrated in Eq. (5), by multiplying the frequency of occurrence by the degree of severity or impact. Frequency occurrence refers to the probability that any cause given in Table 1 occurs in a project and contributes to its cost overrun. Whereas, degree of severity refers to the negative impact that the cause contribute to the project cost overrun. The importance indices were used to measure the relative weight for each factor. The relative importance weight (RIW) was computed using Eq. 6. The cause financial condition of the owner, for example, if it's assigned (4=often), for frequency of occurrence, this means that the interviewer assigns 80% probability for the occurrence of this factor effect in previous projects according to his experience. In these projects this cause contributed to these projects cost overrun. On the other hand, if this factor assigned (4=severe) for the degree of severity, this means that the impact of this factor was severe on these projects' cost overrun. Table 1 shows the factors arranged in descending order according to their corresponding RIW, such that the factor received the highest RIW is assigned rank equal to one.
 | (5) |
 | (6) |
|
7. Regression Based Model
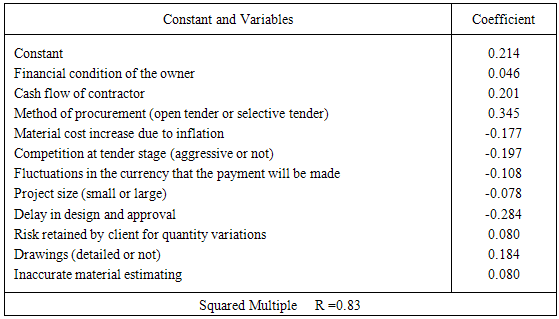
- Data for 30 construction projects was collected. These data include the occurrence of factors presented in Table 1 on a yes/ no basis, and the corresponding actual cost overrun percentage. The data was divided into two sets. The first set contains 20 projects for the purpose of model building. The second set contains 10 projects for validation purposes. An initial experimentation with a regression model that includes all 11 variables using SPSS 13 software was performed. Forward-stepping and backward-stepping methods were used. Forward stepping begins with entering the most significant variable at the first step, and continues adding and deleting variables until none can significantly improve the fit. Backward stepping, on the other hand begins with all candidate variables then removes the least significant variable at the first step and continues until no insignificant variable remains. Forward- stepping or backward-stepping technique gave the same model for predicting the percentage of cost overrun for construction projects depending on 11 variables (see Table 3) with a squared multiple R= 0.83. This indicates that the model is able to explain 83 % of the variability in the data, which is an excellent indicator of the model's expected performance. The underlying formula of the model is as follows:
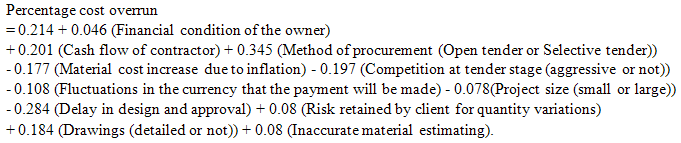 | (7) |
|
8. Case-Based Reasoning Model
- Based on previous cases (first set of projects), a case base is developed. Then, those cases that are similar to the new cases are retrieved from the case base in order to estimate cost overrun percentage of the new cases. To retrieve similar cases, the similarity values are calculated by multiplying each similarity value
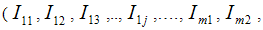
 of each attribute (factor) for a case in the case base and new case by corresponding attribute weight (W1,W2,W3,….,Wj) and then summing all of them. The weights of attributes are variables. The case with the highest similarity value is used to estimate cost overrun percentage of the new case. In the following subsections, these processes are described in details.
8.1. Case Representation and Attributes
- Each case is represented by the attributes identification and dependent variable (percentage of cost overrun). In attributes identification, the attributes are presented which, are the previous 11 factors that impact cost of construction projects included in the regression model. The attributes are used in calculating degree of similarity between a new case (test case) and each case in the case base. In current research, all the attributes are of nominal scale, since each attribute assigned a value of one if occurred, otherwise zero. Thus, a similarity value of attribute is assigned one if its value in each case of case base is the same as its value in test case, otherwise, 0. Also, three methods are used for calculating the attributes weights: feature counting, standardized coefficient (β) of MRA, and the absolute value of the standardized coefficient (β) for the purpose of comparison to improve the prediction capacity. It must be noted that, standardized coefficient (β) is a regression coefficient in a standard format as given in the results of SPSS software. Also, if this coefficient used as a method of calculating attributes weights, in the case based reasoning model, MRA must run first. Feature counting method is used for calculating attributes weights without running MRA. The similarity value of each attribute is multiplied by its weight resulted from any method of the three previous methods and summed to obtain the similarity value of each case (see Eq. 2).
8.2. Matching and Retrieval
- In comparison with the new cases in which percentage cost overrun will be estimated, the most similar case (the case with the highest similarity value from a case base) to the new case is retrieved. If more than one case in case base has the same similarity value, the author suggests using the mean value of cost overrun percentage for these cases.
8.3. Adaptation
- In this study, all the attributes are of nominal scale, thus no adaptation is used to adjust cost overrun percentage for the new cases.
8.4. Case Retaining
- In this research, the new cases are retained for future use, i.e in finding the solution of the second new case, the first new case is used among the cases of the case base. Also, in finding the solution of the third new case, the first and second cases are used among the cases of the case base and so on.
9. Example Project
- To show how the CBR model performs, an example project is solved step by step to predict cost overrun percentage for this project. This project is the previous project used in predicting cost overrun in the regression based model. The values of different factors are given in Table 4 such that if the factor has been occurred it is assigned a value of 1, otherwise it's assigned zero.
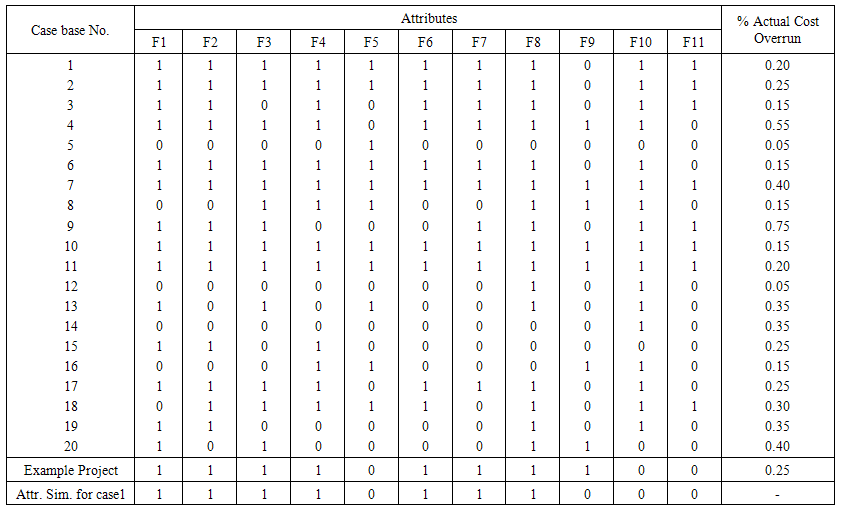 | Table 4. Profile of Cases for Case Base and Test Case (Example Project) |
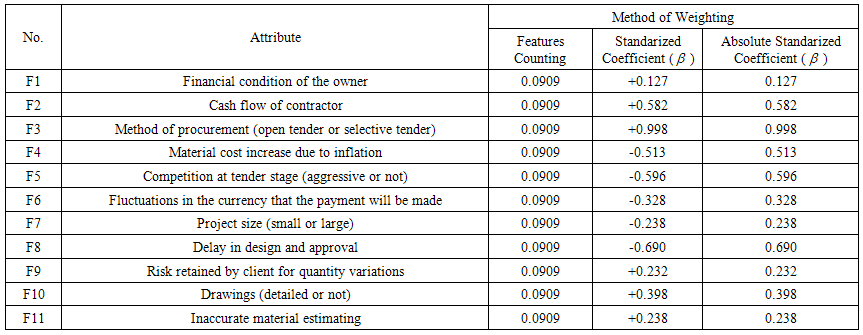 | Table 5. Attribute Weights by Methods |
 =-0.062Calculating similarity value for all cases in case base and test case using [standardized coefficient (β)] for weighting attributes, (for example), revealed that case 3 received the highest value (1.656). Thus, case 3 is retrieved and the predicted value of cost overrun percentage for the example project is 15% (actual value for case 3).Case reatainingThe new case, which consists of attributes of example project and 15% cost overrun percentage is retained for future use in addition to cases of case base.
10. Models Validation
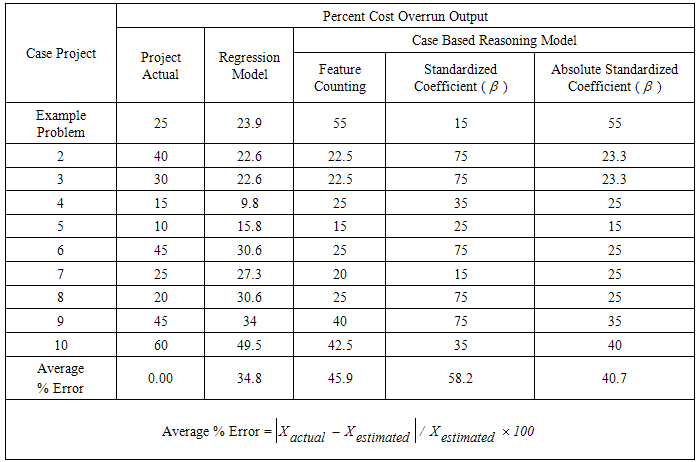
- A comparison between the regression model estimate and the case based reasoning model estimate is shown in Table 6. It provides the actual cost overrun percentage, predicted cost overrun percentage, and the analysis of the average percent error for 10 projects including the example project (these are projects of the second set). In case based reasoning model, three methods for calculating attributes weights were used as presented previously. In general, the regression based model shows prediction accuracy better than that of case based reasoning model. Average % error=34.8 for regression based model, whereas this percentage is varied for CBR model according to weight assignment method for attributes. Best results for CBR model are obtained when applying absolute standardized coefficient (β) as assignment method for attributes (average % error= 40.7). This percentage is 45.9 for feature counting method. On the other hand, this percentage is 58.2 when applying the original value of standardized coefficient (β).
|
11. Conclusions and Future Recommendations
- This paper investigated the effect of causes of cost overrun affecting construction projects through a questionnaire survey. These causes were established from literature. The questionnaire survey used a structured format to obtain information related to the occurrence of the previous causes in actual projects on a yes/no basis. Based on the results of the questionnaires a relative importance weight was established for each cause to quantify its effect on project cost performance. It was intended that causes received a relative importance weight higher than 10 are significant and incorporated into the model as independent variables. Accordingly, 11 significant causes were identified. The dependent variable was the cost overrun percentage.Two models were developed to predict cost overrun percentage in construction projects. The first model based on regression analysis. Data of 20 projects was used for model building, while the data of remaining 10 projects was used for validation purposes. The best model was found accurate in predicting cost overrun percentage contains the previous 11 causes. These are: financial condition of the owner, cash flow of contractor, method of procurement (open tender or selective tender), material cost increase due to inflation, Competition at tender stage (aggressive or not), fluctuations in the currency that the payment will be made, project size (small or large), project size (small or large), delay in design and approval, risk retained by client for quantity variations, drawings (detailed or not), and inaccurate material estimating.The second model based on case based reasoning. Validation of the two models revealed that regression model has prediction capabilities higher than that of CBR model in predicting cost overrun percentage for construction projects. On the other hand, testing the case based reasoning model's effectiveness with respect to the weight assignment method for attributes, revealed that best results are obtained when applying absolute standardized coefficient (β). Feature counting method gave results better than the original value of (β). This research provides an approach for industry practitioners to predict cost overrun percentage for construction projects. On the other hand, it provides researchers with a methodology to build regression and case based reasoning models for cost overrun percentage prediction. Computer implementation for case based reasoning model is suggested for future research, for easily implementation.