-
Paper Information
- Next Paper
- Paper Submission
-
Journal Information
- About This Journal
- Editorial Board
- Current Issue
- Archive
- Author Guidelines
- Contact Us
International Journal of Construction Engineering and Management
p-ISSN: 2326-1080 e-ISSN: 2326-1102
2015; 4(3): 80-86
doi:10.5923/j.ijcem.20150403.03
Financial Analysis of a Construction Company in Saudi Arabia
 Abstract
 Reference
 Full-Text PDF
 Full-text HTML
Ibn-Homaid N. T., Tijani I. A.
Construction Engineering and Management, Civil Engineering Department, King Saud University, Riyadh
Correspondence to: Tijani I. A., Construction Engineering and Management, Civil Engineering Department, King Saud University, Riyadh.
| Email: |  |
Copyright © 2015 Scientific & Academic Publishing. All Rights Reserved.
Failures has been transpired in the construction industry not only in developing countries but worldwide. Construction company failures are not only extremely disruptive to the industry but it may pose a threat to the economy of the nation. Construction companies are vulnerable to bankruptcy due to fluctuations in construction volume, fragmented nature of the industry, inflation, high competition, the uncertainty and the risk involve. The earliest determination of any potential failure will protect the company from becoming a victim. This paper examines the role of financial management in determining the financial status a construction company in Saudi Arabia. It also present a failure prediction model for the company based on the previous business data available. It is anticipated that Construction Company will be able to prevent business failure by using the result from the research.
Keywords: Construction Company, Financial analysis, Financial ratio, Strategic management
Cite this paper: Ibn-Homaid N. T., Tijani I. A., Financial Analysis of a Construction Company in Saudi Arabia, International Journal of Construction Engineering and Management , Vol. 4 No. 3, 2015, pp. 80-86. doi: 10.5923/j.ijcem.20150403.03.
Article Outline
1. Introduction
- Saudi Arabia has been undergoing transformation due to huge volume of construction activities since 1990. This has lead to an escalating of construction companies in the kingdom. This transformation is due to the wealth generated by the oil industry [1]. Large and complex projects has been constructed, these, cause an attraction of contractors and construction companies from all over the world. Thereby, construction companies are the backbone of real estate development. The booming of this industry is as a result of the wealth generated oil and gas sales, which is reinvested in infrastructure. Since the construction companies are the agent of transformation and development, they play a major role in national economy by using oil and gas wealth to construct economic and social facilities [2]. The oil and gas wealth contributes, on average of 5% to 9% of gross domestic product (GDP) of developing countries [3]. According to Halim [4], the construction industry serves as an indicator of the nation’s economy condition. However, thousands of these companies are facing bankruptcy and business failure, every year, and resulting in uncompleted private and public construction projects [5]. The economic and social damages resulting from the business failure of construction companies are beyond the quantifiable costs to the company owners, share-holders, creditors and employees [6]. Therefore, it’s important to recognize business failure at the earliest stage in order to reduce the economic damages.A periodic evaluation of the financial records of the company is a critical step in successful completion of a project [7]. Therefore, Construction Company must evaluate its financial performance, periodically, so that necessary and appropriate strategies can be put in place to maintain their survival.
2. Causes of Construction Company Failure According to Previous Research
- Business failure rarely depends on a single factor but it’s mostly occur at critical situation as a consequence of a complex process [8]. According to Peterson [9], the Surety Information Office (SIO), which is an office that collects data on surety bonds in the United States, has identified six warning indications that show that a construction company may be in distress. They are (i) bank line of credit constantly borrowed to the limit, (ii) poor estimating and/or job cost reporting, (iii) ineffective financial management system, (iv) poor project management, (v) No comprehensive business plan and, (vi) Communication problem. The first four are directly proportional to the financial management of a company.Yin [10] attributes insufficient capital to finance the construction undertakings by the contractors as one of the factors of the failure. Contractors usually do not have fixed assets like most manufacturers, and they usually have construction equipment rather than buildings and lands. Meanwhile, banks do not accept moving assets as adequate collateral for loans. He further divulges that contactors find it more difficult to undertake their projects without bank loans.Davidson and Maguire [11] postulate based on their accounting experience, ten most common causes for construction companies’ failures. They are as follows: (i) growing too fast, (ii) obtaining work in new geographic region, (iii) dramatic increase in single job size, (iv) high employee turnover, (v) inadequate capital, (vi) poor job costing, (vii) poor accounting system, (viii) obtaining new type of work, (ix) poor cash flow and (x) buying of useless stuff.According to Enshassi, et al. [12], more than half of business failure in construction industry are due to unrealistic project margin. Poor financial management and lack of capital are the main causes of business failure [4]. Budgetary and macroeconomics issues are the main reasons for business failure in the United States according to Arditi [13]. He further stress that 80% of the failure were caused by these factors, namely insufficient projects (27%), industry weakness (23%), heavy operating expenses (16%), insufficient capital (8%) and burdensome institutional debt (6%). All these factors, except for industry weakness are budgetary issues and should therefore be handle by companies that are conscious of the effects of these factors for their survival.Kirack and Arslan [14] through their survey conducted among 40 small to medium sized Turkish construction companies, attribute the failure to lack of experience and country’s economic conditions. A study at subcontractor level by Schaufelberger [15], reveals that business failure are caused by insufficient capital, excessive debt, poor billing process, unfamiliarity with new geographic areas, increase in project scope and poor use of accounting system.Osama [16], attributes the business failure of Construction Company in Saudi Arabia to difficulties with cash flow, difficulties in acquiring work, bad judgments, lack of managerial experience and low profit margins. From the previous findings, it can be deduce that the major factor causing business failure is financial management.
3. Technique for Prediction of Business Failure
- Routine evaluation should be adopt by construction companies, this will help them in adoption of timely and appropriate strategies to sustain the business [17]. Several models predicting business failure has been proposed by different authors. According to James [8], relevant prediction techniques for construction company failure include (i) ratio analysis, (ii) multiple discriminant analysis, (iii) conditional probability models and (iv) subjective assessment. For example, Z-score model has been developed by Altman [18], which was based on multiple discriminant analysis. This has been used by corporate bodies to identify potential bankrupt companies. Conditional probability models has been proposed by Balcaen and Ooghe [19]. These models use non-linear maximum likelihood method to estimate the probability of failure conditional on a range of firm characteristics. The models were based on a certain assumption concerning the probability distribution. Chan [20] uses ratio analysis to assess the financial performance of the construction firms in Hong Kong.
3.1. Financial Ratio
- Company’s balance sheet and the income statement are the common tools used in tracking and measuring of company’s financial health status. The relationship among these values are financial ratios. Financial ratios were derived from pulling two numbers from financial statement and dividing one by another [8, 21, and 22].Landford [23] as cited by James [8], states that analysts should be able to use financial ratio analysis to examine the operating performance in term of the followings: (i) whether the firm is utilizing its assets, (ii) whether its profit margins are in line with assets, (iii) whether there is excessive investment in fixed assets, (iv) whether the business is adequately financed, (v) whether there are signs of liquidity strains and (vi) whether collection of receivables is efficient.The traditional financial ratio is classify into four broad categories according to Kumar [22] and Edum-fortune [23]. They are as follows:a) Liquidity ratio (e.g. current ratio, quick ratio): this measures the ability of the company to meet its short term commitment.b) Profitability ratio (e.g. return on equity, return on assets): it measures the overall performance, which management has been able to achieve.c) Leverage ratio (e.g. interest cover, gearing ratio): it measures the extent to which a company has been financed by debt and shareholders’ funds; andd) Activity ratio (e.g. stock turnover, asset turnover): measures how well a company has been using its resources.Financial ratios analysis helps to understand the financial dynamics of business [24]. However analyst cannot merely rely on one ratio, particularly if it’s analyzing construction companies [25].Strischek and Mclntyre [23], stress that the ratios must be compare with industry’s standard average over a long period of time. So also, the ratios can be compare with the previous years or with those standard ratios [21]. These ratios have meaning and point to how the company has been run in the year of accounts or earlier. Table 1, shows the types of financial ratios, industry average and range used for commercial construction companies as proposed by Peterson [9]. Halim [27] stated that if a firm’s ratios are significantly varies from the averages of its industry, an analysts should be concern about why this variance occurs. Thereby, this deviation from the industry standard should alert the management to further check for their survival.
|

4. Research Objective
- To analysis and predict business failure of the construction company using financial ratio. It is hope that early detection of financial problems, will help the construction company develop an effective financial strategy to defend its business against failure. It is thereby aim to forecast any future occurrence of financial threat for Construction Company in the kingdom.
5. Company Background
- This is a Saudi Arabia licensed general contractor specialized in industrial and heavy construction, started its operations in the early 1950’s. It was initially registered as a sole proprietorship company. In 2007, the company was converted into a limited liability company and later the year it became a joint stock company in accordance with the resolution of the Ministry of Commerce and Industry number 270. The company’s core activity is construction of petrochemical facilities on a subcontract basis from the primary project contractor who provides the technical requirements, designs and specifications of the project. In summary, the company’s major scope of work are industrial and civil construction, petrochemical facilities, fabrication works and provision of technical services. The company is also entrusted with responsibilities of (i) carrying out all additional designs, drawings and other documents required for the design, (ii) the procurement of materials in accordance with drawings, specifications and standard agreed upon, (iii) the supply of all required equipment, machinery, materials, labor and supervision for the performance of the work and services [28].
6. Research Methodology
- This study uses financial ratio to analysis the financial record of a construction company in Saudi Arabia to predict its financial health status. The ratio is compare with industry’s standard average over a long period of time [23]. Financial records of the construction company were obtained from Saudi stock exchange market [28] which is analyzed for five consecutive years.Peterson [9] as shown in Table 1, proposed seventeen financial ratios, and there were adopted as standard performance tools. The company average ratios were computed and compared with typical standard median and range of heavy and highway construction [9].The company ratios was patterned using Peterson’s framework [9]. According to Peterson [9], the industry median is a cut-off point to demonstrate whether companies are above or under industry average, and typical range represent the range at which half of construction company falls within. This research adopted heavy and highway construction range because the company involves in the construction water lines, heavy excavation, tunnels and pipelines which is in harmony with the classification of construction companies of Peterson [9].
7. Results and Discussion
- Based on the financial record obtained from Saudi stock exchange market [29], financial ratios were computed and compared with proposed Peterson’s median and range for heavy and highway construction industry [8]. The analyses of financial ratios were grouped into four categories, which is as follows: liquidity, profitability, leverage and efficiency [22, 23, and 29].
7.1. Liquidity Ratio
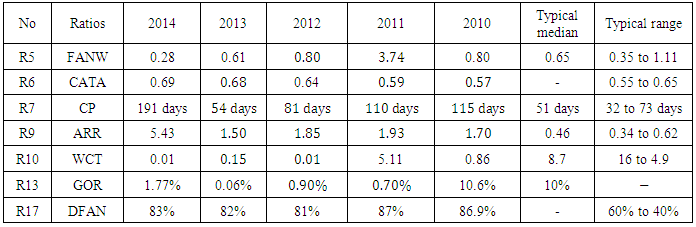
- Liquidity ratio (Quick ratio and Current ratio) is majorly used as an indicator of short-term liquidity and short-run solvency [29]. Results shown that the yearly liquidity ratios were not satisfactory.
|

7.2. Profitability Ratio
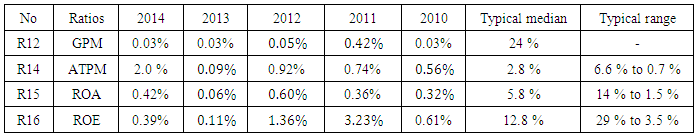
- Profitability ratio is a measure of profitability, which is a way to measure a company's performance. Profitability is simply the capacity to make a profit, and a profit is the left over from income earned after all costs and expenses related had been deducted. This include gross profit margin, after tax profit margins, return on assets and return on equity. The result shown that the company has all its gross profit margin (GPM) below the industry median. For these period, it shows that the company spent much on construction project costs and inquired a lot of debt over year with less revenue. The after tax profit margin (ATPM) of the company were far less than the stipulated industry average of 2.8%, however, all were fell within range expect year 2013 and 2010.. According to Varghese [24], low tax rate and non-dependence on debt capital are the reason for high profit, gross profit margin and overhead costs also have direct impact on the ATPM of a company.However, the possible solution for increasing the profitability of a company is by reducing overhead expenses and increasing of overhead mark-up to improve its ATPM.The efficiency of how a construction company utilize its assets is being measured by return on assets (ROA). Efficient company will have a relatively high ROA. Result shown that the company yearly ROA is below the recommended industry average and not even fall within the recommended range for construction industry. A low ROA shown that the company is inefficient in managing its assets during these period. Return on equity (ROE) is one of the most important financial ratio, which shows the dividends of the shareholders. A relatively high ROE shows that the stock price will tends to be high; thereby actions that increase ROE generally increase the stock price. From Table 3, the result shown that all the ROE are below recommended industry median and range. This appeared to be hazardous.
|
7.3. Leverage Ratio
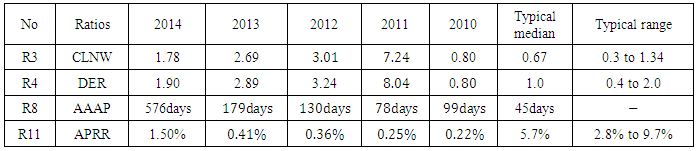
- Leverage ratio is used to determine company’s methods of financing or its ability to meet financial obligations. It is also used to measure a company's mix of operating costs, giving an idea of how changes in output will affect operating income and also show that construction companies depends on debts to perform their construction projects. There are several ratio, but the main types are current liabilities to net worth ratio (CLNW), debt to equity ratio (DER), average age of accounts payable (AAAP) and accounts payable to revenue ratio (APRR).
|
7.4. Efficiency Ratio
- Efficiency ratio are typically used to analyze how well a company uses its assets and liabilities internally. This extremely useful ratio in predicting the performance of any company. Table 5 shows financial ratios use in determining the efficiency of the company.
|
8. Conclusions
- Based on the above analysis, the general performance of the company over the five consecutive years is not satisfactory. Revenues generated by the company over the years are not adequate and none of the ratio were satisfactory when compare with the recommended industry median and range. This simply indicates that the company lack cash and capital to finance its construction works and at the same time, the company was highly dependent on debt capital to execute its construction works.The company also has poor collection policies and this made the company to make used of subcontractors and suppliers to fund most of its construction costs and it was slow in paying up the bills. And this made the company to bear excessive lost and risk.All the ratios are important, however, it is worth noting that it is not necessary to use all these ratio in performing a financial analysis. The use of the ratios depends on the objectives of the concerned firms. Banking sectors will employ the use of profitability and leverage ratios before making a decision to approve loan for a construction company. Suppliers and subcontractors are likely concern about the company’s liquidity ratio to meet the short-term needs and the shareholders involved may have more interest in the profitability ratio.These four ratios is efficiently in determining the failure or success of Construction Company as it was shown in the analysis above. Its hope that construction firm in Saudi Arabia will adopt this as a benchmark in predicting the financial status of their business.
ACKNOWLEDGEMENTS
- The authors are grateful to the Construction Company and Saudi Arabia stock exchange for giving direct and online access to the financial data used.