-
Paper Information
- Paper Submission
-
Journal Information
- About This Journal
- Editorial Board
- Current Issue
- Archive
- Author Guidelines
- Contact Us
International Journal of Construction Engineering and Management
p-ISSN: 2326-1080 e-ISSN: 2326-1102
2014; 3(4): 117-133
doi:10.5923/j.ijcem.20140304.03

Factors Influencing Design Changes in Oil and Gas Projects
 Abstract
 Reference
 Full-Text PDF
 Full-text HTML
Mahsa Taghi Zadeh , Reza Dehghan , Janaka Y. Ruwanpura , George Jergeas
Center for Project Management Excellence, Schulich School of Engineering (Department of Civil Engineering), University of Calgary, Calgary, Canada
Correspondence to: Mahsa Taghi Zadeh , Center for Project Management Excellence, Schulich School of Engineering (Department of Civil Engineering), University of Calgary, Calgary, Canada.
| Email: |  |
Copyright © 2014 Scientific & Academic Publishing. All Rights Reserved.
This work is licensed under the Creative Commons Attribution International License (CC BY).
http://creativecommons.org/licenses/by/4.0/

Although many project time delays, cost overruns and quality defects—particularly in the oil sector—are attributed to design changes, the associated issues have not yet been thoroughly investigated. This study aims to provide a knowledge-based foundation for the evaluation and prediction of the impact of design changes on project performance, by identifying and analysing the main contributing factors. Using findings from a thorough literature survey, semi-structured interviews, and knowledge-mining from completed projects in the oil industry, a total of 28 factors were consolidated and grouped into four major categories. These factors were then ranked on their relative importance, based on data from a questionnaire survey distributed to a wide range of professions in the industry. An analysis of the results found that the most influential factors contributing to design changes are project scope definition, level of schedule overlapping, and project team's work experience, respectively. Ultimately, a predictive model has been proposed for determining the impact of design changes on project performance. The outcomes of this study form part of the authors’ on-going research focusing on the analysis of the casual relationships between diverse factors to develop the predictive model.
Keywords: Design changes, Impact of changes, Influencing factors, Project performance, Oil industry
Cite this paper: Mahsa Taghi Zadeh , Reza Dehghan , Janaka Y. Ruwanpura , George Jergeas , Factors Influencing Design Changes in Oil and Gas Projects, International Journal of Construction Engineering and Management , Vol. 3 No. 4, 2014, pp. 117-133. doi: 10.5923/j.ijcem.20140304.03.
Article Outline
1. Introduction
- The term "Design Change" here refers to any addition, omission or adjustment to established project design requirements, documents, drawings or specifications. Design changes, whether voluntary or imposed, are common and inevitable in large industrial projects. Many project time delays, cost overruns and quality defects—especially in the oil sector—can be attributed to design changes, sometimes implemented in the belief that the changes will be beneficial for the project, but with unforeseen detrimental effects. A study performed by Jergeas [1], analyzing scope changes during the early stages of large oil sands projects in Alberta, showed few design milestones could be achieved on time, due to the stream of changes and trends. Design changes and their antecedents and influences are known to depend on a variety of factors, including project characteristics, type and timing of changes, project team experience and project management effectiveness. Researchers and practitioners have long searched for ways to improve change evaluation and management practices in large projects. However, despite a considerable amount of recent research, very little is known about dealing with design changes and the contributing factors in oil and gas projects. This study bridges the current knowledge gap by highlighting and analyzing the principal factors affecting design changes. It provides an increased understanding of crucial factors with predictive potential in assessing these sorts of changes, and also helps project participants determine the cost and schedule impact of changes on project performance more accurately.The paper starts with a brief overview of the literature, followed by an explanation of the methodology used to identify, evaluate and rank the factors affecting design changes. The results of data analysis are discussed next, and to conclude, a conceptual model based on the most essential factors is proposed to recognize the pattern of the impact of design changes, and more accurately estimate the contingency and budget required to deal with these sorts of changes.
2. Background / Literature Review
- Project changes, causes and impacts have been subject to a considerable amount of research and attention over the past years. An extensive review of literature reveals that studies on the general subject of project changes cover a broad spectrum of topics, including change causes and classification, change effects and change management system. In the early 1990s, the Construction Industry Institute (CII) set up a dedicated research team to carry out a series of studies on project changes, causes, and effects on project performance [2-5]. In addition to these efforts, academic researchers have also carried out some substantial research; the main findings of these studies have been summarized in the paragraphs.
2.1. Change Causes and Classification
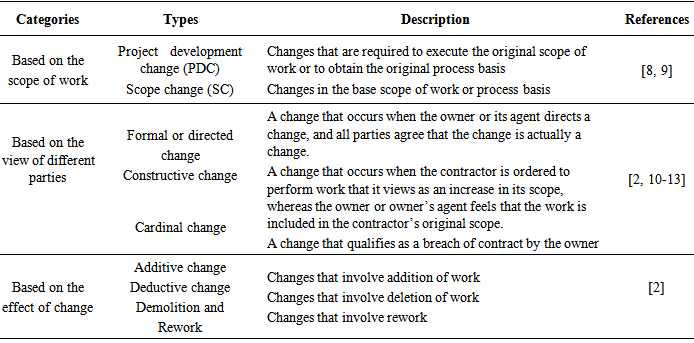
- Change causes are conditions or events that either directly trigger or contribute to a change in projects [6]. Owners and designers initiate changes as the project design is completed, to reflect basic changes in the project scope. Contractors often initiate changes to accommodate field conditions and to facilitate construction. Hsieh et al. (2004) analyzed change orders in metropolitan public projects in Taiwan [7]. They divided the causes of change orders into two main dimensions: "technical/construction needs" and "administrative needs". Sun and Meng (2009) proposed a taxonomy adopting a hierarchical structure: at the top level, change causes are divided into external causes, organizational causes and project internal causes [6]. Project changes have been classified in different ways by previous research studies. The main types of changes, adopted from the literature, are presented in Table 1.
|
2.2. Change Effects
- Although project changes are sometimes beneficial or even essential (for example, in rectifying errors), the negative impacts associated with the implementation of changes should not be understated. They may lead to frustration, interruption in the flow of work, errors and rework, which, in turn, increase costs and delays, and decrease productivity. Figure 1 presents a list, derived through previous research, of the major effects of changes.
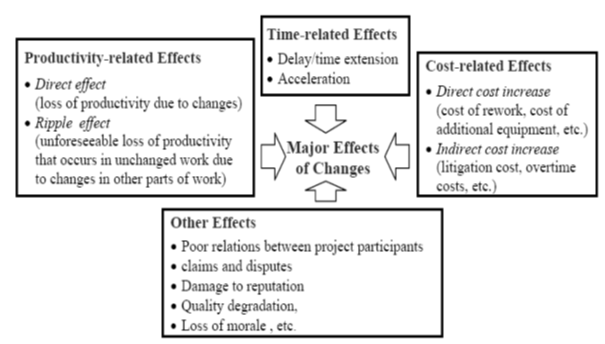 | Figure 1. Summary of the detrimental effects of changes |
2.3. Change Management System
- In the early 1990s, the Construction Industry Institute (CII) research team carried out a number of studies on project change management [21]. According to CII report, the principles of effective change management are: promoting a balanced change culture, recognizing change, evaluating change, implementing change, and continuously improving from lessons learned. A set of recommended best practices was then published by CII to improve project change management system. In addition to CII publications, other researchers have investigated methods to improve current change management practices [22-27]. Studies conducted by Sanders and Zou and Lee [28, 29] investigated the impact of change management practices on project change cost. The results of these studies revealed that the individual practices have different levels of influence on project change cost and that applying change management system is helpful in lowering change costs. They also explored the relationship between project characteristics and the implementation of project change management best practices.
2.4. Research Rationale and Motivation
- Review of the literature shows that current research largely quantifies the impact of change orders on labour efficiency in the construction industry. There has also been limited research on cause and effect analysis of changes on project cost and schedule. While these existing studies present valuable empirical work on the nature and impact of change orders, very few have focused on issues related to design changes—factors contributing to this kind of change have not been thoroughly investigated. As there is not any significant study demonstrating which factors most contribute to design changes, particularly in oil and gas projects, further research is clearly needed in developing tools to deal with design changes for each sector of the industry. Building on the foundation of existing research works on the subject of project changes, the present study was conducted to identify key factors contributing to design changes, to understand the behaviour of these factors, and to prioritize the factors that should be considered in the impact analysis of design changes.
3. Objectives and Scope
- The main goal of this study is to provide a knowledge-based foundation for the evaluation and prediction of the impact of design changes on project performance, by identifying and analyzing the main factors which contribute to this kind of change. The specific objectives of this research include:1. To identify and categorize the principal factors influencing design changes in oil and gas projects2. To evaluate the relative importance of contributing factors as perceived by project management team3. To outline a conceptual model for pattern recognition of the impact of design changes on project performance, with consideration of the crucial factors prioritized earlier in the studyThe scope of this study is the investigation of factors influencing design changes throughout different phases of project execution, from authorization for expenditure to project completion. The focus here is on oil and gas projects located in Alberta, Canada.
4. Research Methodology
- The research method was a combination of qualitative and quantitative techniques, undertaken in two stages. The first stage began with data collection through a comprehensive literature review, a number of semi-structured interviews with key experts in the industry, and knowledge-mining from four completed projects. The results were then qualitatively analyzed to form a list of 28 factors grouped into four major categories (refer to section 4.3.1). The interviews were used to refine the list of factors and to facilitate development of the empirical research questionnaire. The majority of interviewees were senior experts with a strong technical and work background on the subject of the study (average experience of 23 years).In the second stage, a questionnaire survey was designed and administered to 115practitioners in oil and gas companies to investigate their perceptions of the significance of influencing factors associated with design changes. The survey data was then statistically analyzed and validated to create a conceptual framework used to outline development of a predictive model for impact analysis of design changes in oil industry projects.
4.1. Identification and Classification of Factors
- To identify a preliminary list of factors influencing design changes, data obtained from literature survey was qualitatively analyzed and refined through the researchers' own experience, interviews with an expert group of seven project management professionals in the industry, and in-depth analysis of project documentation taken from four completed EPC (Engineering, Procurement, and Construction) projects in the oil and gas sector, located in Alberta, Canada. The interviewees were selected using convenience sampling; a number of project managers and project engineers working in oil and gas companies were first contacted by telephone or email, informed of the purpose of the study and invited to participate. Those who indicated interest were requested to arrange a time for an interview. The interviews generally spanned between 45 minutes to one hour, and focused on the experience of practitioners in relation to evaluation and administration of design changes in projects. Using the content analysis method, the researchers simultaneously analysed the information obtained through interviews and knowledge mining of project documentation at different stages of data collection. The main factors contributing to design changes have been categorized into four groups: 1. Project-related factors2. Factors related to project management practices3. Human-related factors4. Change-related factorsThe list of factors and a brief description of each factor, is provided in Table 2 for clarity.
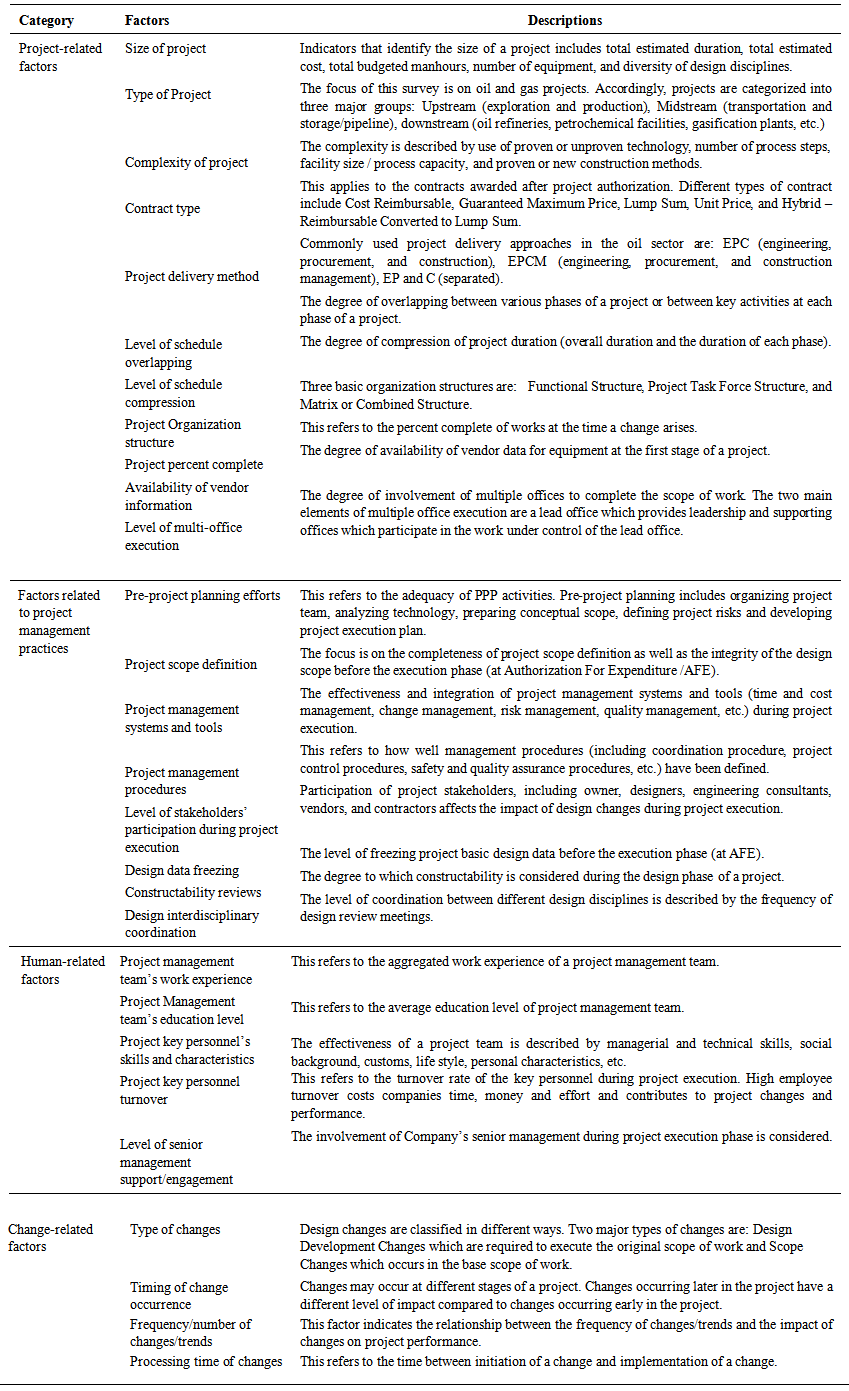 | Table 2. Factors Influencing Design Changes |
4.1.1. Project-related Factors
- The importance of project-related factors in the impact analysis of project changes has been echoed in previous research works [11, 12, 16-18, 30-32]. Oil industry projects have particular characteristics that may contribute to design changes, but type, size, and complexity of a project; contract type and delivery method; level of schedule overlapping and compression; project organization structure and the percent complete of a project are among the main attributes categorized here.
4.1.2. Factors related to Project Management Practices
- Project management practices, tools and techniques play an important role in controlling design changes and the impact of changes on project performance. The main factors in this group include pre-project planning; scope definition; project management systems, tools, and procedures; design data freezing; level of stakeholders' participation during project execution and design interdisciplinary coordination. Kuprenas (2003) considered the influence of project management practices as a significant factor on design phase cost performance [33]. The study performed by Zou and Lee [29] explored the relationship between change management practices and the project change cost. The results revealed that the application of a change management system is helpful in lowering the project change cost.
4.1.3. Human-related Factors
- Human-related factors are another group influencing project changes and their impacts in turn on project performance. This group consists of a wide range of attributes reflecting work experience, educational level, skills, personality and background, management support, and staff turnover. The study performed by Hanna et al. [11, 12] emphasized the role of a management team's work experience in handling change orders.
4.1.4. Change-related Factors
- Change-related factors are central to our understanding of the origin and nature of changes and their impacts. Type of changes, timing of change occurrence, frequency of changes, and processing time of changes are included in this category. A number of previous research studies have investigated change-related factors [11, 12, 16, 19, 34]. Studies by Ibbs [16, 19] revealed that the greater the amount of change, the lower the efficiency—and also, late project changes more adversely affect labour productivity than early changes.
4.2. Questionnaire Design
- A web-based survey administration tool, "Survey Monkey", was used for design and hosting of the questionnaire. The first version was developed after the literature review and empirical interviews. Before an industry-wide survey was launched, a pilot study was conducted, aimed at testing its suitability and comprehensibility. The final version of the questionnaire has two parts: the participant demographic questions and the principal section ranking the factors on a five-point Likert scale. The survey consisted of 38 questions, including open-ended questions soliciting feedback on additional comments on the topic. Only a few additions were made to the list by respondents, and these additions were related to the 28 factors originally presented to the respondents.
4.3. Sample Size and Population Characteristics
- Sample size determines the degree of statistical confidence available for analysis and interpretation. When sample size increases, sample error decreases and sample reliability increases. Similarly, when population variance increases, sampling error increases and sample reliability decreases [35]. The population of interest for this study was project team members involved in administrating and controlling project changes in oil and gas projects located in Alberta, Canada. A number of contact persons were identified for the companies to coordinate the administration of the survey. The questionnaires were addressed to the contact persons and then were distributed to the team members of the projects. For the purposes of this study, the desired sample size was calculated from Eq. (1) [36]:
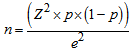 | (1) |
|
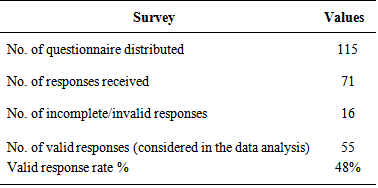
4.4. Demographic Analysis of Survey Participants
- Descriptive statistics were applied to the demographic variables, allowing the researchers to examine the characteristics of participants in the sample. Given 55 valid responses from the web-based questionnaire, Figure 2 and Figure 3 show the position and the years of experience demographics of the respondents, respectively.
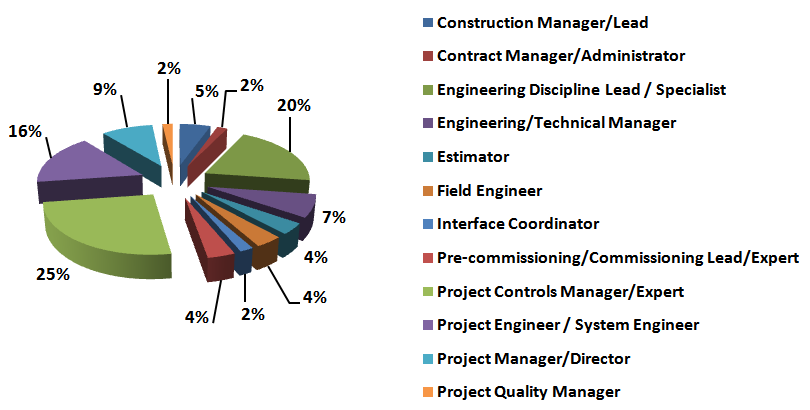 | Figure 2. Respondents’ positions demographics |
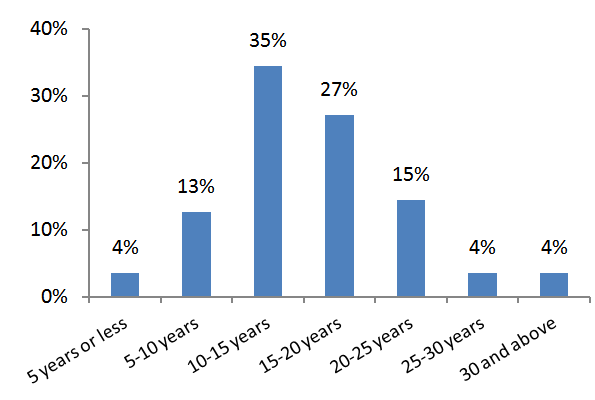 | Figure 3. Respondents’ work experience demographics |
4.5. Analysis and Ranking of Factors Contributing to Design Changes
- The quantitative analysis of factors was conducted using Microsoft Excel and the tool Statistical Package for the Social Sciences (SPSS 21). The survey required practitioners to use a five-point Likert scale (1 for "not important at all", through "slightly important", "moderately important", and "important" to 5 meaning "very important") to indicate their perceptions of the significance of different factors affecting design changes. The procedure used in analysing the results established the relative importance index (RII) for various factors. This index was computed for each factor according to Eq. (2) and Eq. (3):
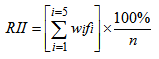 | (2) |
 | (3) |
5. Results and Discussions
- Figure 4 represents a comparison of average relative importance indices for the different categories of factors. This comparison demonstrates that all categories have significant influence on the impact of design changes, with an average importance index of 66% to 76%. The top-ranked category is factors related to project management practices, with an average relative importance index (RII) value of 76%.
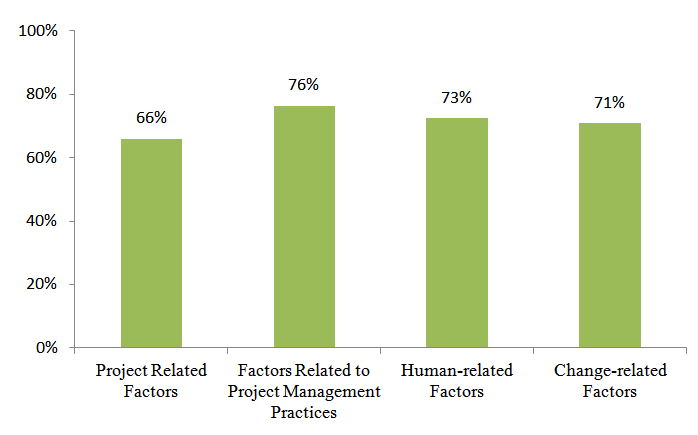 | Figure 4. Average relative importance indices for different categories of factors |
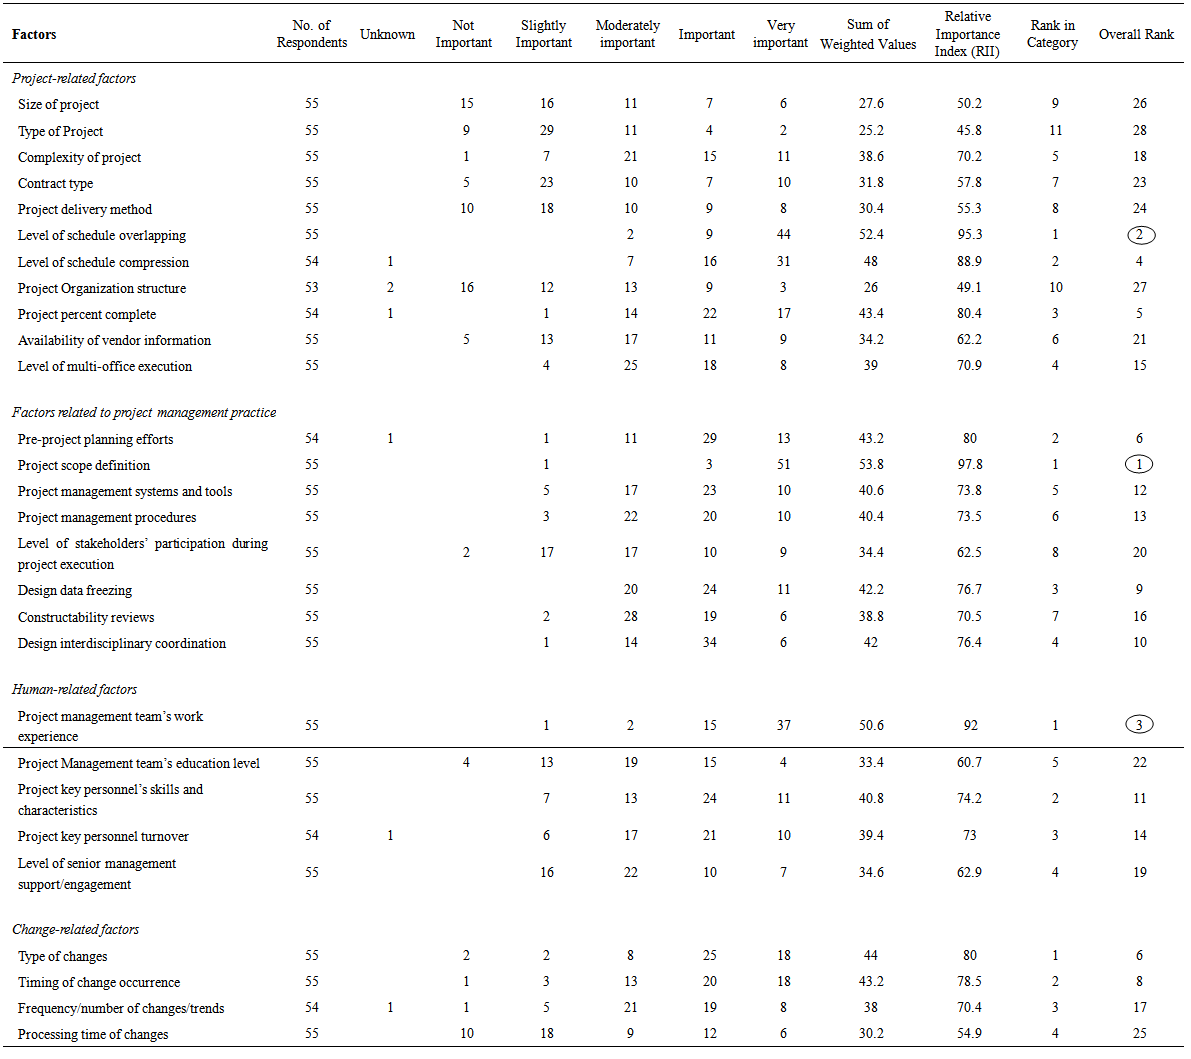 | Table 4. Relative Importance Index Computation and Ranking for Factors Influencing Design Changes |
5.1. Project Scope Definition
- Success during the detailed design, construction and start-up phases of a project depends profoundly on the level of effort expended during the scope definition phase, as well as the integrity of the project definition package [41]. According to the Construction Industry Institute [42], one of the most significant problems to affect a construction project is poor or inadequate scope definition. Poor scope definition results in high amounts of design changes throughout the execution phase, causing scope growth, loss of productivity, rework and ultimately an increase in the total cost and duration of project. The importance of project scope definition and its contribution to the project success have also been highlighted in other previous research studies [42, 43]. These studies indicate that there is a positive relationship between the level of project scope definition and the level of project success.
5.2. Level of Schedule Overlapping
- Use of schedule overlapping is becoming increasingly common in oil industry projects due to tight project schedules and budgets. To shorten project overall duration, the design and construction phases are overlapped to allow different sections to be designed and built in parallel. Many industry practitioners believe that such scheduling may result in more changes and reworks, leading to more delays, and higher costs to projects. According to the Fast Track Manual published by the European Construction Institute (ECI) in 2002, the overlapping of design and construction introduces significant additional risks due to the inter-relationship between various parts of the design [44]. The findings of the current study (i.e. Table 4) identify level of schedule overlapping as one of the most significant factors contributing to design changes. This finding supports the results of the study performed by Ibbs [17] showing that aggressively scheduled projects do have higher amounts of design change than non-aggressively scheduled projects.
5.3. Project Management Team’s Work Experience
- Of human-related factors, the project management team's work experience emerged as the most influential factor, based on the relative importance indices presented in Table 5. This finding is consistent with the study conducted by Hanna et al. [11, 12]. They investigated the impact of change orders on labour efficiency with consideration of project manager's work experience as one of the independent variables. The study showed that the more experience a project manager has, the more that individual is able to reduce inefficiency.
|
6. Validity and Reliability
6.1. Validity
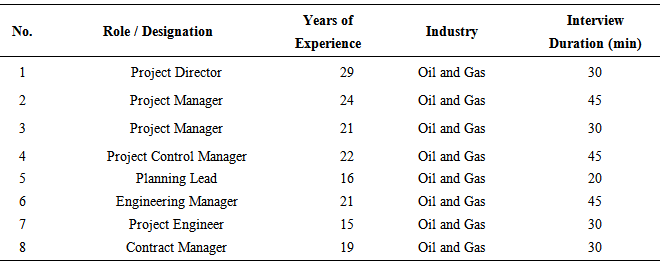
- "Validity" refers to the degree to which a survey instrument measures what it is supposed to be measuring [45]. It is thus a measure of the soundness of the research. The validity of this survey tool was determined using the face validity of the questionnaire. This validity was addressed by obtaining feedback from different experts in the field of study and from that feedback deriving corrections to be made to the questionnaire. In addition, a pilot study was conducted to make sure that the questionnaire was evaluating what it was intended to evaluate. For validation of the results, the researchers used a number of semi-structured interviews with experienced experts who were dealing with design changes in the industry. Table 5 provides information on the interviewees' profiles, and indicates that the interviewees had extensive experience in handling oil and gas projects ranging from 15 to 29 years, with an average of 21 years of professional experience. All of them were also familiar with change administration and management practices. Analysis of the responses shows that the respondents endorsed the validity of the results.
6.2. Reliability
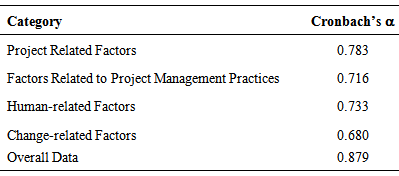
- Reliability is a measure of consistency and stability of data [46]. The reliability of this survey instrument was determined using Cronbach's α statistics, one of the most common reliability tests. This statistics uses interim correlations to determine whether constituent items are measuring the same domain [47]. Cronbach'sα reliability coefficient normally ranges between 0 and 1. The closer α is to 1.0, the greater the internal consistency of the items in the scale [48]. Reliability of data is considered at low level when Cronbach's α is less than 0.3—this suggests the data is not reliable and cannot be accepted. Reliability is at high level when Cronbach's α is more than 0.7 [40, 49-51].In this study, the value of Cronbach's α for all factors is 0.879, which indicates that strong agreement exists between industry practitioners in ranking of the factors and accordingly that the survey instrument is a reliable tool. The reliability test was conducted using SPSS version 21; the test results for each group of factors and the overall Cronbach's α for the entire data are presented in Table 6.
|
7. A Conceptual Model to Predict the Impact of Design Changes on Project Performance
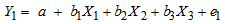
- Based on the results of the industry-wide questionnaire survey, the authors intend to demonstrate how the findings of this study can serve to develop a predictive model for pattern recognition of the impact of design changes on project cost and schedule performance. This predictive model assists project participants to more accurately estimate contingency and budget reserves at the point of project sanction. Taking into consideration the most significant factors identified in the previous stage, a number of indices are proposed as the independent variables of the model, while the dependent variables include the cost and schedule performance indicators. The following section briefly describes the basis of the predictive model and its components. Detailed steps to develop the model linking the variables and testing the hypotheses will be addressed in the authors’ future research. The structure of the model is shown in Figure 5. The predictive model will be developed through three main stages: 1. Determining the predictive/independent variables among the most influential factors identified and prioritized in the current study.2. Determining reasonable dependent variables, taking into consideration the performance indicators that properly reflect the impact of design changes.3. Formulating the predictive model using the existing techniques for prediction of the outcomes of engineering and management systems.
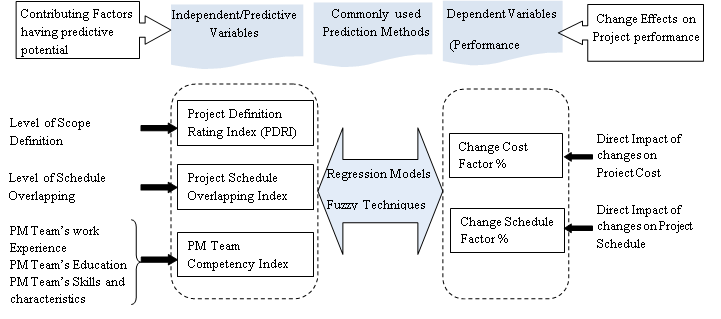 | Figure 5. A conceptual framework for pattern recognition of the impact of design changes on project performance |
 | (4) |
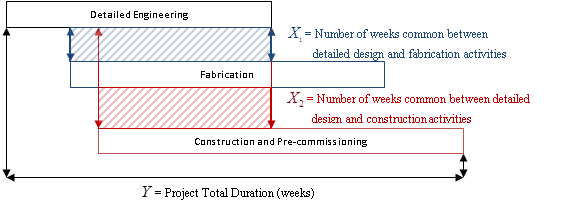 | Figure 6. Schedule overlapping between design, fabrication and construction phases of an EPC project |
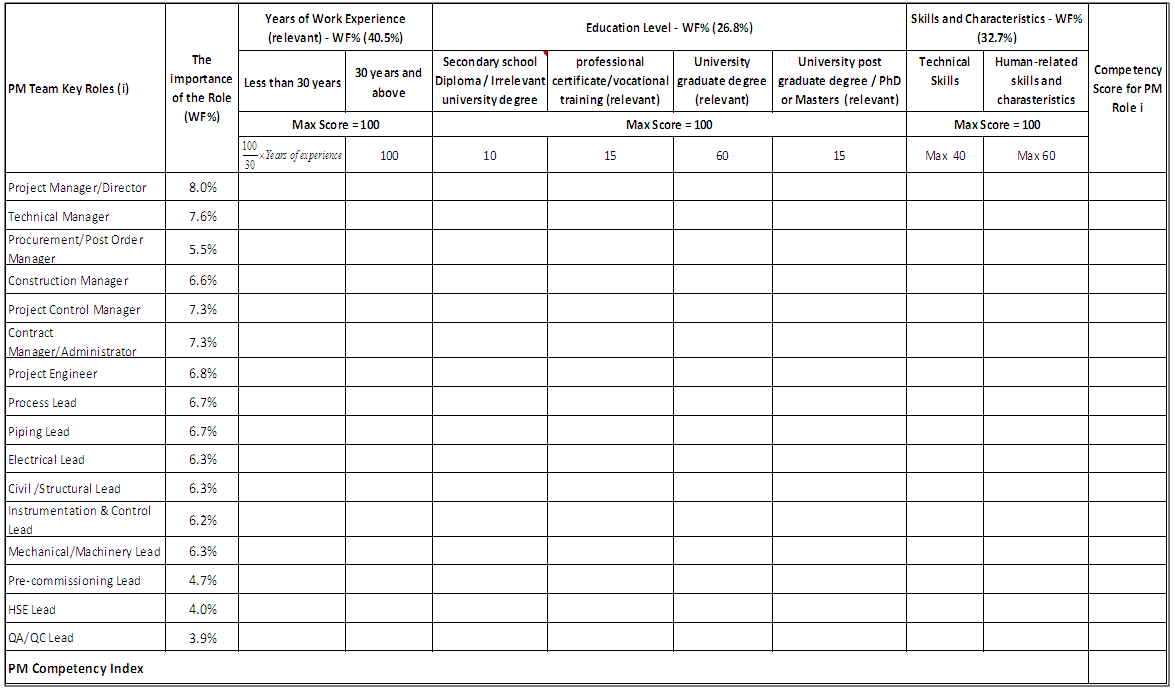 | Figure 7. An example table for PMCI |
 | (5) |
 | (6) |
 | (7) |
 | (8) |
8. Summary and Conclusions
- This paper reports on the findings of a survey conducted among practitioners in the oil industry to identify and prioritize factors influencing design changes during project execution. The required information has been collected through semi-structured interviews, knowledge-mining of completed projects, and a questionnaire survey. By analyzing and ranking the influencing factors from the viewpoint of industry practitioners, this study provides a fresh perspective on the most significant factors affecting design changes in oil and gas projects. The results show that the top three essential factors are:1. Project scope definition2. Level of schedule overlapping3. Project management team’s work experienceThe reliability analysis of the results suggests a strong consistency among respondents in their perceptions of the most influential factors associated with design changes.Good understanding of design changes, antecedents and influences is essential for effective change evaluation and management during project execution. The outcome of this study can be applied as a useful framework by project management professionals to distinguish the early warning signs of changes and to take necessary actions to prevent or mitigate the negative impacts of changes.Based on the findings of the industry survey, the authors have also proposed a conceptual model for prediction of the impact of design changes on project performance. The independent variables of the predictive model are described by three rating indices quantifying the most influential factors identified in this study. These indices are: project definition rating index, project schedule overlapping index, and project management team competency index.The predictive model presented in this study maybe used by project participants to assess the magnitude and the impact of design changes at the beginning stage of a project. Owners will therefore be able to assign more realistic schedule and budget to projects and contractors will be able to improve their cost estimates and more appropriately prepare their contingency plans before participating in a bid. Furthermore, the rating indices used to develop the model may be utilized as practical tools to assess different attributes of a project throughout project execution, including scope definition, level of schedule overlapping, and competency level of project management team.
9. Contributions
- The factors identified and evaluated in this research provide a knowledge-based foundation for the impact analysis of design changes, which may assist project stakeholders to improve the accuracy of cost estimates and project budgets. Through this research study, the authors have attempted to highlight the factors indicative of increasing the project cost and schedule due to design changes, so that appropriate actions can be undertaken to decrease the negative effects of changes. These findings are seen as significant contributions to the oil industry in controlling and managing design changes. By having a systematic approach in dealing with project changes, the performance of works will be improved and the likelihood of project success will be increased.The outcome of the predictive model may also increase owners’ and contractors’ certainty as to the cost and schedule impact of changes, and as to the amount of compensation that should be considered in the overall estimated budget to cover the cost associated with design changes.Academically, this research may serve as a guide and theoretical platform for further research, specially, on the subject of project design changes.
10. Limitations and Implications
- As with any study employing interview and questionnaire survey and statistical data analysis techniques, the research process and the results are inherently vulnerable to some issues beyond the researchers' control. These issues include the sample selection and respondents' biases. The sample selection was not entirely blind, as a survey across respondents with different experiences would create an excess amount of variation not relevant to the study. For the purpose of internal validity, the respondent group was limited to a relatively homogenous group of experts who were involved in coordinating and managing project changes in Alberta. Another limitation is related to the influence upon data of the respondents' biases. To eliminate some biases, data monitoring was performed prior to the analysis stage. As there was no pattern in the demographic information of the respondents, the possibility of response biases was mitigated.
11. Future Research
- For future studies, it would be of interest to examine and validate the predictive model presented in this study, using empirical data collected from oil industry projects. Another path forward will be further studies on how to improve and strengthen the predictive model. A comparative assessment between this model and some alternatives could also be the object of future studies.