-
Paper Information
- Paper Submission
-
Journal Information
- About This Journal
- Editorial Board
- Current Issue
- Archive
- Author Guidelines
- Contact Us
International Journal of Construction Engineering and Management
p-ISSN: 2326-1080 e-ISSN: 2326-1102
2013; 2(4): 122-135
doi:10.5923/j.ijcem.20130204.04
Construction Activities Duration Patterns in the Middle East
 Abstract
 Reference
 Full-Text PDF
 Full-text HTML
Waleed Mahfouz M. A. Youssef 1, Karim M. M. El-Dash 2, Osman M. O. Ramadan 1
1Structural Engineering Department, Faculty of Engineering, Cairo University, Giza, Egypt
2Civil Engineering Department, Faculty of Engineering, Benha University, Shoubra, Egypt
Correspondence to: Waleed Mahfouz M. A. Youssef , Structural Engineering Department, Faculty of Engineering, Cairo University, Giza, Egypt.
| Email: |  |
Copyright © 2012 Scientific & Academic Publishing. All Rights Reserved.
Construction projects’ cost and degree of complexity are mounted rapidly in North Africa and Arabian Gulf Countries inducing higher potential levels of risks to costs and time overruns; therefore, greater attention must be directed to control both time and cost. The conventional techniques for estimating activity’s duration and time scheduling have been proved themselves as unreliable techniques in front of growing construction projects’ challenge. Simulation techniques have been utilized to provide reliable solutions for risky construction project scheduling. Beta and Normal Probability Density Functions (PDF) have been widely utilized in the past to represent the activities’ duration included in simulation process. This paper presents a statistical analysis for construction activities estimated and actual durations in North African and Arabian Gulf countries. The analysis was carried out on twenty construction projects including more than 125,000 activities representing all engineering, procurement and construction (EPC) activities. The statistical analysis of results proved that the most appropriate PDF to represent the duration of activities is the Lognormal distribution followed by the Gamma distribution. However, utilizing Beta or Normal PDF may be utilized at lower confidence level. The analysis manifests that about 40% of the activities contribute to the delay of the whole project.
Keywords: Activity Duration, Probability Density Function, Simulation, Construction Delay
Cite this paper: Waleed Mahfouz M. A. Youssef , Karim M. M. El-Dash , Osman M. O. Ramadan , Construction Activities Duration Patterns in the Middle East, International Journal of Construction Engineering and Management , Vol. 2 No. 4, 2013, pp. 122-135. doi: 10.5923/j.ijcem.20130204.04.
Article Outline
1. Introduction
- Construction Project Management is about managing construction inputs and outputs. This accomplishment continues to present a predominant challenge to most construction projects all over the world. This challenge arises from two basic causes. First; time management encounter a multitude of risks are not easy to be quantified and are even too difficult to be controlled. Second, quantifying impact of risks on time and cost baselines is not a straightforward process or user friendly mathematical model. Furthermore, the construction projects are mostly characterized by their high degrees of complexity, variability, and dynamic environment. In addition, the construction projects delivery has been hampered by avalanches of drastic of risks that can be grouped in numerous categories such as; acts of God, design related risks, construction risks, construction related risks, management and administrative risks, and code related risks as elaborately explicated in[4] [6][7][8][9][17][23].No doubt that project scheduling is the backbone for the construction projects planning, monitoring, controlling, and success. The critical concern associated with project scheduling process is the estimation of activities’ durations. The more accurate the estimated duration, the more efficient planning and scheduling will be.In fact, there are too many expected scenarios for completing the project; however project managers know little information about the probability of each scenario. Simulation is the best means (up to date) to determine multiple scenarios in which it is possible to trace the stochastic critical paths[13].
2. Uncertainty in Construction Projects
- Uncertainties and risks inherently exist in construction projects. The inherent uncertainties are generally not only from the unique nature of the project, but also from the diversity of resources and activities[10]. It is commonly accepted that construction projects usually do not progress as planned. During any project, unexpected events and conditions may occur and impact the contractor’s ability to proceed with completion plans. Contractors and owners may use updated construction schedules to evaluate the effect of changes and unexpected events. Using this information to modify the schedules helps to avoid delays in project completion time[21].
2.1. Duration of Activity and Project
- Estimating realistic construction time becomes increasingly an essence because it often serves as a crucial benchmark for assessing the progress and performance of a project as well as the efficiency of the project organization [9]. One of the critical issues at the early stage of the project is determining the contract duration. Although many owners require fast completion, a thorough study must be made to determine the contract duration. Where unrealistic contract duration is imposed, this will obviously force the contractor either to accelerate the progress of the works and neglect the desired quality, or to perform the works as required but not on time[9]. On the other hand, the successful execution of construction projects and keeping them within budgeted cost and defined schedules depend on a methodology that requires sound engineering judgment[11] and[9]. Willis[26] pointed out that activity durations are just estimated, and that it is not essential for these estimates to be consistently exact. In a similar manner, if all durations are reasonable, variations in activity durations will compensate each other, resulting in reasonably accurate project duration. On the contrary, it was suggested that the accuracy in estimating activity time should not be overemphasized because doing so could make it more difficult to develop reliable duration estimates[21]. Besides, Prateapusanond[21] postulated that the accuracy of duration estimates depends on many factors including; methods of construction, resource availability, work quantity, nature or complexity of work, labor and equipment productivity, quality of field management, weather and site conditions, and concurrent activities.The conventional estimation of activities’ duration used in Critical Path Method (CPM) technique depends on a deterministic value results from the average productivity rates for all resources assigned to the activity. Using this approach does not guarantee that the project would finish on time[13]. Nevertheless, the Program Evaluation and Review Technique (PERT) uses three-point estimate instead of the traditional single-point estimate for each activity’s duration [25]. All classic techniques impoverished considering the effects of the potential risks that the construction project may encounter. Therefore, the traditional scheduling technique stands fragile in front of numerous degrees of uncertainties and risks that the construction projects may experience. Consequently, the involved parties in the construction industries might inevitably be jeopardized to unexpectedly immense losses.
2.2. Objectives of Investigating Actual Durations
- Investigating construction delays and consequent potential risks is required to assess the equitable time for project duration. This allows the contractors to prepare their construction strategy and methodology properly and precisely. Obtaining the statistical distribution of actual activity duration reveals the ambiguity relevant to the expected behavior of the activities and consequently the total project duration. With such a manner, some modifications could be applied on the contract documents in order to reduce the disputes that may occur among the involved parties in construction project. The expected adjustments to the contracts may include but be not limited to: adopting a range of time to accomplish the project instead of fixed date. Also, it may include adding motivation system for the contractor to reduce the project time and suggesting a penalty system that allows an ascending fine system instead of fixed penalty per day. In case of large projects, the period for maximum penalty is short. When the contractor fails to recover the delayed period, he loses the incentive to improve project performance. Consequently, the delayed period will be increased progressively to unrecoverable limits[5]. When the project duration is tight and/or the contractor expects more risks in the project; the contractor takes into consideration additional increase in the bid to cover any loss that may occur. The later increase is not required in most cases as reported by Al-Ghafly[5]. The present study seeks to bridge the gap between theory and application and to create a common basic language for estimating realistic activity duration and accordingly impartial project duration. The study includes projects in Arabian Gulf and African countries such as Kingdom of Saudi Arabia, Kuwait, Oman, United Arab Emirates, and Egypt. The review exercise aims to develop an overall research framework and to prepare an appropriate template for case studies.
3. Simulation
- Simulation is the process of imitating and modelling a real phenomenon or existing system with a set of mathematical formulas. A project simulation uses a model that translates the uncertainties specified at a detailed level of the project into their potential impact on project objectives[20]. Over the last three decades, simulation of construction operations and processes has demonstrated momentum in its ability to provide solutions and explain complex problems especially of iterative operations. The success of a simulation program lies in harnessing the collaborative features within a complex pattern of hierarchical levels and user groups[12]. One of the most observable hindrances for the practitioners to use simulation systems for scheduling is the high level of complexity in estimating input parameters for any simulation techniques. Researchers presented many trials to develop different types of probabilistic models to include construction project characteristics in scheduling risk boundaries[18].
3.1. Probability Distribution Functions
- Planning and scheduling for construction projects require an accurate estimate of the input information relevant to comprising activities. This accuracy is required in order to properly monitor and control the project’s time and cost.The input data for any system has three situations as classified by AbouRizk et al.[1]: (1) Sample observations are available and can be reduced to applicable deterministic or probabilistic models of the input processes; (2) sample observations are not available, and the properties of the input processes must be based on subjective information formulated or deducted from experts on those processes; and (3) sample observations are available in relatively small quantities so that the sample information must be combined effectively with subjective information to obtain the required input models. It is difficult to define the probability distribution function (PDF) for each activity due to lack of information[3]. A thorough survey for studies relevant to modeling durations has proved that there is no particular probability distribution function agreed upon. Almost all studies follow the first classification introduced by AbouRizk et al.[1] as mentioned above.Lana[13] selected gamma distribution function to represent activities without clear justifications for this selection. Meanwhile, Leemis et al.[15] explained that the triangular distribution function can be used for representing stochastic activities networks because it includes three model parameters: the optimistic, the most likely and the pessimistic times. In addition, Lucko et al.[16] used triangular distribution function in their study applying a 5% reduction from the mean value to represent the minimum value and a 25% growth as the maximum value. Furthermore, AbouRizk et al. ([1]; AbouRizk et al.[2]; Lee[14]; McCabe [18]; Nasir et al.[19]; Rege, et al.[22]; and Schexnayder et al.[24] assumed utilizing Beta distribution function because it can be approximated exploiting three parameters for its definition: the lower or optimistic limit, the mode or most likely value, and the upper or pessimistic limit. Schexnayder et al.[24] derived Beta distribution by getting the minimum and maximum activity duration values depending on the performance rates for the used equipment, while the mean value was extracted by dividing the minimum duration by a factor 0.8.One of the most important studies is that of AbouRizk et al.[2] in which they conducted of statistical analysis for seventy-one samples of durations of construction activities and concluded that the beta distribution is the most suitable to exemplify construction activity durations. The Beta distribution also fulfils the desired conditions of the probabilistic modelling for activity duration as it is: continuous over the entire range; has a unique mode in the range; and has two positive abscissa intercepts[24].
4. Parametric Study
- A comprehensive study has been carried out on actual construction projects and activities to find the appropriate PDF that can be utilized with more confidence in simulation process. Throughout the study, many Software Packages such as Microsoft Access, Primavera Project Planner 3.1, Primavera Enterprise 6.7, Microsoft Project 2010, MATLAB 2010, STATISTICA 10.0 and SPSS 20.0 have been utilized in order to collect, sort, analyse and derive statistical properties for distributions of activity durations, along with checking goodness of fit.
4.1. Scope of Study
- The study was carried out on projects in Egypt, Kuwait, Kingdom of Saudi Arabia (KSA), United Arab Emirates (UAE), and Oman. The study included about twenty distinct projects including most widespread types of construction projects for both public and private sector projects, and for small and large projects. The projects include High Rise Buildings, Commercial Malls, Hotels, Stadiums, Banks, Administration, Residential, Infrastructure and Highway Projects. The study included a huge amount of various activities that exceeded 125,000 activities, including engineering, procurement and construction (EPC) activities. The engineering activities represent all preparation activities such as shop drawings and materials submittals including samples, manufacturer data, mock ups, and testing certificate activities. Besides, the procurement activities represent all activities needed to secure the delivery of the material to site including contracts, letter of credits, manufacturing, shipping and delivery to site. While, the construction activities represent all tasks on site that require manpower and equipment to be carried out in order to produce a structure or a part of the structure, such as excavation, casting concrete, installation of steel structure, or fixing HVAC ducts. In our study samples, engineering and procurement activities constitute a portion that ranges from 6% to 68% of individual projects. While the average for all projects is about 17%. The studied construction activities were categorized according to Construction Specification Institute (CSI) master format 1995 classification and it was found that four divisions namely (03), (09), (15), and (16) represent about 80% of activities by cost.
4.2. Data Analysis
- The data was statistically analysed in order to deduce the statistical characteristics of activities durations for different case studies such as studying all activities for all project, studying CSI divisions for all projects, and studying single project containing activities with repetitive nature.
4.2.1. Characteristics of Activities Phase of Construction in All Projects
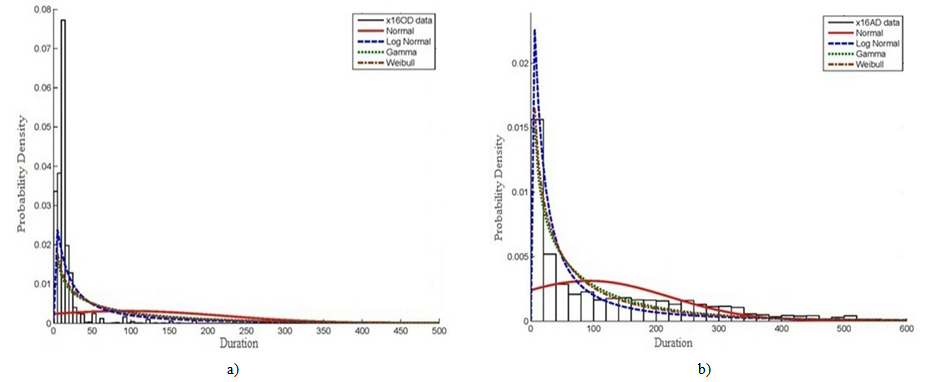
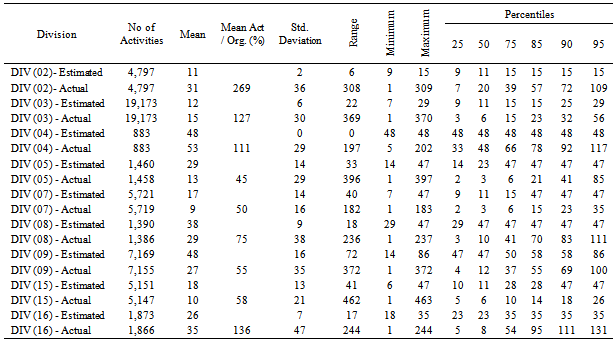
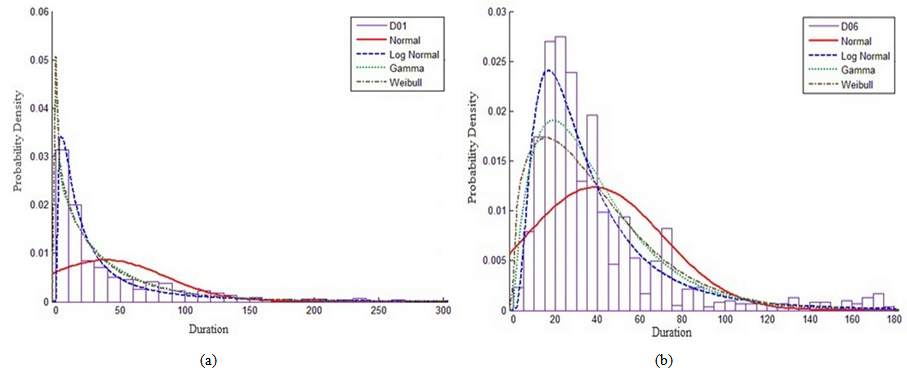
- The analysis of engineering/procurement and construction activities for all projects manifests that the mean value for actual durations relevant to construction activities represents not less 7 times more than the same for estimated durations as shown in Table 1. While the mean value for actual durations relevant to engineering / procurement activities represents about 3 times the same for estimated durations. Consequently, the average of actual duration for all activities is about 6 times that for estimated durations.Following the same analysis for all projects illustrates that the standard deviation for engineering / procurement and construction activities actual durations represent about 3 and 8 times the same for estimated values respectively. In general, the standard deviation for actual durations represents about 5 times that for estimated durations as illustrated in Table 1.It is worth noting that the coefficient of variance for estimated durations in engineering / procurement activities is higher than construction activities by about 20%. Whilst, the (C.O.V) for actual durations is almost the same for both engineering / procurement and construction activities as shown in Table 1.The second analysis applied on EPC activities for all projects includes graphical representation for estimated and actual durations along with curve fitting for the most widespread probability distribution functions utilizing MATLAB 2010 software. In addition, the fitted probability distribution functions include Normal, Lognormal, Gamma and Weibull distributions are illustrated in Figures 1, 2, and 3. The statistical behaviour and curve fitting for estimated and actual construction activities durations in all countries is shown in Figure 1. It is clear that the estimated durations' frequencies are high till 50 days, while the actual durations are smoothly distributed with gradual declination till 375 days. The utilized curve fittings in Figure 1, obviously shows that the best PDF that can represent construction activities is lognormal distribution then gamma distribution. While utilizing normal distribution fitting represents the lowest level of confidence.
|
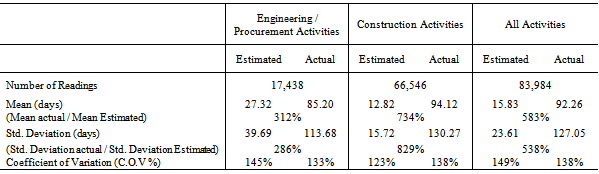
 | Figure 1. PDF and curve fitting for construction activities durations for all projects: (a) estimated durations; and (b) actual durations |
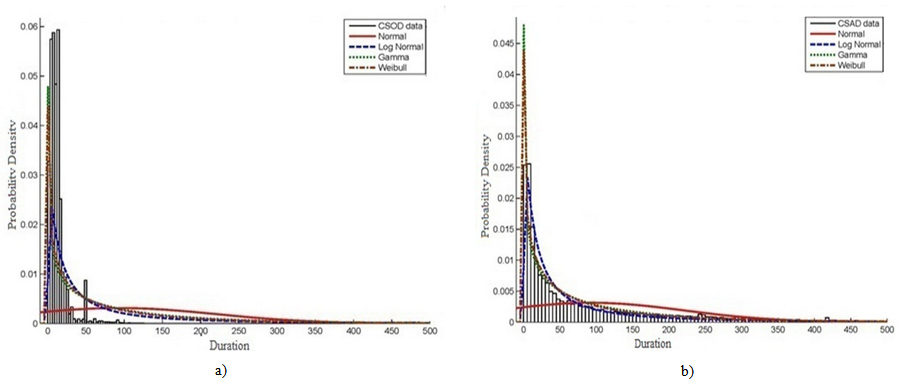
 | Figure 2. PDF and curve fitting for engineering / procurement activities durations for all projects: (a) estimated durations; and (b) actual durations |
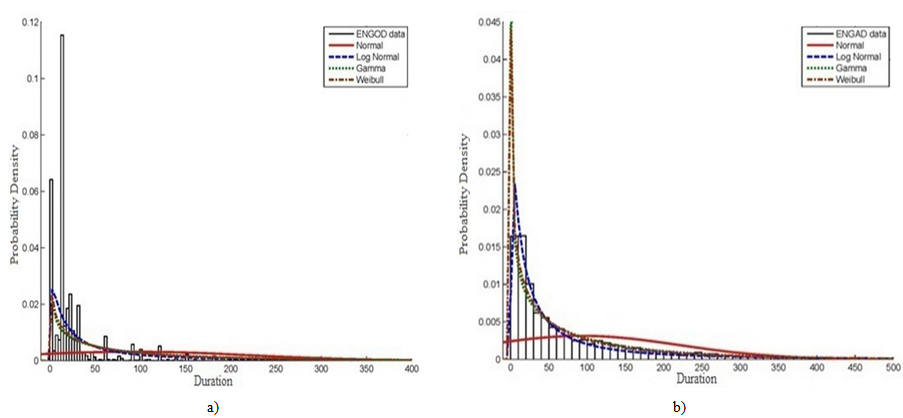
 | Figure 3. PDF and curve fitting for all construction and engineering / procurement activities durations for all projects: (a) estimated durations; and (b) actual durations |
4.2.2. Analysis of PDF per Division for All Projects
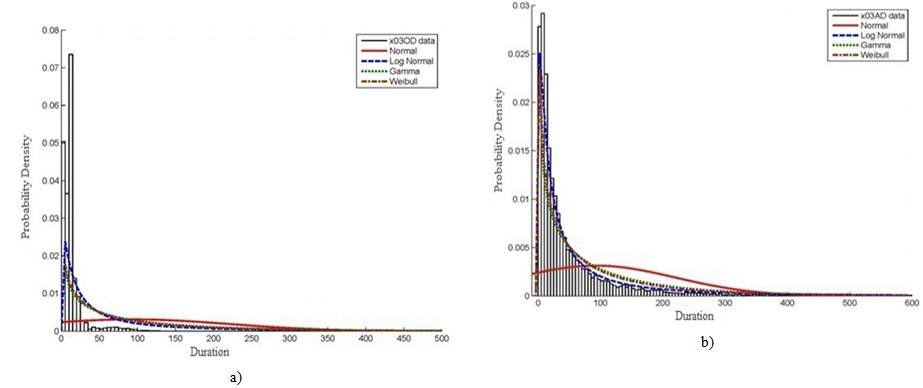
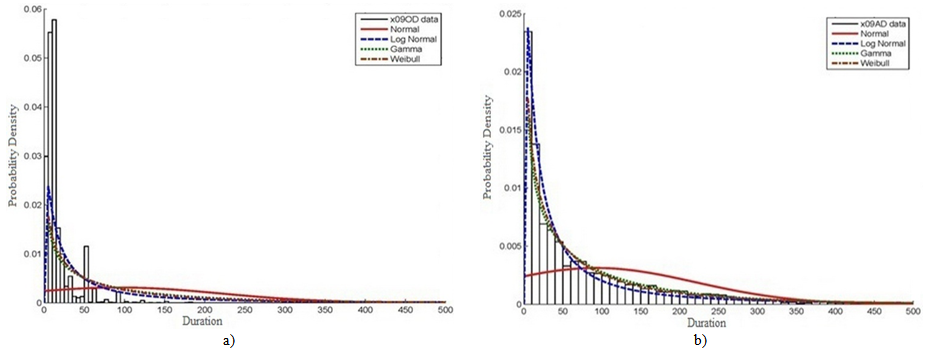
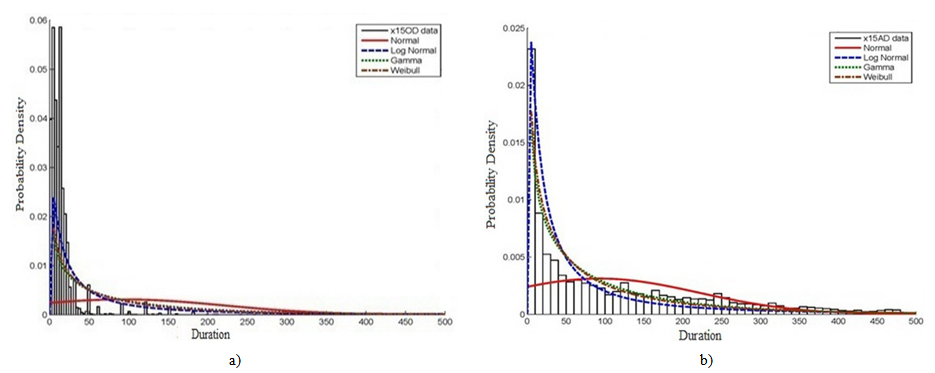
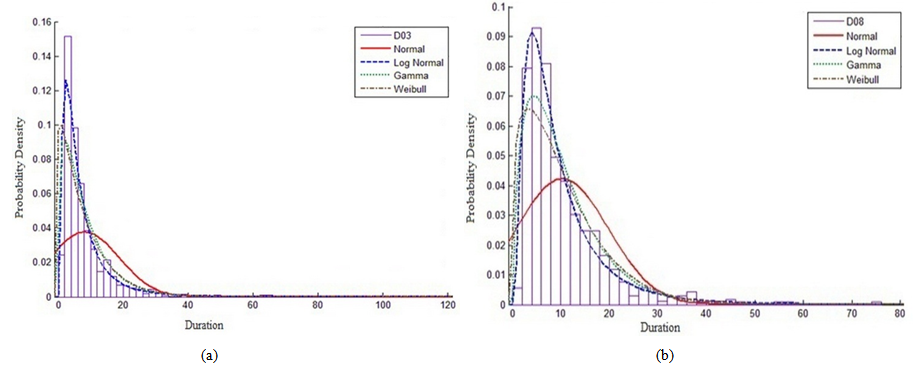
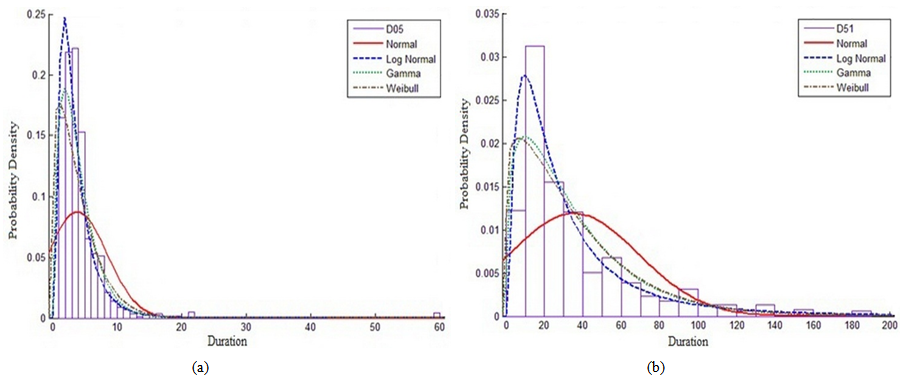
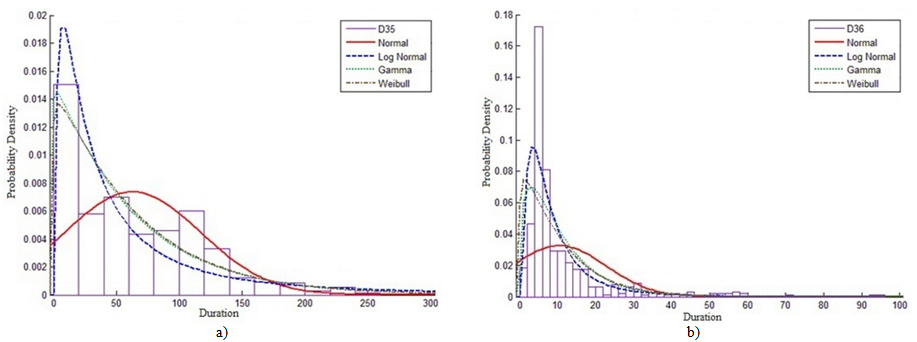
- The result of analysing PDF for each CSI division individually for all projects is summarized in Table 2. The Table shows that the minimum and maximum increase in mean values for actual durations is recorded for division (03) concrete works and division (16) electrical works that represent about 3 and 8 times the mean value for estimated durations respectively. The increment in values of mean and standard deviation for actual against estimated durations are minimum for traditional types of work such as concrete, masonry, moisture and thermal protection, and finishes works. Nevertheless, the highest increment is realized for non-traditional types of work such as mechanical, specialties, and electrical works.The graphical representations for all EPC activities derived for every individual CSI division in all projects all over the countries under study are shown in Figure 4, 5, 6, and 7. The selected divisions include civil works such as division (03) concrete works, and division (09) finishes works as shown in Figures 4 and 5 respectively. Besides, the electro-mechanical works include divisions (15) mechanical works, and (16) electrical works as in Figures 6 and 7. As might be expected, it was found that the frequencies of estimated and actual durations differ from division to division due to difference in productivity rates and nature of work. As illustrated in Figure 4 and 5, the frequencies of estimated durations for division (03) are high until the duration of approximately 35 days. While, the highest frequencies relevant to division’s (09) estimated duration for continues until the duration of 60 days. However, the frequencies of actual duration in both divisions are decreasing smoothly and homogenously up to 400 days. Generally, the best PDF to represent both estimated and actual durations for civil works is lognormal distribution and then gamma distribution. In addition, it is very clear that normal PDF is giving the lowest level of confidence when representing both estimated and actual durations for civil divisions.
|
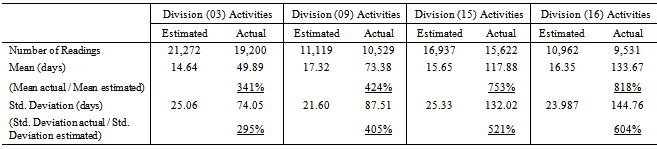
 | Figure 4. PDF and curve fitting for division (03 - concrete works) activities durations for all projects: (a) estimated durations; and (b) actual durations |
 | Figure 5. PDF and curve fitting for division (09 - finishes works) activities for all projects: (a) estimated durations; and (b) actual durations |
 | Figure 6. PDF and curve fitting for division (15 - mechanical works) activities for all projects: (a) estimated durations; and (b) actual durations |
 | Figure 7. PDF and curve fitting for division (16 - electrical works) activities for all projects: (a) estimated durations; and (b) actual durations |
4.2.3. Activities’ Delay According to CSI Divisions for All Projects
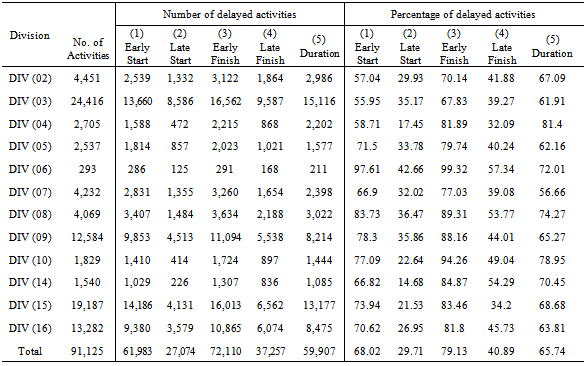
- Another analytical approach is carried out on activities included in all construction projects. The analysis considered delayed activities with respect to planned early start (ES), planned early finish (EF), planned late start (LS), planned late finish (LF), and activities that have actual durations greater than planned estimated durations. The analysis was implemented on each CSI division and on total sum of durations for activities in all projects. Table 3 show that the total number of activities under divisions (03), (09), (15), and (16) represent at least 80% of the total number of activates. Besides, the delays occurred in these four divisions is recognized as significant delays. Therefore, the delay in these four divisions constitute at least 75% of the total delayed activities in each case with respect to planned early start, planned late start, planned early finish, planned late finish, and planned estimated durations. Besides, it is simply seen that the divisions with maximum percentage of duration overruns are (04), (08), and (10). Consequently, the estimation of activity duration for these divisions should be considerably computed.
|
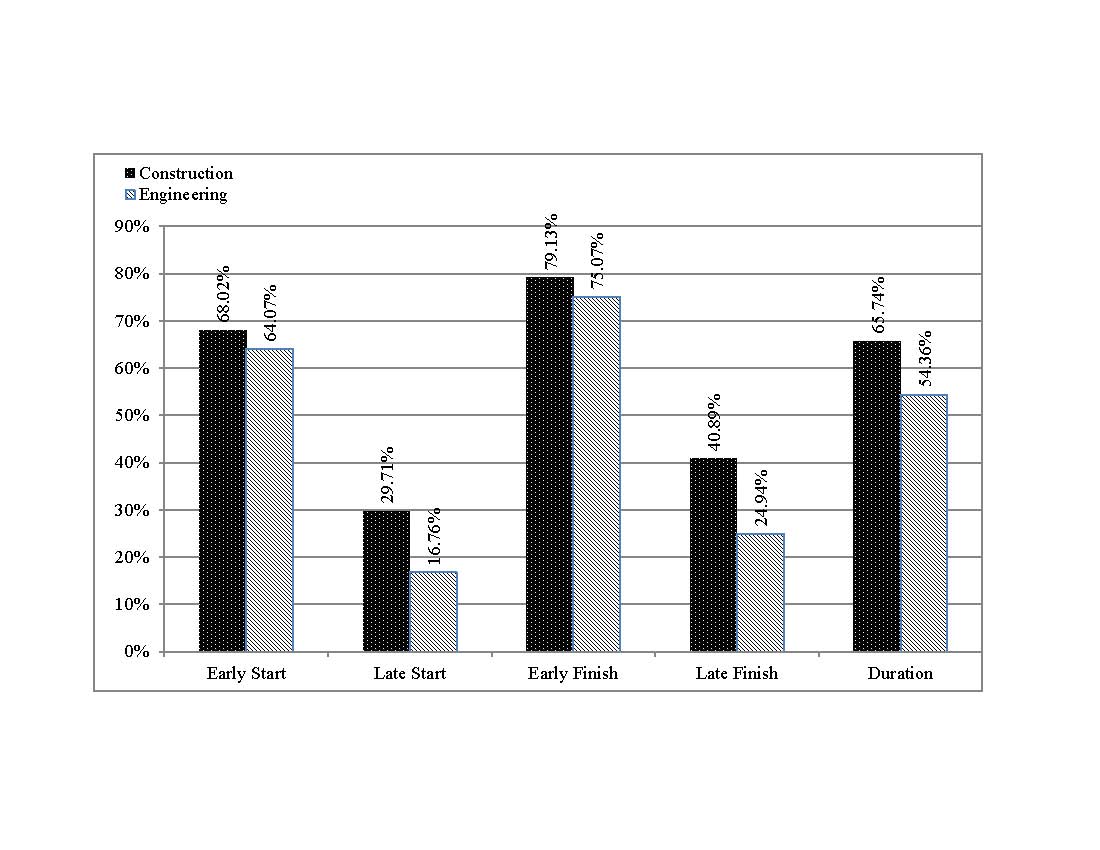 | Figure 8. The delayed activities percentages for construction and engineering / procurement sorted by cases of delay form planned dates: (1) behind early start; (2) behind late start; (3) behind early finish; (4) behind late finish; and (5) greater than estimated duration |
4.2.4. Recovery Status for Activities Delayed Than Planned Late Start
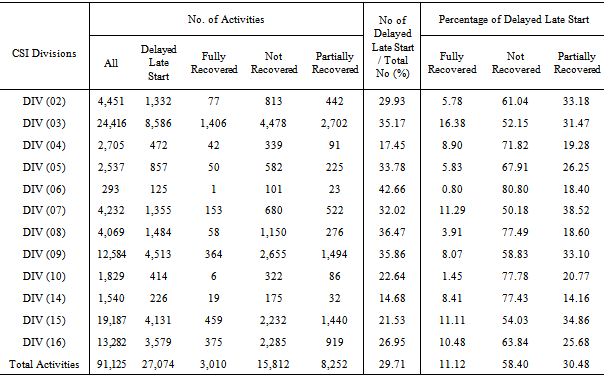
- Another key analysis was implemented on activities that are delayed compared to their original late start date to find out the compliance for these activities to recovery during the project time as shown in Table 4. The analysis accomplished on about 91,125 activities shows that about 27,369 activities are delayed with respect to their originally calculated late start dates that represent about 29.7% of all activities. Besides, the delayed activities in late start can be recovered in one of the following three categories; (1) fully recovered before their planned late finish dates; (2) not recovered and the amount of delay behind planned late start dates is the same as behind planned finish dates or even increased; and (3) partially recovered which mean that the amount of delay behind planned late start dates are less than that behind planned late finish dates.It is worth noting that about 7.7% of delayed activities in late start can be recovered as concluded form Table 4, however the activities that are not recovered and those that are partially recovered represent about 66.1% and 26.2% respectively. Consequently, about 17.35% of all activities are delayed with respect to their late start dates and can’t be recovered during the original project’s duration, and therefore cause the delay of the whole project. Accordingly, an enormous attention should be directed to start activities as early as possible.In addition, it is apparently observed that the divisions with the greatest unrecoverable delay percentages are Divisions (06), (08), (10), and (14). Therefore, a special concern should be directed towards these divisions to start at the earliest.
|
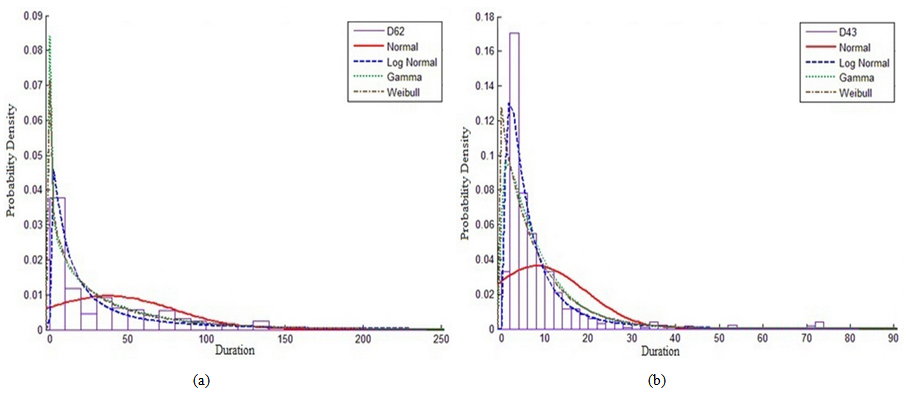
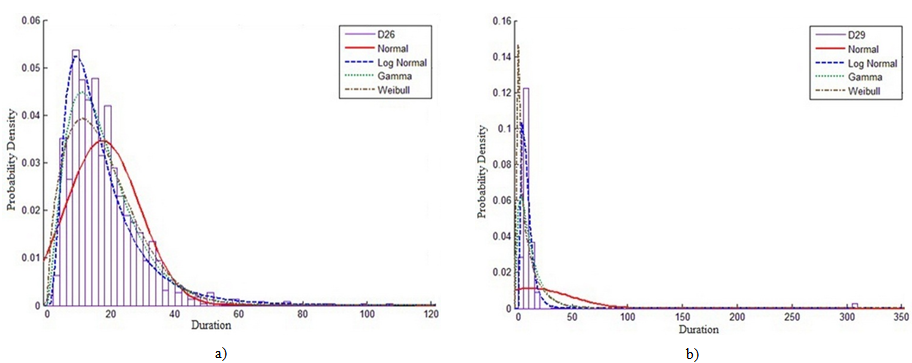
4.2.5. Comparison of Durations per Division in the Same Project
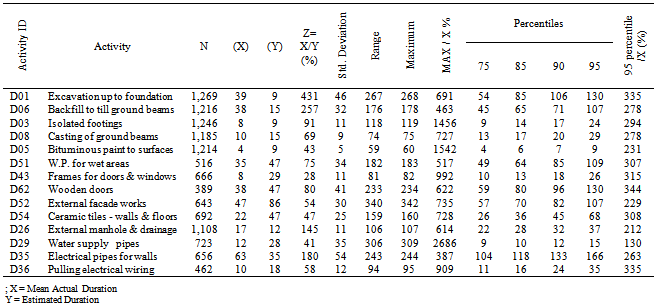
- One of the most important analyses which have been carried out in the current study is the analysis of similar activities in one project. The studied project is significantly unique, as it consists of 1271 similar housing buildings in Kuwait state. Each building consists of ground, first floor and a roof. Each building includes all civil, mechanical and electrical activities. The study includes 66 groups of similar activities that make the total activities under study is about 84,000 activities; the statistical properties for each group were extracted and summarized in Table 5. A significant note is shown in Table 5 as the mean values for actual durations relevant to divisions (05), (07), (08), (09) and (15) activities are decreased by about 25% to 50% of the estimated durations. This result contradicts the previous results shown hereinabove for the case of studying all projects. In addition, the increment in mean value for actual against the estimated durations for divisions (02) and (03) is higher than those calculated for division (16), as illustrated in Table 5.
|
|
 | Figure 9. PDF and curve fitting for division (02 - site works) activities actual durations for one project: (a) excavation up to foundation; and (b) backfill to till ground beams |
 | Figure 10. PDF and curve fitting for division (03 - concrete works) activities actual durations for one project: (a) isolated footings; and b) casting of ground beams |
 | Figure 11. PDF and curve fitting for division (07 - thermal and moisture protection works) activities actual durations for one project: (a) bituminous paint to surfaces; and (b) W.P. for wet areas |
 | Figure 12. PDF and curve fitting for division (08 - doors and windows works) activities actual durations for one project: (a) frames for doors & windows; and (b) wooden doors |
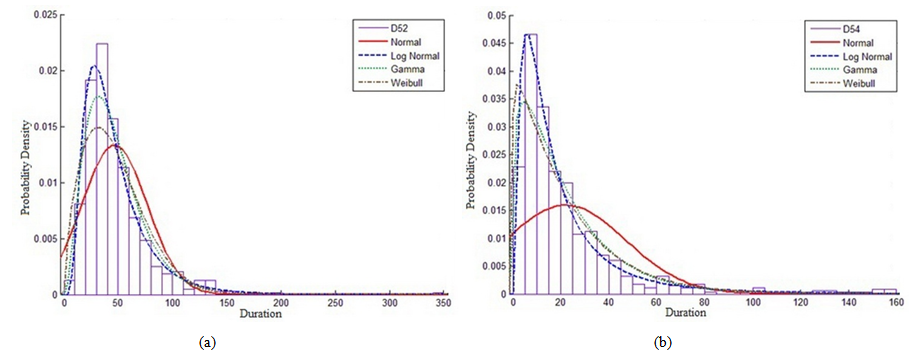 | Figure 13. PDF and curve fitting for division (09 - finishes works) activities actual durations for one project: (a) external facade works; and (b) ceramic tiles - walls & floors |
 | Figure 14. PDF and curve fitting for division (15 - mechanical works) activities actual durations for one project: (a) external manhole & drainage; and (b) water supply pipes |
 | Figure 15. PDF and curve fitting for division (16 - electrical works) activities actual durations for one project: (a) electrical pipes for walls; and (b) pulling electrical wiring |
5. Summary and Conclusions
- Comprehensive statistical analyses have been carried out on twenty large construction projects in North Africa and Arabian Gulf countries including more than 125,000 activities representing all engineering, procurement and construction activities for all trades of works. The estimated and actual durations for activities along with different cases of delays for construction activities have been analyzed to evaluate the most appropriate PDF. It was found out that: 1. The ratios of actual duration to planned duration for engineering and procurement activities, construction activities, and overall activities are 3, 8, and 5; respectively.2. The maximum increase in actual duration values is that of division (03) concrete works and division (16) electrical works which represents approximately three to eight times the estimated values.3. The maximum duration overrun percentages were recorded for divisions (04) masonry works, (08) doors and windows, and (10) specialties works. 4. The ratios of number of delayed activities behind planned early start, planned late start, planned early finish, and planned late finish dates; to overall number of activities are 68%, 29.7%, 79%, and 40.9%; respectively. However the ratio of activities induced duration overrun to the total number of activities is 65.7%.5. The analysis of delayed activities with respect to planned late start dates illustrated that only 7.7% of delayed activities can be recovered, however there still remains 92.3% which will be either partially recovered or not recovered at all.6. The graphical analysis tests of goodness for activities have proved that the most appropriate PDF for representing construction projects activities are Lognormal distribution followed by Gamma distribution, however utilizing Beta or Normal distributions provides less confidence.7. The actual ratio between pessimistic duration (upper limit) to the mean value for activities ranges between a factor of 4 to 27 times; unlike to the suggested ratio in past studies that was 25% of the mean value.
ACKNOWLEDGEMENTS
- The authors wish to acknowledge their gratitude to all the companies and authorities that participated in this study: Ministry of Public Works in Kuwait, Arab Contractors Co., Pan Arab Consulting Engineers, Al-Ghanim International Contracting Co, MSEE Establishment, and Sadeem Al-Kuwait co.