Ivana Pilipová, Silvia Vilčeková
Civil Engineering Faculty, Technical University of Košice, Košice, 042 00, Slovak Republic (Slovak)
Correspondence to: Ivana Pilipová, Civil Engineering Faculty, Technical University of Košice, Košice, 042 00, Slovak Republic (Slovak).
| Email: |  |
Copyright © 2012 Scientific & Academic Publishing. All Rights Reserved.
Abstract
Office employees spend most of their time inside the buildings in which they work. Physical conditions and office characteristics can influence both the well-being and performance of employees. But there are many other aspects of an office which can influence the perceived comfort of the indoor environment. This report presents a summary of the results from a case study conducted in a new multifunctional 5-story building in the city of Kosice, Slovak Republic, in February 2013. A post-occupancy evaluation study on the perceived comfort of the indoor environment and a self-evaluation of occupants’ performance was carried out. With data from the case study, we conducted an analysis to further explain the relationship between the degree of building intelligence and employee responses.The degree of user comfort and performance with regard to the building’s character, the physical conditions in the workplace, workplace characteristics and other factors, including visual contact with exterior, contact with plants in the interior and from the exterior, the monitoring of occupants and stays in rest areas, were all investigated. This case study highlights the fact that the monitored factors of a building with smart elements did not indicate a negative impact on the perceived comfort of the indoor environment and the occupants’ performance. The workplace environment with smart elements was rated very highly and tolerable by users. Interviews with respondents indicated that they are mostly satisfied with their indoor environment and workplace characteristics. There were no perceived (negative) factors in the workplace, because employees were too focused on their work to notice any discomfort. Respondents considered having manual control of the workplace microclimate as essential. Results show that visual contact with the exterior, contact with plants from the exterior and interior and stays in rest areas have a positive impact on user comfort and performance. Monitoring occupants in common areas primarily has a neutral effect on their comfort.
Keywords:
Comfort, Performance, Indoor Environment, Smart Building
Cite this paper: Ivana Pilipová, Silvia Vilčeková, Occupants’ Comfort and Performance in a Building with Smart Elements – A Case Study, International Journal of Construction Engineering and Management , Vol. 2 No. 4, 2013, pp. 113-121. doi: 10.5923/j.ijcem.20130204.03.
1. Introduction
There are physical and psychological factors that influence the comfort of office building users. According to Haynes, office productivity is a composite of the physical environment and the behavioural environment. The physical environment consists of the components of comfort and the office layout. The interaction of these components and distractions represents the behavioural environment[1]. A smart building can be described as a building that is suitable for its users and which provides comfort and good and efficient work and housing. An intelligent indoor space should be an adaptable and dynamic environment that optimises user services and management processes using smart systems. An intelligent indoor environment can provide better workplace conditions for users. Cook and Das defined a smart environment as one that is able to acquire and apply knowledge about the environment and its inhabitants in order to improve the experience in that environment[2].Even when all indoor environmental standards are met, users are usually not satisfied and still perceive discomfort in smart buildings. Some discomforts and negative factors in smart residential buildings, such as electrosmog, loss of contact with the exterior and nature, loss of physical deployment and privacy and the "Master-Slave” Syndrome, were investigated. A compact work space, electrosmog, the absence of personal space and inconvenient indoor air quality were marked as the main limitations of intelligent office buildings[3, 4].There is a lack of sufficient knowledge about the perceived comfort of the indoor environments of newly built smart office buildings in Slovakia. Therefore, the aim of our research is to analyse the impact of factors on the perceived state of the indoor environment in a selected multifunctional building with smart elements and to quantify the degree of influence that building intelligence has on the perceived comfort of the indoor environment and on users’ performance. Measurements of the physical and chemical factors of the indoor environment using appropriate measuring instruments were made within the framework of the experimental part of the research. Subjective evaluation of the perceived comfort of the indoor environment and performance of building users was realised concurrently. This paper reports on the analysis of a case study on user comfort and performance with regard to the building character, physical conditions in the workplace, workplace characteristics and other factors, including visual contact with the exterior, contact with plants in the interior and from the exterior, occupants’ monitoring and stays in rest areas.
2. The Monitored Object
A new multifunctional 5-story building in Kosice, Slovakia, representing an office and a salesroom workplace, shown in Figure 1, was selected for the research. Heating and cooling is covered by a VRV system with recuperation that is controlled by an intelligent touch controller. The central air conditioning system of the building can combine various indoor units into one external unit. Users can control the indoor air temperature, indoor air quality and ventilation in their workplace by using a spatial thermostat, a mechanical air ventilation option or by opening the windows. Users can also control the lighting in the workplace.The building also includes structured cabling, access control systems and a fire alarm and security camera system that provides building security and monitors the building’s common areas.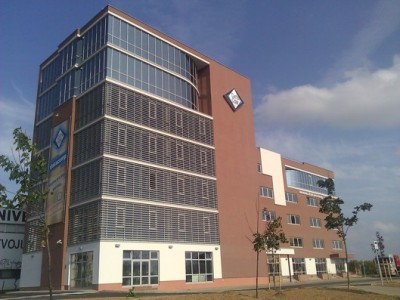 | Figure 1. Exterior view of the monitored object |
 | Figure 2. Floor plan of experimental room 1 |
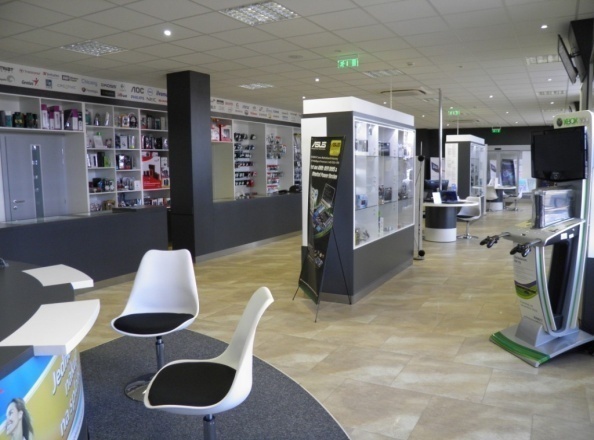
The first experimental room selected for monitoring (R1) is an office (10 x 6.2 m) and can be described as closed and shared among users, as shown in Figures 2, 3 and 4. There are new furnishings and several pieces of equipment, such as personal computers, copiers and printers. Administrative sedentary work was performed by 7 employees in the evaluated area of the workplace. 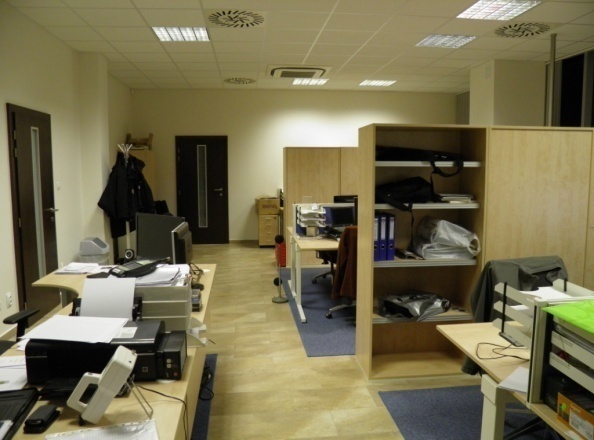 | Figure 3. Interior view of experimental room 1 |
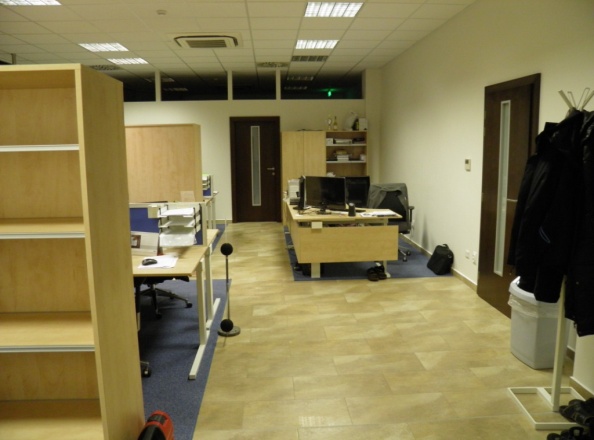 | Figure 4. Interior view of experimental room 1 |
The second experimental room selected for monitoring (R2) is a salesroom (21.2 x 7.6 m) and can be described as an open space, as shown in Figures 5, 6 and 7. There are pieces of equipment, such as a sales counter with a cash register, a photocopy machine, glass display cases, shelves and boxes of goods; in addition, there are chairs and tables used for the placement of goods and promotional leaflets. Three permanent members of staff work in the salesroom, two in service and one in the storage area.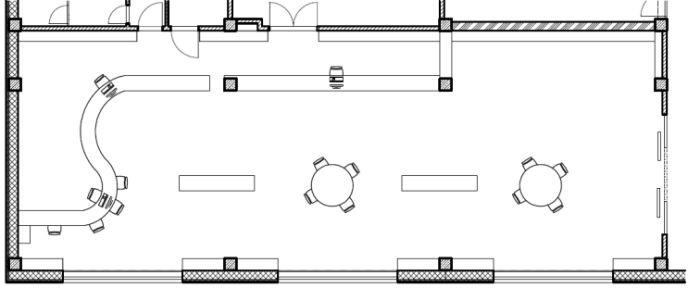 | Figure 5. Floor plan of experimental room 2 |
 | Figure 6. Interior view of experimental room 2 |
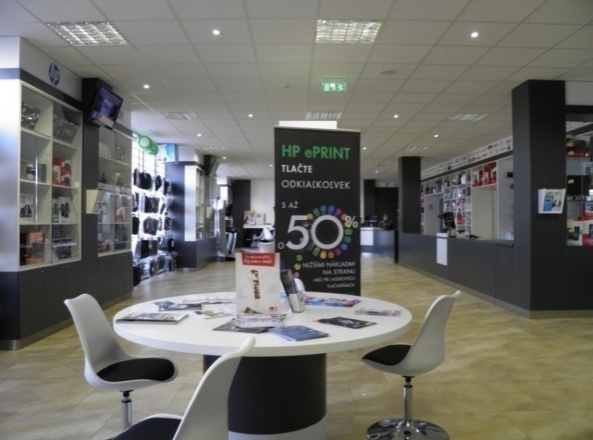 | Figure 7. Interior view of experimental room 2 |
The experimental rooms have full glass windows directed to the south-east. Occupants have a partial view on a built-up and grassy area. There were no outdoor blinds on the windows, though occupants can control indoor vertical blinds. There are no plants and aesthetical elements in the experimental rooms or in the common areas of the monitored object. There is a camera security system in the R2 workplace and in common areas.
3. Methodology
Evaluation of the indoor environment is based on measurements of both physical and chemical factors. Evaluation of occupants’ comfort and performance is based on paper questionnaires filled out by the occupants; in addition, respondents evaluated the indoor environmental conditions in the moment and in general during the winter season.MeasurementsPhysical measurements were taken for 5 days in winter at intervals from 12:00 – 18:00 hrs. The measurements were carried out during normal building operations. Measurements for thermal comfort, air quality, acoustics and lighting were taken in the two experimental rooms on the 1st (R1) and 5th floors (R2). Measurements were analysed against the occupants’ response for each element of the indoor environment in the moment and in general. The following factors were measured in both experimental rooms:• air temperature, • global temperature, • air velocity, • relative humidity, • CO2 concentrations, • particulate matter (PM) concentrations, • volatile organic compounds (VOCs), • lighting,• noise. Assessment in the momentThe questionnaire for assessment in the moment covered a wide range of variables related to:• demographic characteristics of the occupants• perception, sensual evaluation and preference of indoor environmental conditions, • perception of sick building syndrome (SBS) and health symptoms during assessment,• overall evaluation of indoor environmental conditions.• impact of indoor environmental conditions on occupants’ performance,Assessment in generalThe questionnaire focused on a general assessment covered a wide range of variables related to:• demographic characteristics of the occupants• satisfaction with workplace characteristics, • perception, sensual evaluation and preference of indoor environmental quality, • satisfaction with control of indoor environmental factors, • overall evaluation of the indoor environment• perception of other factors,• impact of the indoor environmental factors on occupants’ performance, The perception of other indoor environmental factors was investigated. These included visual contact with the exterior and with plants in the interior and from the exterior, stays in rest areas and the monitoring of occupants. The factors selected for evaluation in this study are specified in section 4.The questionnaires focused on evaluation in the moment were distributed to all staff working in both of the experimental rooms and were generally collected at the same time. A total of 118 questionnaires were obtained from respondents from both rooms. Respondents consisted of 10 men and 1 woman and were from 20 to 40 years of age. The questionnaires focused on a general evaluation were distributed to all staff working in the experimental building. A total of 30 questionnaires were obtained from all concerned respondents. Respondents consisted of 22 men and 8 women and were 20 to 50 years of age.
3.1. Satisfaction Ratings
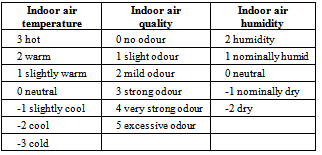
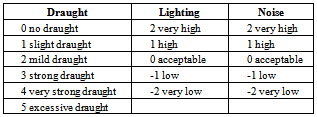
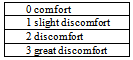
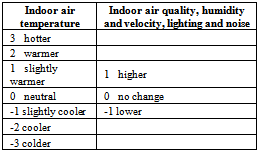
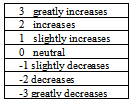
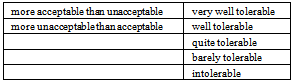
Different types of evaluation scales were used in the questionnaires. These included scales of perception (Tab. 1, 2), scales of sensual evaluation (Tab. 3), scales of preference (Tab. 4), a performance scale (Tab. 5), an overall evaluation scale (Tab. 6) and a comfort scale (Tab. 7)[5].Table 1. The perception scales
 |
| |
|
Table 2. The perception scales
 |
| |
|
Table 3. The sensual evaluation scale
 |
| |
|
Table 4. The preference scales
 |
| |
|
Table 5. The performance scale
 |
| |
|
Table 6. The overall evaluation scales
 |
| |
|
Table 7. The comfort scale
 |
| |
|
4. Assessment of Indoor Environmental Quality and Occupants’ Satisfaction, Comfort and Performance
4.1. Measurements
The following values of physical and chemical factors were obtained: The minimum measured air temperature for R1 was 21.2°C, the maximum 22.2°C and the mean value 21.98°C; for R2 these values were 20.7°C, 23.9°C and 21.83°C, respectively. The minimum measured air humidity for R1 was 36.5%, the maximum 48.4% and the mean value 43.3%, and for R2 these values were 28.1%, 42.1% and 36.7%, respectively. For air velocity the minimum measured value was 0.0m/s, the maximum 0.09m/s and the mean 0.04m/s for R1, and for R2 these values were 0.0m/s, 0.10m/s and 0.05m/s, respectively. The mean values of the operative temperature were 21.8°C in R1 and 21.36°C in R2. The measured values of operative temperature, air velocity and relative humidity satisfy the requirements of Notice of Ministry of Health of Slovak Republic No. 259/2008.The minimum measured CO2 concentration was 972ppm, the maximum 2224ppm and the mean value 1546.4ppm for R1 and 712ppm, 1403ppm and 1100.5ppm for R2, respectively. Most of the average CO2 concentration values did not satisfy the requirements of Standard EN 15251 in either R1 or R2.For intensity of lighting the minimum measured value was 361lx, the maximum 585lx and the mean 470.1lx for R1. For R2 the figures were 190lx, 344lx and 254.83lx, respectively. The average values for lighting did not satisfy the requirements of Notice of Ministry of Health of Slovak Republic No. 259/2008. The minimum measured noise level for R1 was 48.39dB, the maximum 53.99dB and the mean value 51.9dB. For R2 the figures were 49.9dB, 51.7dB and 51.1dB, respectively. The measured values of LAEX,8h for R1 did not satisfy the requirements of Notice of Ministry of Health of Slovak Republic No. 115/ 2006, though those for R2 did.The occurrence of a volatile organic compound (VOC) in the form of isobutylene was detected in R1, with a maximum concentration of 149 mg/m3. No VOCs were found R2.The investigation of particulate matter (PM) included measurement for fractions of 0.5, 2.5 and 10.0 micrometers (PM0.5, PM2.5 and PM10). As mentioned above, measurements in R1 confirmed the existence of a volatile organic compound in the form of isobutylene, with a maximum concentration of 149µg/m3 and an average of 70µg/m3, while no VOCs were detected in R2.The mean values of the total PM concentrations were 225.7µg/m3 (R1) and 132.6µg/m3 (R2), respectively. It can be said that the mass concentrations of PM10 more than quadrupled (R1) and more than doubled (R2) the limit value of 50 mg/m3 according to Notice of Ministry of Health of Slovak Republic No. 259/2008.
4.2. Occupants’ Satisfaction with Workplace Characteristics
Occupants’ satisfaction with workplace characteristics included workplace layout; workplace cleanliness, maintenance and equipment; and workplace aesthetics.
4.2.1. Occupants’ Satisfaction with the Workplace Layout
Occupants’ satisfaction with workplace layout involved workplace layout, the position of the workstation in the workplace and privacy in the workplace.Subjective evaluation shows that occupants are mostly satisfied with the workplace layout and the position of the workstation, but fewer occupants are satisfied with privacy in the workplace, as shown in Figure 8.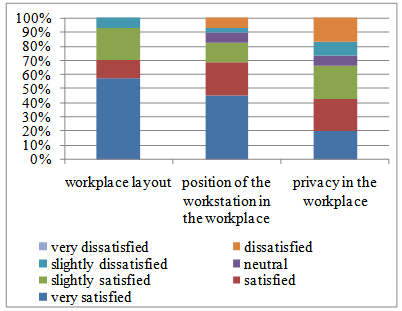 | Figure 8. Summary of occupants’ satisfaction with workplace layout |
 | Figure 9. Summary of occupants’ satisfaction with cleanliness, maintenance and workplace equipment |
4.2.2. Occupants’ Satisfaction with Workplace Cleanliness, Maintenance and Equipment
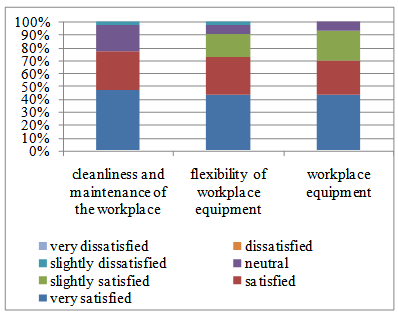
Results show (Figure 9) that occupants are mostly satisfied with the workplace cleanliness, maintenance, flexibility and equipment.
4.2.3. Occupants’ Satisfaction with Workplace Aesthetics
Results show (Figure 10) that occupants are mostly satisfied with workplace aesthetics, the nicety of the workplace and the colour of the finishes in the workplace.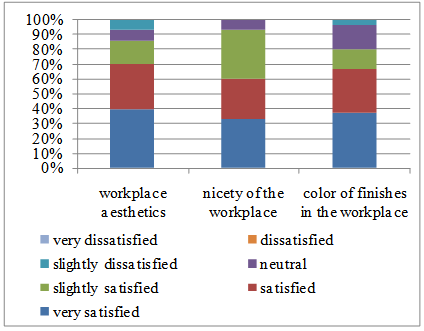 | Figure 10. Summary of occupants’ satisfaction with workplace aesthetics |
In conclusion, we can say that the workplace characteristics are received positively by occupants, with the exception of privacy in the workplace.
4.3. Occupants’ Perception, Sensual Evaluation and Preference of Indoor Environmental Quality
4.3.1. Occupants’ Perception of Indoor Environmental Conditions
The aim of these questions was to determine occupants’ perception of indoor environmental quality. The following figures show a comparison of occupants’ perceptions of indoor environmental quality in the moment and in general.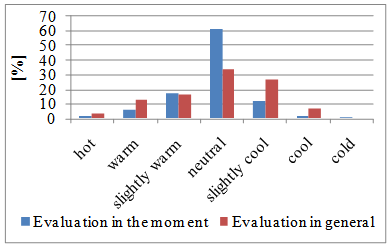 | Figure 11. Summary of occupants’ perception of indoor air temperature |
Results show (Figures 11 - 14) that perception of the individual factors of the indoor environment in general is more negative than in the immediate evaluation. Factors were perceived as acceptable, neutral or mostly weren’t perceived at all.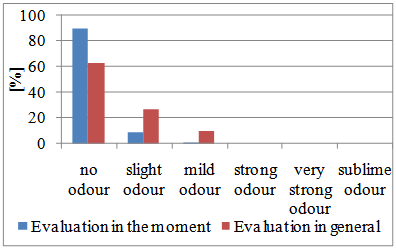 | Figure 12. Summary of occupants’ perception of indoor air quality |
 | Figure 13. Summary of occupants’ perception of lighting |
 | Figure 14. Summary of occupants’ perception of noise |
4.3.2. Occupants’ Sensual Evaluation of Indoor Environmental Conditions
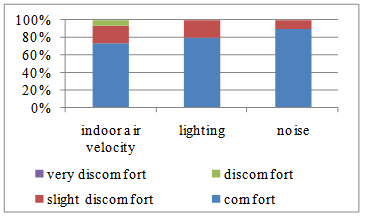
Results show that the noise level (Figure 16) was evaluated as the most comfortable state and indoor air temperature (Figure 15) as the least comfortable state from all the factors in general. Most respondents reported the incidence of these SBS symptoms and health symptoms during the course of the research as follows: the need for rest, difficulty in breathing and feeling sleepy (yawning), a general feeling of fatigue. Among the less marked symptoms were thirst, headache, difficulty in thinking and eye strain. 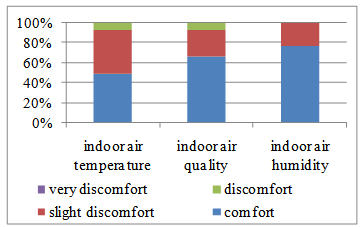 | Figure 15. Summary of occupants’ sensual evaluation of indoor air temperature, air quality and air humidity |
 | Figure 16. Summary of occupants’ sensual evaluation of indoor air velocity, lighting and noise |
4.3.3. Occupants’ Preference of Indoor Environmental Conditions
The following figures show occupants’ preference in general.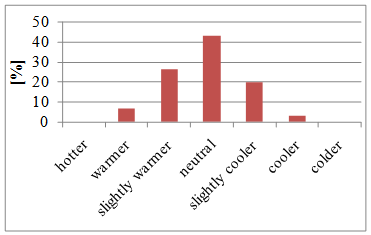 | Figure 17. Summary of occupants’ preference of air temperature |
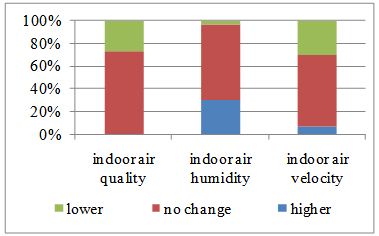 | Figure 18. Summary of occupants’ preference of air quality, air humidity and air velocity |
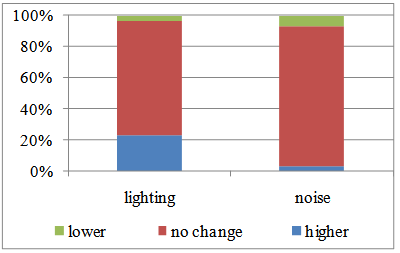 | Figure 19. Summary of occupants’ preference of lighting and noise |
Results show that the majority of respondents require no change of individual factors in general (Fig. 17, 18 and 19).
4.4. Occupants’ Satisfaction with Control of Indoor Environmental Factors
The following figures show occupants’ satisfaction with control of the individual factors of the indoor environment. Awareness of the functioning of indoor environmental controls is acceptable (43%), high (27%) and low (13%) according to occupants. Most respondents were neutrally satisfied (30%), satisfied (27%) and very satisfied (27%) with the effectiveness of the indoor environmental controls. Most respondents were slightly satisfied (30%), very satisfied (27%) and satisfied (20%) with the speed of the indoor environmental controls, as shown in Figure 20.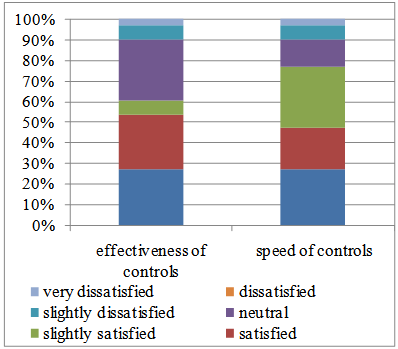 | Figure 20. Occupants’ satisfaction with control of indoor environmental factors |
Respondents considered it necessary to have manual control of the microclimate of their workplace: 67% marked control of the air temperature as necessary, while 83% marked control of air quality, and 97% considered control of light in the workplace as necessary. Respondents were very satisfied (27%) and satisfied (30%) with manual control of indoor air temperature and very satisfied (30%) and satisfied (27%) with manual control of lighting. Among the most common forms of temperature control were control by thermostat (63%) and the opening of windows (50%). The most common form of indoor air quality control was the opening of windows (80%), though occupants could also control air ventilation using the thermostat.
4.5. Occupants’ Perception of Other Factors
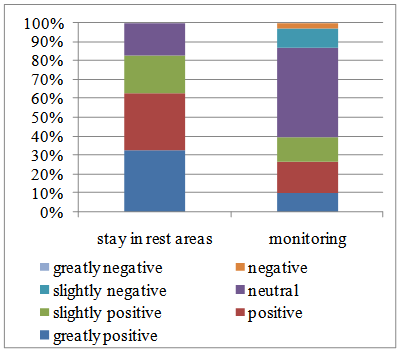
Visual contact with the exterior has a positive effect (33%) and neutral effect (30%) on respondents’ comfort. Contact with nature from the exterior has a neutral effect (33%) and a positive effect (27%) on the comfort of respondents, while 67% of users would like to have more plants in their workplace and 70% would prefer flowerless plants. Contact with plants in the interior has a slightly positive (30%), positive (20%) and greatly positive (20%) effect on comfort, as shown in Figure 21. Results show that 30% of respondents evaluate a stay in rest areas as greatly positive and 30% as positive. The monitoring of occupants has a mostly neutral effect on their comfort, as shown in Figure 22.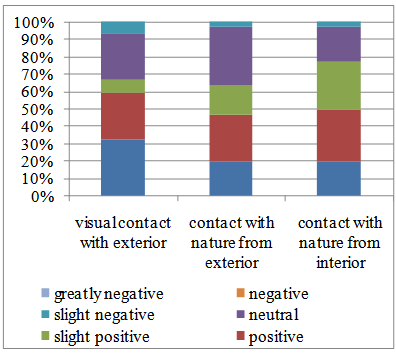 | Figure 21. Occupants’ perception of visual contact with exterior and plants |
 | Figure 22. Occupants’ perception of stay in rest areas and monitoring |
4.6. Overall Evaluation of the Indoor Environment
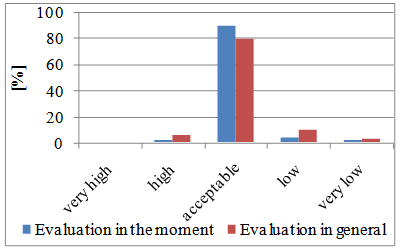
Occupants (97%) marked indoor environmental conditions as more acceptable than unacceptable in general, with 47% considering the indoor environment as very well tolerable and 43% as well tolerable.
4.7. Impact of Indoor Environmental Conditions on Occupants’ Performance
Respondents from R1 self-evaluated their performance in the range of 80-100% due to immediate conditions of the indoor environment during the course of the research, while respondents from R2 self-evaluated their performance in the range of 70-90%.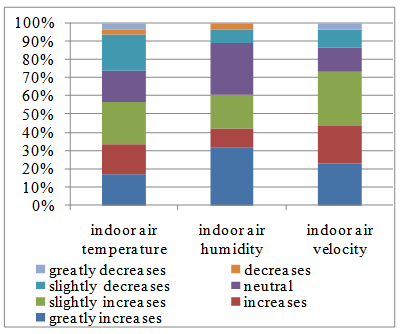 | Figure 23. Impact of indoor air temperature, air humidity and air velocity on occupants’ performance |
 | Figure 24. Impact of indoor air quality, lighting and noise on occupants’ performance |
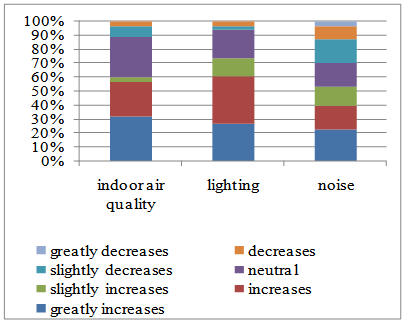
The following Figures (23 and 24) show the impact of individual factors of the indoor environment on occupants’ performance in general. The thermal state of the indoor environment was rated as slightly increasing (23%) and slightly decreasing (20%) respondents’ performance. Indoor air humidity and air quality has a greatly increasing (30%) and neutral (27%) effect on the performance of occupants. The effect of air velocity was rated as slightly increasing (30%), strongly increasing (23%) and increasing (20%) performance. Lighting in the workplace has an increasing (33%), strongly increasing (27%) and neutral (20%) effect on the performance of respondents. Noise has a strongly increasing (23%), increasing (17%), neutral (17%) and slightly reducing (17%) impact on performance.
4.8. Impact of Other Factors on Occupants’ Performance
 | Figure 25. Impact of visual contact with exterior and plants on occupants’ performance |
 | Figure 26. Impact of stays in rest areas and monitoring on occupants’ performance |
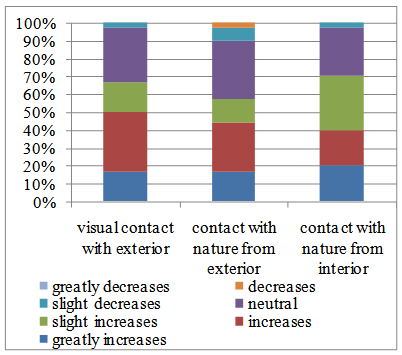
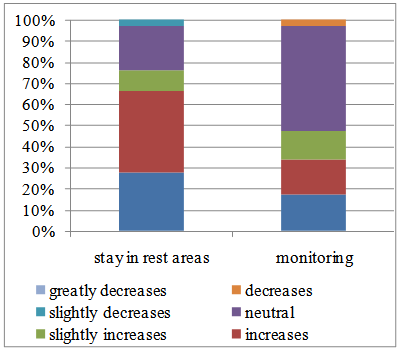
Results show that visual contact with the exterior increases the performance of 33% and have a neutral effect on 30% of respondents. Contact with plants from the exterior has a neutral impact on the performance of 33% and improves the performance of 27% of respondents, while respondents said that contact with plants in the interior slightly increases their performance (30%), has neutral impact (20%), increases or greatly increases their performance (20%) in the workplace (Figure 25). The largest number of respondents (37%) evaluated a stay in rest areas as increasing their performance, 27% as greatly increasing and 20% with a neutral effect. Finally, 50% of users judged the impact of monitoring their performance as neutral, 17% as greatly increasing, 17% as increasing and 13% as slightly increasing (Figure 26).
5. Conclusions
The results of the research offer several findings. The impact of the monitored factors in the selected building with smart elements is received positively by users, while no significant negative effect was found on perceived comfort of the indoor environment and users’ performance. The workplace environment was rated as very well and well tolerable by users. Workplace characteristics were received positively by occupants, with the exception of privacy in the workplace.Respondents considered having manual control over the microclimate of their workplace as necessary. Manual control of lighting in the workplace was marked as the most desired. Opening windows was the most common form of indoor air quality control, though occupants could control air ventilation with a thermostat.The perception of the individual parameters of the indoor environment in general is more negative than in the immediate evaluation. Although respondents perceived SBS symptoms and excessive concentrations of carbon dioxide in the indoor environment, they rated the air quality as comfortable and acceptable. Interviews with respondents also found that they did not perceive (negative) factors in the workplace because they were too focused on their work and did not notice the discomfort.Results show that visual contact with the exterior, contact with plants from the exterior and interior and stay in rest areas all have a positive impact on users’ comfort and performance. Contact with plants in the workplace is required by occupants. Evaluation of comfort and performance in relation to the degree of building intelligence requires a comprehensive view. Further research in buildings with varying degrees of intelligence could provide further insight into the impact of the intelligence of a building on the perceived comfort and performance of users.
ACKNOWLEDGEMENTS
This case study was financially supported by European Union Structural Funds (Grant code: ITMS 26220120037) and the Grant Agency of Slovak Republic to support projects, No. 1/0405/13 and No. 004TUKE-4/2011.
References
| [1] | Haynes, B. P., Research design for the measurement of perceived office productivity, Intelligent Buildings International, 2009, vol. 1, no. 3, s. 169-183. |
| [2] | Cook, D. J., Das, S. K. (2007). How smart are our environments? An updated look at the state of the art, Pervasive and Mobile Computing, vol. 3 (no. 2), pp. 53- 73. |
| [3] | Puškár, B. (2008). Intelligent residential buildings, Bratislava: Verlag Dashöfer, p. 60, ISSN 1335-8634. |
| [4] | Li Z.S., Zhang G.Q., Liu J.L. Impact of indoor environment on comfort and productivity in intelligent building. Proceedings: Indoor Air 2005. pp. 314–317. |
| [5] | STN EN ISO 10551 Ergonomics of the thermal facilities. Assessment the effect of heating equipments according to subjective scales of assessment. Bratislava. 2002. pp. 28. |
 Abstract
 Reference
 Full-Text PDF
 Full-text HTML