-
Paper Information
- Previous Paper
- Paper Submission
-
Journal Information
- About This Journal
- Editorial Board
- Current Issue
- Archive
- Author Guidelines
- Contact Us
International Journal of Construction Engineering and Management
p-ISSN: 2326-1080 e-ISSN: 2326-1102
2013; 2(3): 53-61
doi:10.5923/j.ijcem.20130203.03
System Dynamics for Outsourcing Construction Services
 Abstract
 Reference
 Full-Text PDF
 Full-text HTML
Stephen D. Lisse
Industrial and Systems Engineering Department, Virginia Polytechnic Institute and State University, Falls Church, Virginia, 22043, USA
Correspondence to: Stephen D. Lisse, Industrial and Systems Engineering Department, Virginia Polytechnic Institute and State University, Falls Church, Virginia, 22043, USA.
| Email: |  |
Copyright © 2012 Scientific & Academic Publishing. All Rights Reserved.
This study developed a system dynamics model for determining the outcome for outsourcing work in a construction project. A literature review was performed on the application of system dynamics for outsourcing of resources in construction projects. For the most part, the reviewed papers indicate the additional construction resources provided were totally insourced or the authors were silent regarding any resources that were outsourced. A system dynamics model to account for the impacts of outsourcing various percentages of the construction services to sustain a construction project over a specified time horizon was developed using Vensim software. Results of running this model indicate that the amount of effort of construction work depends upon both the productivity and quality of the outsourced construction services as well as project manning constraints. The percent of outsourcing construction work may also produce schedule overrun in the overall time to complete the required work tasks in the construction project.
Keywords: System Dynamics, Outsourcing, Project Management, Quality, Construction, Productivity, Learning Curve
Cite this paper: Stephen D. Lisse, System Dynamics for Outsourcing Construction Services, International Journal of Construction Engineering and Management , Vol. 2 No. 3, 2013, pp. 53-61. doi: 10.5923/j.ijcem.20130203.03.
1. Introduction
- The ability of owners and managers to execute large and complex construction projects is dependent upon implementing best construction practices that realize affordability and cost management. It is becoming increasingly imperative to provide quality professional construction services within existing and projected budgetary and time constraints.Experience has shown that outsourcing construction services on large, complex, and long-term projects can produce short-term profitability but can have negative impacts upon the project and organizational sustainability. By insourcing construction services, the project organizational core competencies are usually increased leading to both long-term financial and operational sustainability. By using system dynamics (SD), the performance of professional construction services can be expressed as a feedback model that can enable project management to understand how a construction problem developed over time, and assist in finding a lasting solution to the problem. The system dynamic approach incorporates subjective factors that have important influences on the whole project. Accordingly, the SD model will enable managers to prudently decide what, if any, project construction services to outsource in lieu of in-house accomplishment in order to satisfy the project financial and time requirements.
2. Literature Review
- Huot and Cooper discussed system dynamics to model large projects strategy management by three primary components[1]. Those components are the state of the system, the rates of change, and the information networks. In a series of causal loops, the impacts of construction productivity to engineering productivity were linked to give project management decision makers a dynamic tool to access project schedule outcomes.Braunschweig and Huot used the MINISAMI micro-version of Program Management Modelling System (PMMS) to model design accomplishment with the number of drawings achieved[2]. The two concepts in this model were the productivity is the rate at which drawings are produced and the quality is the percentage of drawings that will not require rework. A resultant causal loop model for Manpower Assignment and Performance Indicators was developed and showed schedule slippage for added design work after the initial design had been completed.Rodrigues and Bowers developed a system dynamics model of the human resource management cycle to analyze the project control cycle[3]. This study analyzed the impact upon project duration of the following three parameters: the productivity, the number of staff working, and the work rate. However, a detailed schedule and traditional network analysis was also needed for project control.In 1998, Chapman studied how system dynamics could assist in the understanding of the impacts on design production and design duration of a change of key project personnel[4]. It was found that design development was dependent upon the quality and extent of integration of differentiated engineering skills. The resulting model of the design process showed a negative impact of changing staff due to: the orientation phase, the training overhead, the communication overhead, the hiring delay, and the leaving rate.Ogulana et al. developed a model for the detailed design process of a civil engineering project[5]. That model mainly consisted of three casual loops which included a goal seeking or negative feedback loop with two stocks which determines the work force level available, a negative feedback loop with three stocks that determines productivity and adjusts the workload, and a positive feedback loop with three stocks that controls how schedule date is maintained. However, this model was limited in validity for only a design staff of 10 or more personnel so was unable to be applied to other projects.Love et al. described how changes impact project performance using system dynamic methodology[6]. The two basic sources of dynamics that infringe upon a project system include planned activities with attended dynamics-factors resulting from active interventions, and uncertainties with unattended dynamics-factors beyond the control of project management. Findings from this case study indicated that 50 percent of the rework costs resulted from poor motivation levels of the architects and engineers.Park proposed a model-based dynamic approach for construction resource (labor and material) management[7]. The model simulation of the resource level targeting process indicated there is a time-cost tradeoff of resource coverage and project performance. Also, policy implications were discussed for the key variables listed as the target material level, the target workforce level, the material acquisition rate, and the workforce based construction rate.Closely following the above, Lee, Pena-Mora and Park introduced the system’s perspective of dynamic planning and control methodology to support the strategic and operational aspects of project management[8]. The integration of traditional CPM approach and system dynamics modeling by Vensim was developed into a project management tool whose characteristics included a strategic core of system dynamics, a tactical layer of agent-based modeling, an operational layer of network-based tools, optimization techniques, discrete-event simulation, and statistics, and an interface layer with Gantt chart, dependency structure matrix, smart cell, behavioral graph, 4D visualization.In 2010, Minami et al. used system dynamics methodology to model the engineering process and conducted simulations to examine the impact of project management decisions[9]. They concluded that increased constructability efforts and design sharing mitigated the impact of cost overruns and project completion delays. Also, the study concluded that it is best to focus improvement efforts early in the project when limited resources exist.Han et al. have recently developed a system dynamics model to capture the dynamics of design errors and systematically assess their negative impacts[10]. Rework due to design errors and design changes are considered to be the primary contributor to schedule delay and cost overruns in design-build projects. The research indicated that, despite the continuous schedule recovery efforts by project managers, the design errors can significantly delay the project schedule. Further, it is shown that schedule pressure can propagate negative impacts to various construction activities not associated with the design errors.In 2012, Lisse developed a system dynamics model of the outsourcing of construction services in large shipbuilding projects which are comparable to design-build projects[11]. Vensim software was utilized and the most productive use of total construction effort was shown to be 20%-90% outsourced for the project parameters used. This SD model was subsequently modified as indicated within this study.
3. Results
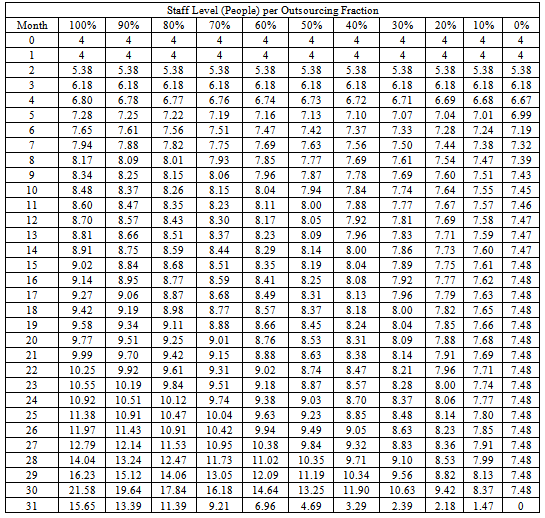
- This literature review indicates that the success of a construction project depends upon both the quantity and quality of the construction services. However, all of the reviewed papers indicated the additional resources provided were totally insourced or the authors were silent regarding any resources that were outsourced. Thus, one would have to assume that these reviewed studies involved insourced construction resources.A system dynamics model to account for the impacts of outsourcing a percentage of the required construction services to sustain a project over a time horizon of 30 months was developed using Vensim software. This SD model is a refinement of a previous model[11] which accounts for changed work impacts and is shown in Figure 1. The model variables are listed in the Attachment.The results of running the above Vensim model to determine the construction labor effort to complete the work based upon progress in a project with a fixed completion date with varying degrees of outsourcing is shown below in Figure 2. It is shown that the 100% Outsourcing case always presents the greatest effort (cost) to complete the construction work during any period during the project duration. It is also shown that, except in the In-house case, the outsourced construction work completion date extends beyond the project completion date. This is assumed to be caused by the initial input of only four experienced tradesmen assigned at commencement of the construction work and the quality, productivity, and associated learning curves of newly assigned tradesmen. Further study of the impact of these variables upon the project schedule will be performed as well as that of the initial construction workload value of 200 tasks that was used in this study.The construction work completed during the project duration is presented in below Figure 3. Again, it is evident that, depending upon the percentage of outsourcing, it may take up to 31 months to complete the initial construction tasking which had been required to finish in 30 months. Also, the case of 0% Outsourcing or total Insourcing would produce more construction work done during the project than any combination of outsourcing/insourcing. This implies that management should concentrate on providing in-house construction resources through the project completion.The construction staff level required to be brought into the project in order to accomplish the initial construction tasks on the project is shown in Table 1. This table indicates that only the In-house staffing case (0% Outsourcing) completes the required construction tasks at scheduled project completion (Month 30). It also shows that the 100% Outsourcing case exceeded the budget restrained maximum staff level of 20 in order to complete the remaining construction tasking after the scheduled completion date.The average productivity of the construction staff is indicated in Figure 4. and should be compared to a normal productivity value of 1. The graph indicates that, for all cases, the average productivity of tradesmen climbs after project commencement and then decreases as experienced tradesmen depart and new tradesmen, with normal learning curves, are brought into the project. Also, the productivity for 0% Outsourcing (In-house) construction approaches the ideal value of 1 faster than all of the outsourcing cases thus insourcing will be more productive for the overall construction effort.The average construction work quality increases during the project duration as is shown in Figure 5. As the project construction staff gains more experience, the amount of construction task rework diminishes. The graph indicates that the 0% Outsourcing produces the best overall average construction work quality and approaches the ideal value of 1 earlier than all outsourcing cases.
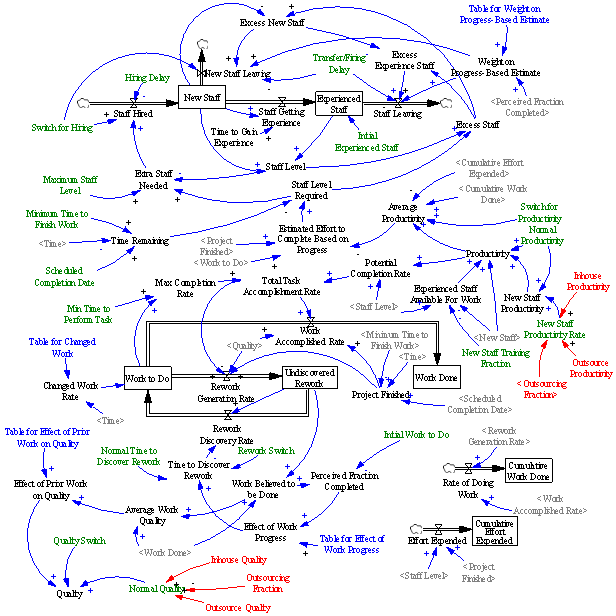 | Figure 1. SD model for outsourcing construction resources |
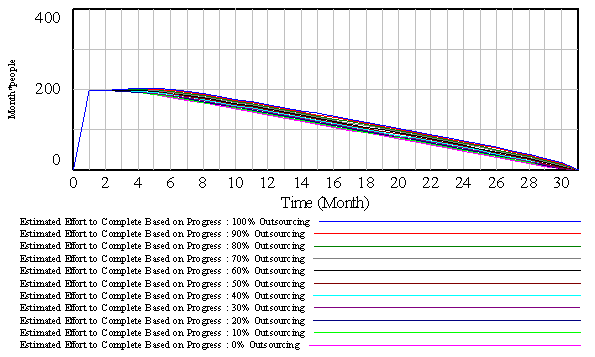 | Figure 2. Estimated effort to complete based on progress |
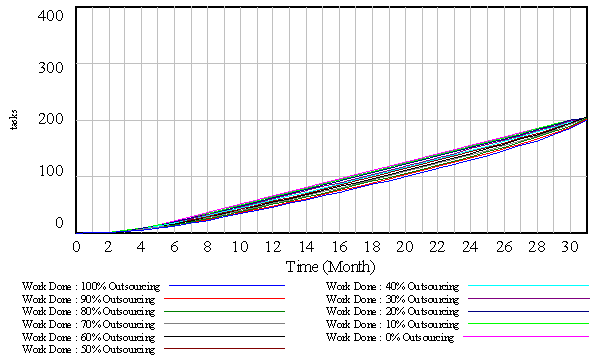 | Figure 3. Construction work done per percent of outsourcing |
|
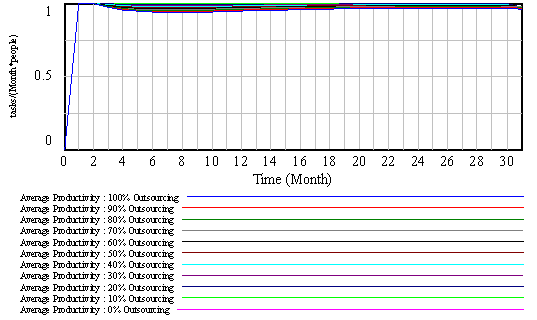 | Figure 4. Average productivity of construction staff |
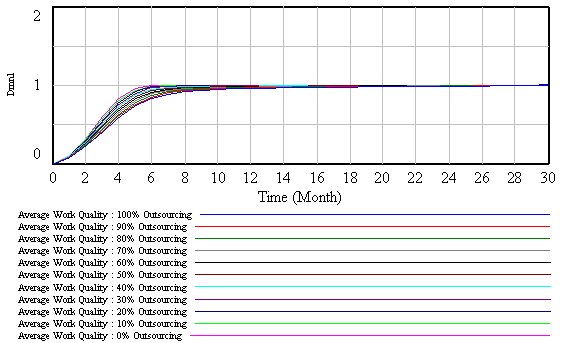 | Figure 5. Average construction work quality during project duration |
4. Conclusions
- There is a paucity of available literature on insourcing versus outsourcing construction services on major projects. From the results of this literature review and preliminary modeling, the decision to insource/outsource construction services on large and complex projects may have significant cost (and time) impacts which should be considered by decision makers.Comprehensive sensitivity analysis of various initial parameters, including: (1) initial number of experienced tradesmen assigned, (2) maximum number of tradesmen allowable, and (3) the initial number and duration of assigned construction tasks will be performed in a future study. Additionally, the model will be modified to incorporate design scope changes during the project duration and associated impacts to the project will be studied.
Attachment
- SD Model Variables(01)Average Productivity=Switch for Productivity * ZIDZ( Cumulative Work Done, Cumulative Effort Expended) + (1-Switch for Productivity) * ProductivityUnits: tasks/(people*Month)(02)Average Work Quality=ZIDZ( Work Done , Work Believed to be Done)Units: Dmnl(03)Cumulative Effort Expended= INTEG (Effort Expended,0)Units: people*Month(04)Cumulative Work Done= INTEG (Rate of Doing Work,0)Units: tasks(05)Effect of Prior Work on Quality=Table for Effect of Prior Work on Quality(Average Work Quality)Units: Dmnl(06)Effect of Work Progress=Table for Effect of Work Progress(Perceived Fraction Completed)Units: Dmnl(07)Effort Expended=IF THEN ELSE(Project Finished, 0, Staff Level)Units: people(08)Estimated Effort to Complete Based on Progress=IF THEN ELSE(Project Finished, 0, ZIDZ( Work to Do, Average Productivity))Units: people*Month(09)Excess Experience Staff=MAX(0, Excess Staff-Excess New Staff)Units: people(10)Excess New Staff=MAX(0, Excess Staff-New Staff )Units: people(11)Excess Staff=MAX(0, Staff Level-Staff Level Required )Units: people(12)Experienced Staff=INTEG (Staff Getting Experience-Staff Leaving,Initial Experienced Staff)Units: people(13)Experienced Staff Available For Work=Staff Level-New Staff-New Staff Training Fraction*New StaffUnits: people(14)Extra Staff Needed=MIN(Maximum Staff Level, MAX(0, Staff Level Required-Staff Level ))Units: people(15)FINAL TIME = 31Units: Month(16)Hiring Delay=2Units: Month(17)Hiring Delay Out=4Units: Month(18)Inhouse Productivity=1Units: Dmnl(19)Inhouse Quality=1Units: Dmnl(20)Initial Experienced Staff=4Units: people(21)Initial Experienced Staff Out=4Units: people(22)INITIAL TIME = 0Units: Month(23)Initial Work to Do=200Units: tasks(24)Max Completion Rate=Work to Do/Min Time to Perform TaskUnits: tasks/Month(25)Maximum Staff Level=20Units: people(26)Maximum Staff Level Out=20Units: people(27)Min Time to Perform Task=0.5Units: Month(28)Min Time to Perform Task Out=0.5Units: Month(29)Minimum Time to Finish Work=1Units: Month(30)Minimum Time to Finish Work Out=1Units: Month(31)New Staff= INTEG (Staff Hired-New Staff Leaving-Staff Getting Experience,0)Units: people(32)New Staff Leaving="Weight on Progress-Based Estimate"*Excess New Staff*"Transfer/Firing Delay"* Switch for HiringUnits: people/Month(33)New Staff Productivity=New Staff Productivity Rate*Normal ProductivityUnits: tasks/(Month*people)(34)New Staff Productivity Out=New Staff Productivity Rate Out*Normal Productivity OutUnits: tasks/(Month*people)(35)New Staff Productivity Rate=Inhouse Productivity*(1-Outsourcing Fraction)+ Outsource Productivity*Outsourcing FractionUnits: Dmnl(36)New Staff Productivity Rate Out=0.3Units: Dmnl(37)New Staff Training Fraction=0.5Units: Dmnl(38)New Staff Training Fraction Out=0.5Units: Dmnl(39)Normal Productivity=1Units: tasks/(Month*people)(40)Normal Productivity Out=1Units: tasks/(Month*people)(41)Normal Quality=Inhouse Quality*(1-Outsourcing Fraction)+Outsource Quality*Outsourcing FractionUnits: Dmnl(42)Normal Quality Out=0.75Units: Dmnl(43)Normal Time to Discover Rework=1Units: Month(44)Normal Time to Discover Rework Out=4Units: Month(45)Outsource Productivity=0.75Units: Dmnl(46)Outsource Quality=0.75Units: **undefined**(47)Outsourcing Fraction=1Units: Dmnl(48)Perceived Fraction Completed=ZIDZ(Work Believed to be Done, Initial Work to Do)Units: Dmnl(49)Potential Completion Rate=Staff Level*ProductivityUnits: tasks/Month(50)Productivity=(New Staff*New Staff Productivity+ Experienced Staff Available For Work*Normal Productivity)/(New Staff+Experienced Staff Available For Work)Units: tasks/people/Month(51)Project Finished=IF THEN ELSE(Scheduled Completion Date+Minimum Time to Finish Work-Time<=0, 1, 0 )Units: Dmnl(52)Project Finished Out=IF THEN ELSE(Scheduled Completion Date Out+Minimum Time to Finish Work Out-Time<=0, 1, 0 )Units: Dmnl(53)Quality=Quality Switch * Normal Quality * Effect of Prior Work on Quality + (1 - Quality Switch) * Normal QualityUnits: Dmnl(54)Quality Switch=1Units: Dmnl[0,1](55)Quality Switch Out=1Units: Dmnl[0,1](56)Rate of Doing Work=Rework Generation+Work AccomplishedUnits: tasks/Month(57)Rework Discovery=Undiscovered Rework/Time to Discover ReworkUnits: tasks/Month(58)Rework Generation=IF THEN ELSE(Project Finished, 0 , Total Task Accomplishment*(1-Quality))Units: tasks/Month(59)Rework Switch=1Units: Dmnl[0,1](60)Rework Switch Out=1Units: Dmnl[0,1](61)SAVEPER = TIME STEPUnits: Month[0,31](62)Scheduled Completion Date=30Units: Month(63)Scheduled Completion Date Out=30Units: Month(64)Staff Getting Experience=MAX(0, New Staff/Time to Gain Experience )Units: people/Month(65)Staff Hired=MAX(0, (Extra Staff Needed/Hiring Delay)*Switch for Hiring)Units: people/Month(66)Staff Leaving=Excess Experience Staff*"Weight on Progress-Based Estimate"*"Transfer/Firing Delay"Units: people/Month(67)Staff Level=MAX(0, Experienced Staff+New Staff)Units: people(68)Staff Level Required=Estimated Effort to Complete Based on Progress/Time RemainingUnits: people(69)Switch for Hiring=1Units: Dmnl[0,1](70)Switch for Hiring Out=1Units: Dmnl[0,1](71)Switch for Productivity=1Units: Dmnl[0,1](72)Switch for Productivity Out=1Units: Dmnl[0,1](73)Table for Effect of Prior Work on Quality([(0,0.1)-(1,1)],(0,0.1),(0.1,0.25),(0.2,0.35),(0.3,0.45),(0.4,0.55),(0.5,0.65),(0.6,0.725),(0.7,0.8),(0.8,0.875), (0.9,0.975),(1,1))Units: Dmnl(74)Table for Effect of Prior Work on Quality Out([(0,0.1)-(1,1)],(0,0.1),(0.1,0.25),(0.2,0.35),(0.3,0.45), (0.4,0.55),(0.5,0.65),(0.6,0.725),(0.7,0.8),(0.8,0.875), (0.9,0.95),(1,1))Units: Dmnl(75)Table for Effect of Work Progress([(0,0.1) -(1,1)],(0,1),(0.1,1),(0.2,1),(0.3,1),(0.4,1),(0.5,1),(0.6,0.95), (0.7,0.8),(0.8,0.45),(0.9,0.2),(1,0.1))Units: Dmnl(76)Table for Effect of Work Progress Out([(0,0.1)-(1,1)],(0,1),(0.1,1),(0.2,1),(0.3,1),(0.4,1),(0.5,1),(0.6,0.95),(0.7,0.8),(0.8,0.45),(0.9,0.2),(1,0.1))Units: Dmnl(77)"Table for Weight on Progress-Based Estimate Out"([(0,0)-(1,1)],(0,0),(0.1,0),(0.2,0),(0.3,0.1),(0.4,0.25), (0.5,0.5),(0.6,0.75),(0.7,0.9),(0.8,1),(0.9,1),(1,1))Units: Dmnl(78)"Table for Weight on Progress-Based Estimate"([(0,0)-(1,1)],(0,0),(0.1,0),(0.2,0),(0.3,0.1),(0.4, 0.25),(0.5,0.5),(0.6,0.75),(0.7,0.9),(0.8,1),(0.9,1),(1,1))Units: Dmnl(79)Time Remaining=MAX(Minimum Time to Finish Work, Scheduled Completion Date-Time)Units: Month(80)Time Remaining Out=MAX(Minimum Time to Finish Work Out, Scheduled Completion Date Out-Time)Units: Month(81)TIME STEP = 1Units: Month[0,31](82)Time to Discover Rework=Rework Switch * Normal Time to Discover Rework*Effect of Work Progress +(1 - Rework Switch) * Normal Time to Discover ReworkUnits: Month(83)Time to Gain Experience=4Units: Month(84)Time to Gain Experience Out=16Units: Month(85)Total Task Accomplishment=MIN(Max Completion Rate, Potential Completion Rate )Units: tasks/Month(86)"Transfer/Firing Delay Out"=1Units: 1/Month(87)"Transfer/Firing Delay"=1Units: 1/Month(88)Undiscovered Rework= INTEG (Rework Generation-Rework Discovery,0)Units: tasks(89)"Weight on Progress-Based Estimate"="Table for Weight on Progress-Based Estimate"(Perceived Fraction Completed)Units: Dmnl(90)Work Accomplished=IF THEN ELSE(Project Finished, 0, Total Task Accomplishment*Quality)Units: tasks/Month(91)Work Believed to be Done=Undiscovered Rework+Work DoneUnits: tasks(92)Work Done= INTEG (Work Accomplished,0)Units: tasks(93)Work to Do= INTEG (Rework Discovery-Rework Generation-WorkAccomplished, Initial Work to Do)Units: tasks