Atika A. Salih , Auns Q. H. Al-Neami
Biomedical engineering Department, College of Engineering, Al-Nahrain University, Baghdad, Iraq
Correspondence to: Atika A. Salih , Biomedical engineering Department, College of Engineering, Al-Nahrain University, Baghdad, Iraq.
| Email: |  |
Copyright © 2015 Scientific & Academic Publishing. All Rights Reserved.
Abstract
The present study aims to design and implementation a medical system for measuring glottis activity (electroglottography). Electroglottography (EGG), is a noninvasive way that measure the change in electrical resistance across the larynx, which is related to the vocal fold vibration. The measurement was implemented by using a pair of electrodes placed on the neck at the level of thyroid cartilage, where a low level current (1.6mA) of high frequency (300 KHz) was applied. The sensed signal was AM modulated, recalling of AM detector which is based on a full wave rectification and the serve of 8th order low pass filter. The signal was filtered by a high pass filter to remove the noise. The fundamental frequency of the resulted signal was in a range between 50 to 600 Hz. The system output was examined on ten persons (5 males, 5 females with different ages) which provided a very good signals for diagnosis of vocal fold disorders.
Keywords:
Electroglottography, AM modulation, AM detector, Butterworth filter
Cite this paper: Atika A. Salih , Auns Q. H. Al-Neami , Design and Implementation of Medical System for Measuring Glottal Activity (Electroglottography), International Journal of Biological Engineering, Vol. 5 No. 1, 2015, pp. 1-10. doi: 10.5923/j.ijbe.20150501.01.
1. Introduction
In recent decades, the technological advances have progressively been employed in the health area. In Speech Therapy, specifically in the area of voice, it is not different. The importance of voice lies in the fact that its characteristic features i.e. color, melody, intonation, purity and intensity express our personality. The quality of voice plays a vital role in our lives, it is a source of information about ourselves, has a cognitive function, sometimes determines our careers in some professions (actors, singers, speakers etc.) [1]. The voice, like fingerprints, provides the speaker with vocal individuality and uniqueness [2]. The vibration of vocal folds, which is a fast, fine, and complex process, is an essential part of voice production research and clinical laryngeal examination [3]. Normally the frequency of vibration is in the range between 60Hz and 400Hz, differing length and mass of vocal folds lead to different fundamental frequencies of vibration [4]. According to the American Speech-Language Hearing Association (ASHA) publication voice assessment should incorporate the use of perceptual instrumental measures including: perceptual ratings, acoustic analysis, aerodynamic measures, electroglottography, and imaging techniques (including endoscopy and stroboscope) [2].Electroglottography (EGG) is an indirect method for registering laryngeal behavior. The innovation of EGG was published in 1957 by Fabre and since then, several comparative studies have been performed using stroboscopic photography, videostroboscopy, high-speed cinematography, and photoglottography, measurements of subglottic pressure and inverse filtering, which all confirm that the EGG signal is related to the vocal fold contact area. This fact has made EGG a popular, noninvasive tool for clinical and research purposes [5], [6].
2. Theory
Electroglottography (EGG) is a medical exploration modality, utilizes a pair of electrodes placed on each side of the thyroid cartilage [7]. A high frequency around 300kHz to 5MHz electrical constant current of small amplitude of voltage and amperage which physiologically safe and harmless passes between the two electrodes which will situate on the surface of the throat at the thyroid cartilage. Between the electrodes, the system will monitor the vocal fold opening and closure by measuring the variation in the conductance. The opening and closing of the vocal fold will vary the conductivity of the path between the electrodes causes amplitude modulated version of the stimulation signal (High frequency source) [8]. According to Childers and Krishnamurthy the reason for the current modulation effect is a longer tissue passage for the radio frequency current when the glottis is open, since the total impedance of the tissue is a function of the length of the tissue passage [4]. See Fig. (1). 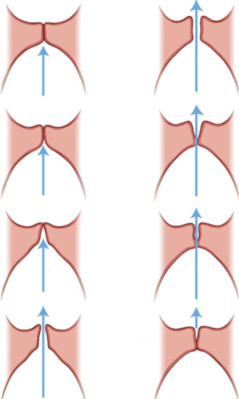 | Figure 1. Opening and closing of vocal folds |
3. Material and Methods
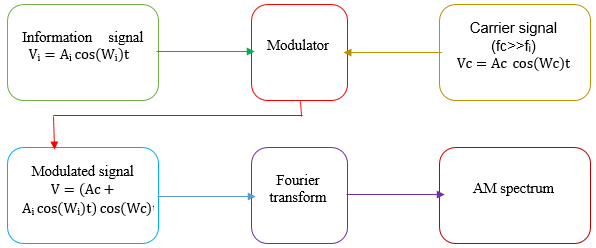
In the present research the implementation of the frequency passes between the electrodes (surface electrodes) was 300 KHz, and the current was 1.6mA. The Circuit diagram of the system is shown in Fig. (2). The practical design includes three main modules, classified according to electrical and communication standards and specifications as follows:- 1- Current excitation part: this circuit consists of designing a DC power supply utilizes a center tapped transformer and full wave rectifier resulting ±5v, which is operate ICs of the system, see Fig. (3). Wien bridge oscillator was used to provide (300 KHz, 1v), as demonstrated in Fig. (4). Voltage to current convertor was implemented by using a Buffer filter and a resistor of (600Ω), this produced a current of (1.6mA). 2- AM modulation part was explained in fig. (5), the circuit includes a high frequency transformer connected between inverting amplifier and the electrodes which are connected to the neck of the subject. The experimentally circuit of the system is shown in fig. (6). Current excitation illustrated in equation bellow. | (1) |
Where Vr is the sensed voltage. a is the turns ratio. If is a feedback current. (R+r) is the impedance variation. Equation bellow illustrate AM modulation. | (2) |
3- AM detector part is composed of a full wave rectifier, low pass filter and high pass filter.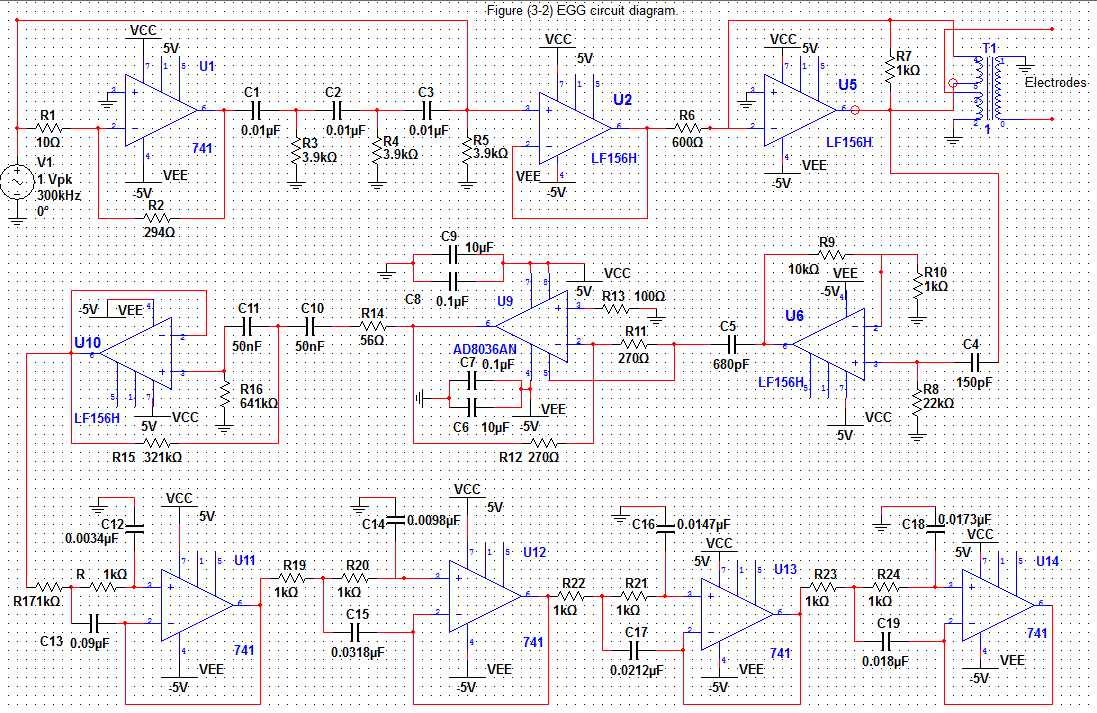 | Figure 2. EGG circuit diagram |
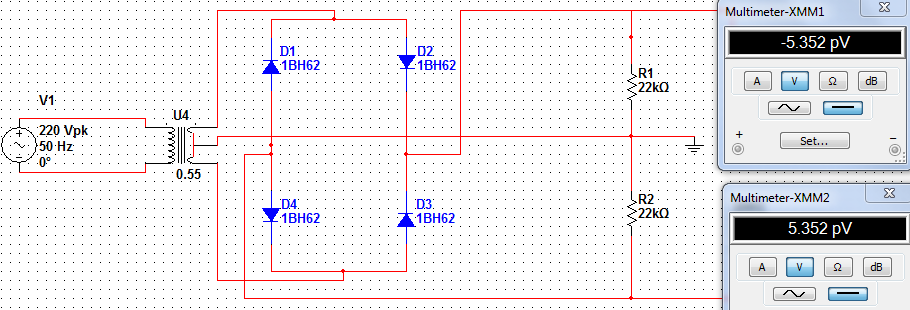 | Figure 3. DC power supply |
 | Figure 4. Wien bridge oscillator |
 | Figure 5. A schematic diagram of AM modulation |
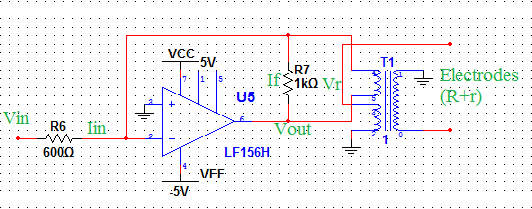 | Figure 6. Impedance matching circuit |
4. Results
Results of the modulated signal, spectrum analysis and demodulated signal were obtained and extracted as shown in Fig. (7).The output of a full wave rectifier where the negative part of Vout is suppressed was obeyed to eq. (3).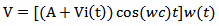 | (3) |
When Vr was applied to a low-pass filter of cutoff frequency 9 KHz, the output was: 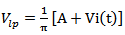 | (4) |
WhereVlp is the output voltage of a low pass filter. The type of the present low pass filter is the Butterworth, is a kind of signal processing filter designed to have as a flat frequency response as possible in the passband. It is also referred to as a maximally flat magnitude filter. The EGG wave form typically extends over (7 Hz to 9 kHz). So another type of filters high pass filter was used. The following diagram in Fig. (8) Outlines the design of the Butterworth filter. For second order normalized high pass filter the transfer function 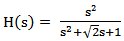 | (5) |
The present design transformed to achieve the desired frequency, the Q factor was remained the same in normalized design (Q = 0.7). After scaling the normalized transfer function, it was became as:-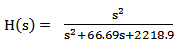 | (6) |
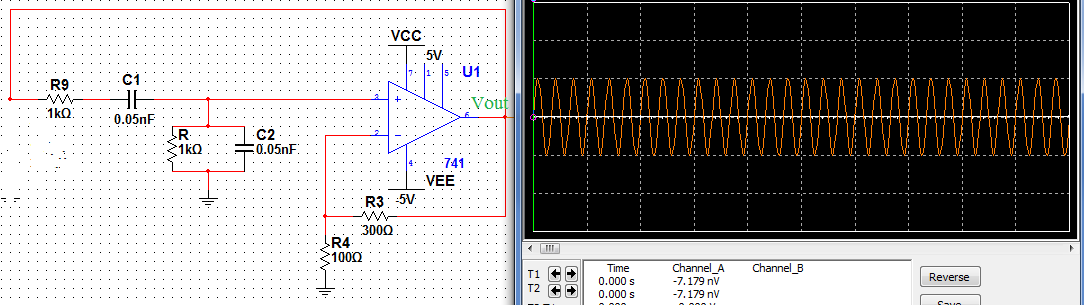
The electrical circuit of a high pass filter was illustrated in Fig. (9). The frequency response was extracted as indicated in Fig. (10).The complexity or filter type is defined by the filters “order”, and which is dependent upon the number of reactive components such as capacitors or inductors within its design. High-order filters, such as third, fourth, and fifth-order are usually formed by cascading together single first-order and second-order filters. So in Fig. (11) there is a cascade of four second order low pass filters to achieve the 8th order low pass filter with cutoff frequency of 9 KHz. The frequency response was estimated in Fig. (12).The normalized polynomial: | (7) |
With desired Wc: | (8) |
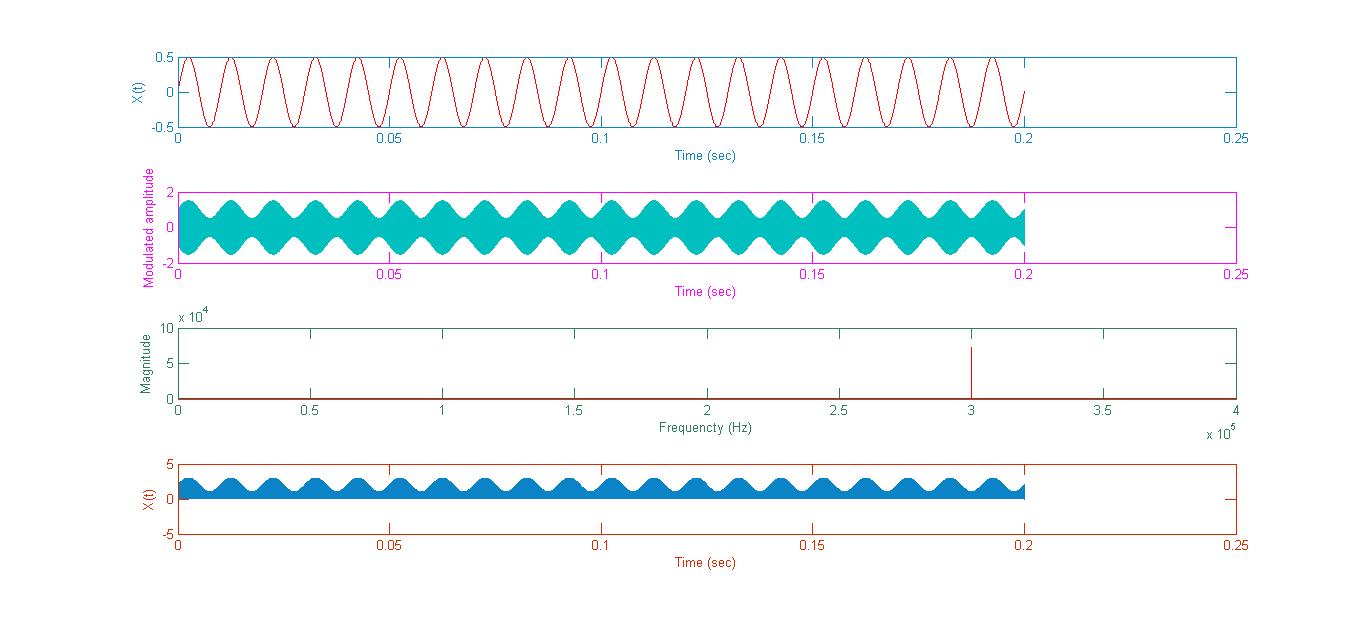 | Figure 7. AM modulation, spectrum analysis and AM demodulation of (0.5v, 200Hz) signal by (1v, 300KHz) carrier |
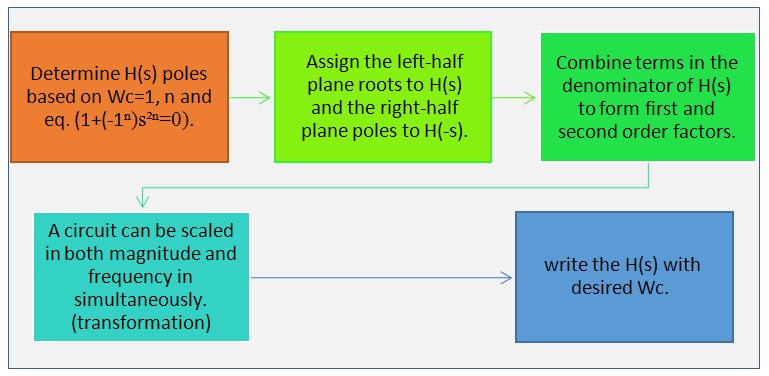 | Figure 8. A schematic diagram of Butterworth filter design |
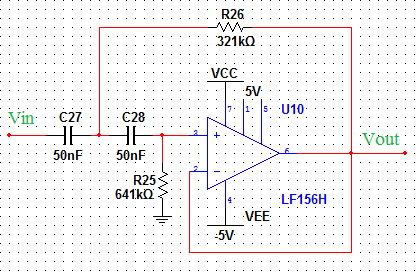 | Figure 9. 2nd order Butterworth high pass filter |
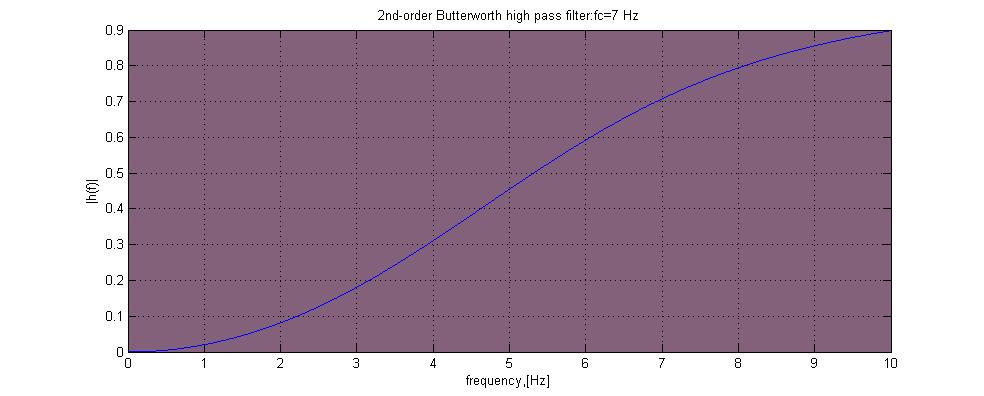 | Figure 10. Frequency responce of 2nd order Butterworth high pass filter |
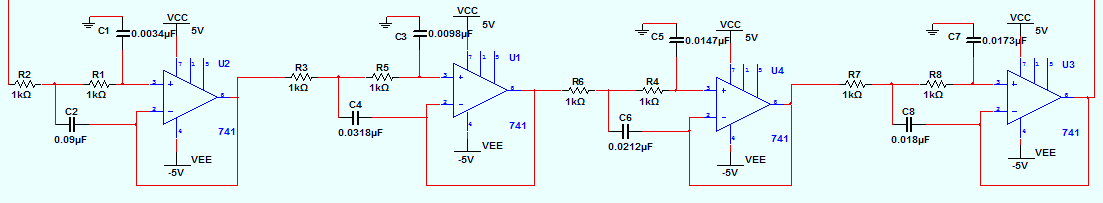 | Figure 11. 8th order Butterworth low pass filter |
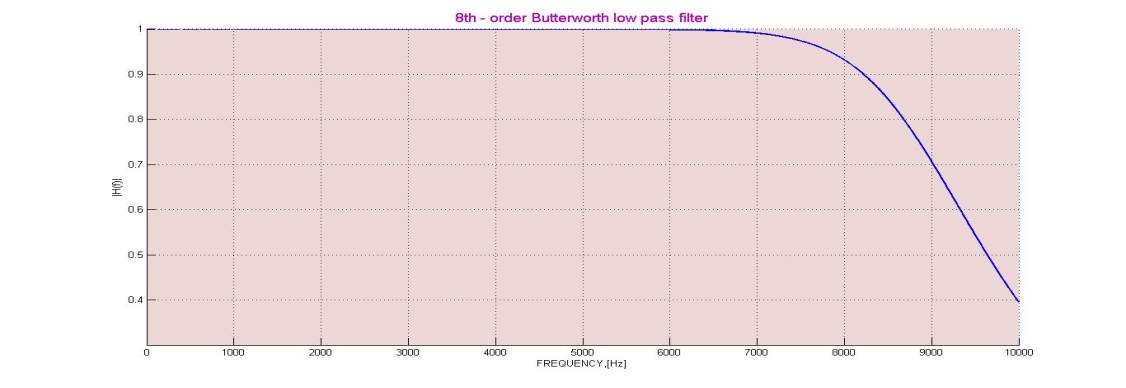 | Figure 12. Frequency responce of 8th order Butterworth low pass filter |
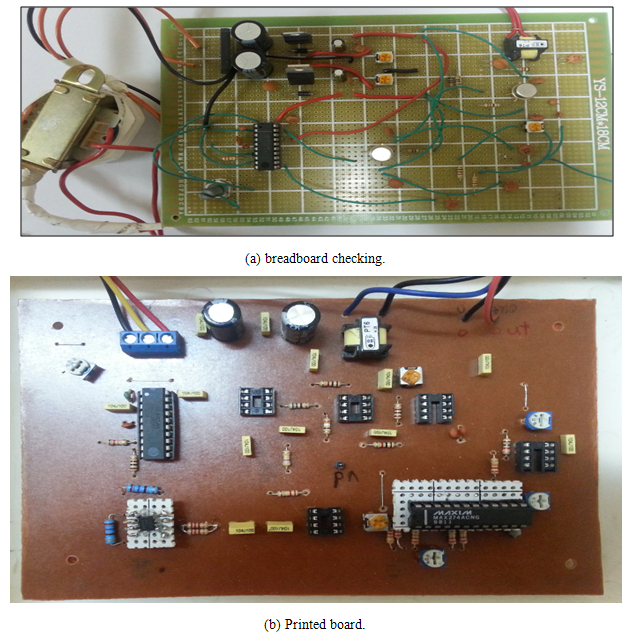 | Figure 13. Sequence of system design |
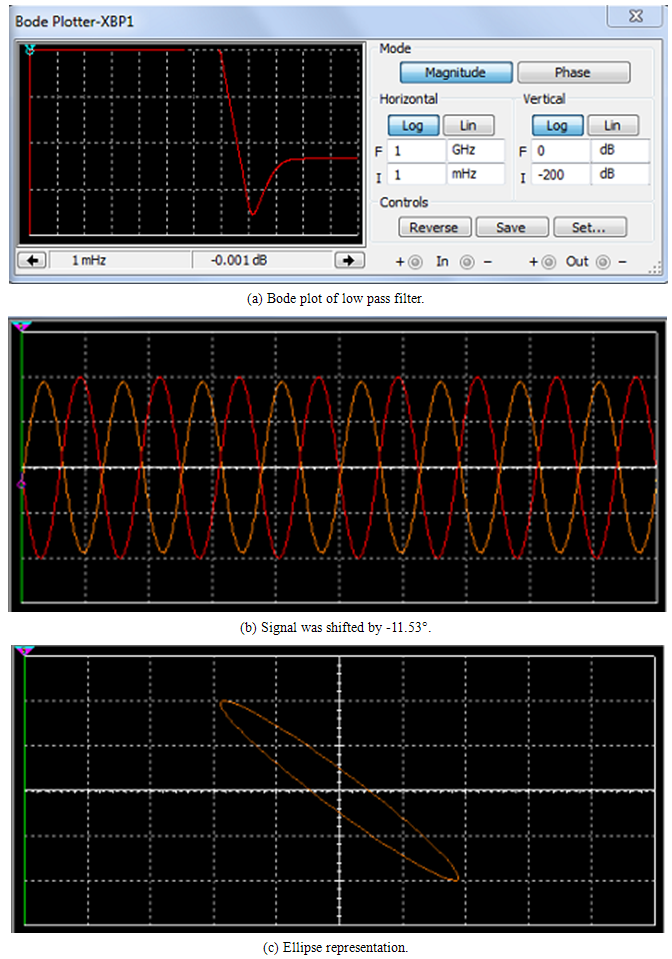
Sequence of system design includes checking the implementation on breadboard and then the system was implemented on a printed board. See Fig. (13).The result of high pass filter obtained by applying 20 Hz sinusoidal signal, the output was shifted by  , Bode plot was shown in fig. (14). Butterworth low pass filter was provided phase shift by
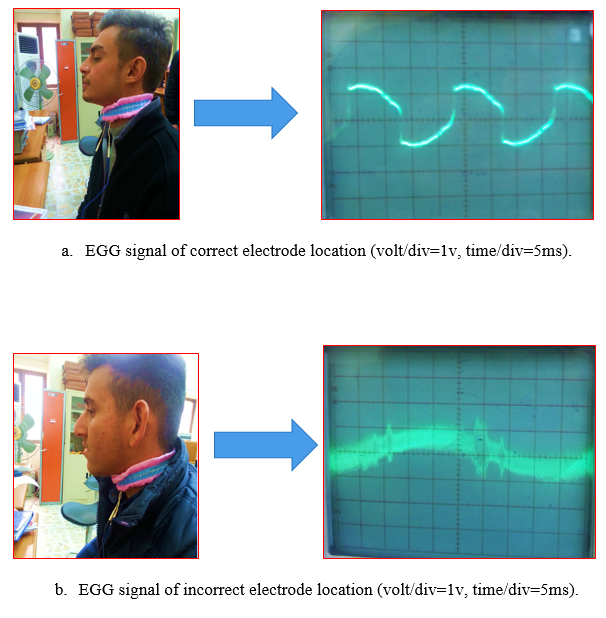
  . Bode plot, ellipse and Y, X signals shown in fig. (15). The EGG signals were obtained, as illustrated in Fig. (16).
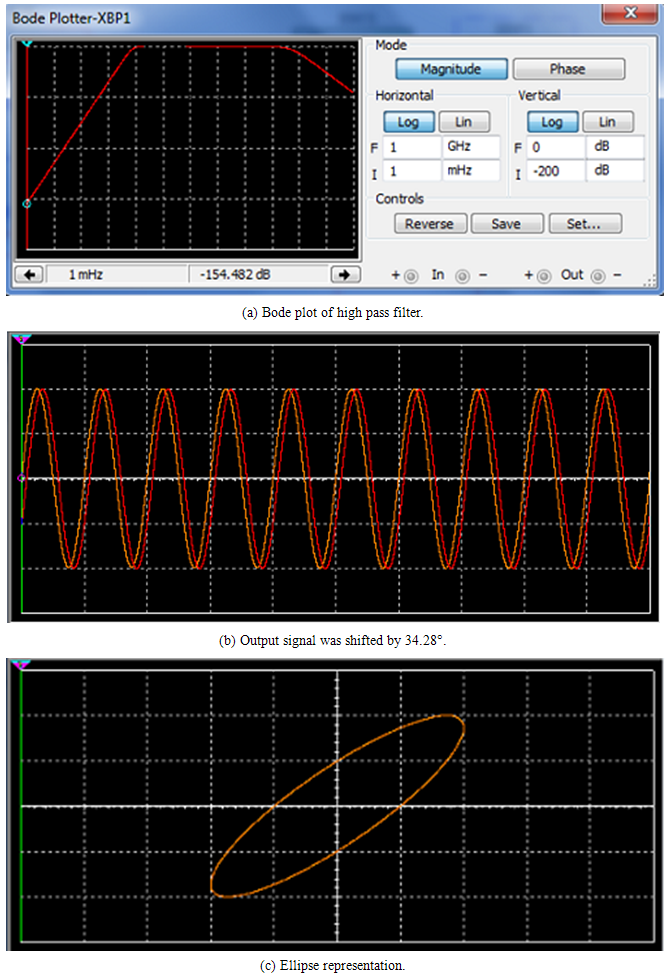 | Figure 14. High pass filter results |
 | Figure 15. Low pass filter results |
 | Figure 16. EGG signal |
5. Discussion
Noise rejection and carrier rejection was effected the efficiency of demodulation type, the present method was good in both. The electroglottogram was showed the impedance variations of vocal fold as a function of time. The fact that these variations are comparatively small, between 1-2 percent of the total measured impedance and that the throat impedance varies considerably with normal larynx movements and skin contact (for example at the case of skin moistness), high-pass filtering is performed on the obtained EGG signal in order to eliminate low-frequency noise. System results different according to age, sex and electrodes location. The present system was became very small, portable and more affordable. Also this system was used in clinics for many possible applications.
6. Conclusions
During the implementation stages aplenty of practical conclusions have been realized, and some of these important conclusions are listed here under: ● The type of electrodes (self-adhesive) was used providing very good results compared with other used stainless steel or gold electrodes. ● The amplitude of the measured voltage signal changed with the changing of the glottis impedance. When the glottis is closed minimum impedance (high amplitude) representing tissue resistance was results. When the glottis is open the impedance is high (small amplitude) related to the air impedance.● There are significant differences between the electroglottogram of young and old speakers, the frequency is increased with age.
References
| [1] | Andrzej S., Jacek S., Jolanta Z.," Electroglottographic Assessment of the Results of Medical Treatment of Patients with Vocal Cords Polyps", Journal of medical informatics and technologies vol. (11), p.p. (285-292), 2007. |
| [2] | Lauren M.," An Evaluation of the Effect of Two Treatment Protocols for College Students with Voice Disorders", Master of Science thesis, p.p. (1-19), Oxford, Ohio, 2006. |
| [3] | Xulei Qin, Supin Wang, and Mingxi Wan," Improving Reliability and Accuracy of Vibration Parameters of Vocal Folds Based on High-Speed Video and Electroglottography", IEEE Transactions on Biomedical Engineering, vol. (56), no. (6), p.p. (1744-1754), June 2009. |
| [4] | Rubita S., "Speech Current Features and Extraction Methods", NORLAILI MAT SAFRI, p.p. (129-159), first edition, 2008. |
| [5] | Laura E., "Collision Threshold Pressure: A novel Measure of Voice Function Effects of Vocal Warm-up, Vocal Loading and Resonance Tube Phonation in Water", Linköping University Medical dissertations, Sweden 2013. |
| [6] | Anil L., "Impedance Glottography", IIT Bombay, p.p. (1-16), July 2004. |
| [7] | Romain E., "Variability of Electroglottographic Glottal Closed Quotients", arch otolaryngology head neck surge Journal, vol. (130), p.p. (349-352), March, 2004. |
| [8] | Priyanko Mitra," Glottography for the Diagnosis of Vocal Disorders", IIT Bombay, November, 2004. |
 Abstract
 Reference
 Full-Text PDF
 Full-text HTML