-
Paper Information
- Paper Submission
-
Journal Information
- About This Journal
- Editorial Board
- Current Issue
- Archive
- Author Guidelines
- Contact Us
International Journal of Biological Engineering
p-ISSN: 2163-1875 e-ISSN: 2163-1883
2014; 4(1): 1-3
doi:10.5923/j.ijbe.20140401.01
Structural Assessment of Elastase Strain K in Homogeneous Non-Aqueous System
 Abstract
 Reference
 Full-Text PDF
 Full-text HTML
Chee Fah Wong 1, Raja Noor Zaliha Raja Abd. Rahman 2, Mahiran Basri 3, Abu Bakar Salleh 2
1Department of Biology, Faculty of Science and Mathematics, Universiti Pendidikan Sultan Idris, Tanjung Malim, Malaysia
2Enzyme and Microbial Technology Center, Faculty of Biotechnology and Biomolecular Sciences, Universiti Putra Malaysia, UPM Serdang, Malaysia
3Department of Chemistry, Faculty of Science, Universiti Putra Malaysia, UPM Serdang, Malaysia
Correspondence to: Raja Noor Zaliha Raja Abd. Rahman , Enzyme and Microbial Technology Center, Faculty of Biotechnology and Biomolecular Sciences, Universiti Putra Malaysia, UPM Serdang, Malaysia.
| Email: |  |
Copyright © 2014 Scientific & Academic Publishing. All Rights Reserved.
Homogeneous non-aqueous enzymology emerges as an attractive alternative to other non-aqueous systems in order to overcome some inherent drawbacks associated with heterogeneous non-aqueous biocatalysis. However, homogeneous organic systems require enzymes that are both soluble and stable in hydrophilic organic solvents. In relation to this, the role of hydrophilic organic solvents as the main contributor to the stability of elastase strain K is well studied in this communication. Circular Dichroism (CD) spectropolarimetry method by means of far UV had been assigned to examine the effect of methanol concentrations on the secondary structure of elastase strain K, based on the content changes of different secondary structure elements in proteins. The far UV spectra of the enzyme in 10-60% (v/v) of methanol have depicted spectral trends similar to that of the control [0% (v/v)]. Further investigation into the behavior of elastase strain K in methanol using several tools in DICHROWEB has unveiled stabilized form of secondary structures throughout the transitions from low to extremely high concentrations of methanol.
Keywords: Organic solvent tolerant, Secondary structures, Elastase strain K
Cite this paper: Chee Fah Wong, Raja Noor Zaliha Raja Abd. Rahman, Mahiran Basri, Abu Bakar Salleh, Structural Assessment of Elastase Strain K in Homogeneous Non-Aqueous System, International Journal of Biological Engineering, Vol. 4 No. 1, 2014, pp. 1-3. doi: 10.5923/j.ijbe.20140401.01.
Article Outline
1. Introduction
- Circular dichroism (CD) is being increasingly recognised as a valuable technique for examining the structure of proteins in solution [1]. CD signals only arise where absorption of radiation occurs, and thus spectral bands are easily assigned to distinct structural features of a molecule. An advantage of the CD technique in studies of proteins is that complementary structural information can be obtained from a number of spectral regions. For that reason, this CD spectropolarimetry method by means of far UV had been assigned to examine the effect of methanol concentrations on the secondary structure of elastase strain K, based on the content changes of different secondary structure elements in proteins [2].
2. Methodology
2.1. Biophysical Characterization of Elastase Strain K
- Elastase strain K was purified to homogeneity according to methods described in [3]. Data of biophysical properties possessed by the protein were obtained from JASCO J-810 Circular Dichroism Spectropolarimeter (CD) (Tokyo, Japan). The generated CD spectra were used for analysis in secondary structure changes as well as thermal denaturation.
2.2. Effect of Methanol on Protein Secondary Structure
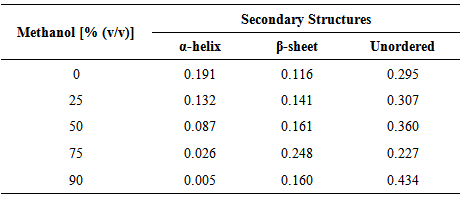
- The purified elastase stain K was treated with different percentage of methanol ranging from 0-90% (v/v) at 37°C for 30 min. Far-UV CD spectra were recorded at a region of 190-240 nm wavelength with 1.0 mm path length cuvette containing the native enzyme (0% methanol) and methanol treated-enzyme solutions. Final spectral reading for each sample, calculated from an average of 5 scans, was baseline corrected with their respective blank. Blank solutions were prepared by substituting the enzyme with buffer and different concentrations of methanol. The far-UV spectra were analysed by an open source software, SELCON3, by DICHROWEB (http://dichroweb.cryst.bbk.ac.uk/html/home.shtml) [4, 5] to ascertain the changes of secondary structures.
2.3. Thermal Denaturation Analysis
- The measurement of thermal denaturation (Tm) was acquired from ellipticity at 222 nm of a completely closed 10.0 mm cell containing 1.0 mg/mL native enzyme solutions, which was heated from 20-90°C at 1°C/min heating rate. Data pitch, bandwidth, response and scanning speed were programmed as 0.1 degree, 1 nm, 8 seconds and 1 degree per minute, respectively. Tm is determined at midpoint of sigmoidal melting curves.
3. Results and Discussion
3.1. Effect of Methanol Concentrations on Protein Structure
- Far UV spectra of elastase strain K in 0, 25, 50, 75 and 90% (v/v) of methanol are depicted on Figure 1. The spectrum of the enzyme in non-methanol containing-control (0% v/v) had exhibited a greatest absorption value (conferred by its high negative band) in the range from 200-240 nm. Despite exhibiting similar negative bands at the same region, the absorption values (mdeg) for elastase strain K affected by 25 and 50% (v/v) of methanol were slightly weaker than their control, but yet still be able to maintain their spectral trends similar to that of the control (Figure 1). Following pre-treatment by 75 and 90% (v/v) of methanol, the spectra showed by the enzyme, however, was found near the baseline and deviated much far away from the ones displayed by previous concentrations.
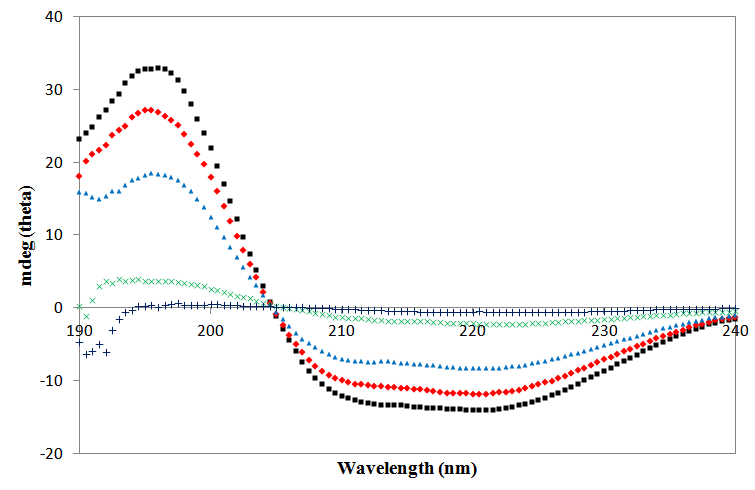 | Figure 1. Far UV spectra of elastase strain K in various concentrations of methanol. Enzyme was pre-treated with 0 ( ), 25 ( ), 25 ( ), 50 ( ), 50 ( ), 75 ( ), 75 ( ) and 90 % (+) (v/v) of methanol for 30 min at 37 °C prior to protease assay ) and 90 % (+) (v/v) of methanol for 30 min at 37 °C prior to protease assay |
|
3.2. Determination of Thermal Denaturation Point
- Further confirmation on thermal denaturation point of elastase strain K was carried out using circular dichroism (CD). Spectra generated based on reading at CD signal of 222 nm, a wavelength that estimates the α-helical content of proteins [6], was used to identify the transition state of the α-helix structure along with increase of temperature. The thermal denaturation point is defined as the midpoint of sigmoidal curve during the transition, in which denaturation occurs. From Figure 2, plateau region, which conferred to the stability of α-helix in these temperatures, was observed as the initial temperature of 20°C was heated to 60°C. A curve that indicates the transition state of the α-helical structure was formed when the temperature rose from 60-80°C. The appearance of 70°C at approximate midpoint of the sigmoidal curve had further defined the temperature as thermal denaturation point of elastase strain K. Any point after 80°C represents total changes of α-helical conformation. A clear correlation was recognized between the CD data and the optimum temperature study since loss of enzymatic activity was also observed after 70°C [3].
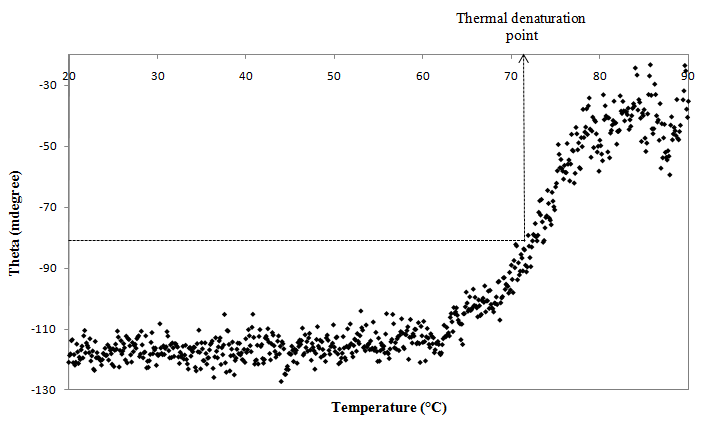 | Figure 2. CD spectra for determination of thermal denaturation point of elastase strain K |
4. Conclusions
- It is clearly demonstrated that the α-helical and β-sheet structures of elastase strain K have played crucial roles in its stability in homogeneous non-aqueous system, in line with enhancement of the elastinolytic activity in similar system, as reported by [3].