-
Paper Information
- Previous Paper
- Paper Submission
-
Journal Information
- About This Journal
- Editorial Board
- Current Issue
- Archive
- Author Guidelines
- Contact Us
International Journal of Biological Engineering
p-ISSN: 2163-1875 e-ISSN: 2163-1883
2012; 2(5): 56-61
doi: 10.5923/j.ijbe.20120205.04
Centromere and Length Detection in Artificially Straightened Highly Curved Human Chromosomes
 Abstract
 Reference
 Full-Text PDF
 Full-Text HTML
Sahar Jahani 1, Seyed Kamaledin Setarehdan 2
1Faculty of Biomedical Engineering, Science and Research Branch, Islamic Azad University, Tehran, Iran
2Control and Intelligent Processing Center of Excellence, School of Electrical and Computer Engineering, College of Engineering, University of Tehran, Tehran
Correspondence to: Seyed Kamaledin Setarehdan , Control and Intelligent Processing Center of Excellence, School of Electrical and Computer Engineering, College of Engineering, University of Tehran, Tehran.
| Email: |  |
Copyright © 2012 Scientific & Academic Publishing. All Rights Reserved.
Analyzing the morphological characteristics of the human chromosomes is a general task for diagnosing many genetic disorders. For this purpose, it is necessary to identify each of the 23 pairs of the chromosomes within the microscopic images and to place them in a table like format known as a Karyotype. This is usually carried out manually by a skilled operator considering the features of each chromosome the most important of which are the location of the Centromere and the length of the chromosome. Automation of this procedure is a difficult image processing task due to the non-rigid nature of the chromosomes making them to have unpredictable shapes and curvatures within the image. Various automatic algorithms were developed in the past but success of most of these algorithms is limited to only straight or slightly curved chromosomes. In this paper, using our previously reported method[17] we present a novel combined algorithm for Centromer and length detection in any given (straight, curved or highly curved) chromosome. The proposed Centromere locating algorithm uses the fact that the Centromere is by definition the narrowest part of the chromosome. By generating a linearly varying Gray Level Mask (GLM) individually for any given chromosome and multiplying it to the binary version of the chromosome's image, the global minimum in the histogram of the resulted image indicates the location of the Centromere. For evaluating the performance of the proposed algorithm a data set of 54 highly curved human chromosomes provided by the Cytogenetic Laboratory of the Cancer Institute, Imam Hospital, Tehran, Iran was used. Comparing the results of the proposed Centromere and length detection algorithm to those manually identified by a skilled operator, an average absolute error of 4.2 and 5.8 pixels were obtained respectively which is acceptable according to the expert.
Keywords: Centromere, Chromosome, Karyotyping, Chromosome Classification, Genetic Disorders
Article Outline
1. Introduction
- Analysing the shape and morphological characteristics of the human chromosomes is a common task for diagnosing many genetic disorders and various abnormalities. There are many different kinds of chromosome abnormalities such as having improper number of chromosomes, translocation, deletion, and some disorders like leukemia[1]. In addition, there are many other disorders like ring chromosomes, inversions, broken chromosomes, and also combinations and variations of the above mentioned abnormalities[2]. For diagnosing these abnormalities, the light microscopic images of the chromosomes are taken at the metaphase stage of the cell division. This is because; at this stage the chromosomes can be easily observed by a light microscope. Then, the images are visually examined by an expert cytogenetist for manual classification of the chromosomes. Manual classification of the chromosomes is a time-consuming and tedious task, the outcome of which is a particular table known as Karyotype[3]. Figure 1 shows an example image of the G banded chromosomes as seen under a light microscope together with its Karyotype. Computer based automatic Karyotyping is a challenging image processing task[4]. Various algorithms for automatic Karyotyping of human chromosomes are proposed in the past. Most of these methods, however, suffer the natural complexity in the images which is due to the non rigid nature of the chromosomes which makes them to have unpredictable shapes and sizes in the images. Various features of the chromosomes were proposed and used for chromosome classification by the researchers. The most commonly used features by automatic chromosome classification algorithms fall into 2 main categories of the geometrical features and the band pattern based features[5]. The Length of a chromosome and its Centromeric Index (CI), which is defined as the length of the short arm to the total length of the chromosome are the most important geometrical features. The two arms of each chromosome are separated from each other in a point called Centromere. From visible point of view and by definition, the Centromere is the narrowest part of the chromosome along its longitudinal direction. Based on the location of the Centromere along a chromosome, there are three classes of metacenric, acrocentric, and telocentric chromosomes. From these explanations it is obvious that the Centromere is an important landmark used for chromosome classification.
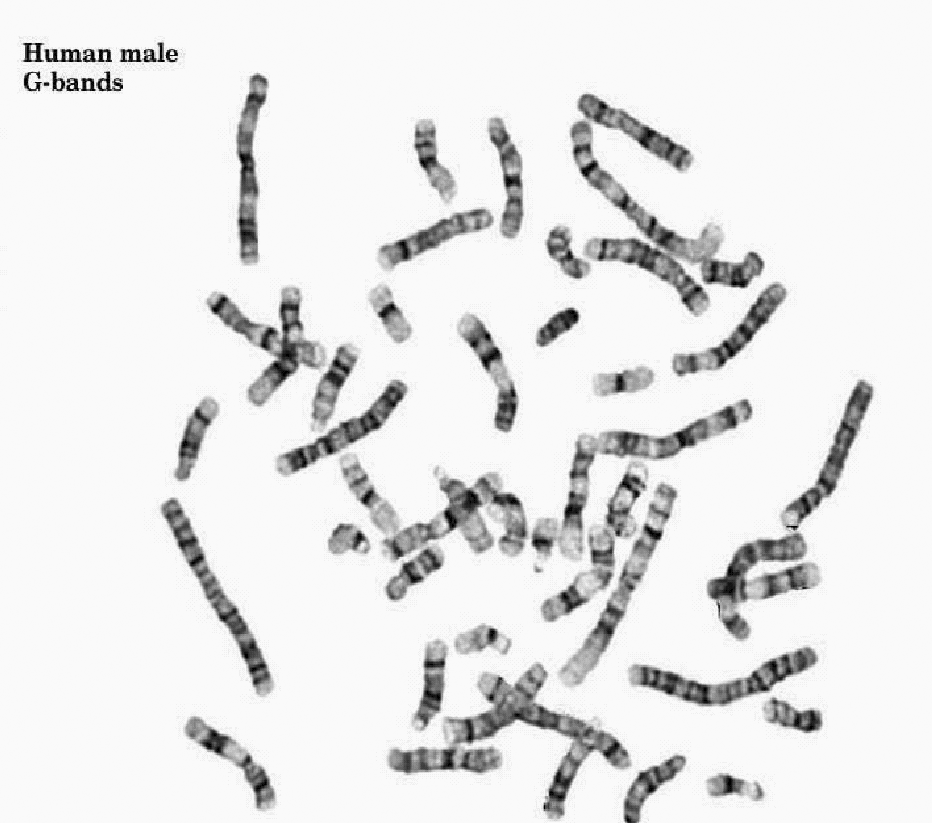 | Figure 1(a). G-banded chromosomes as seen under a light microscope |
 | Figure 1(b). Karyotype of the same chromosomes |
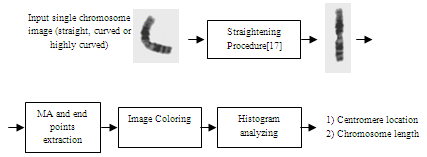 | Figure 2. The block diagram of the proposed algorithm |
2. Proposed Algorithm
- The block diagram of the proposed automatic Centromere and length detection algorithm in the straightened highly curved human chromosomes is shown in Figure 2. In continue each block will be described in more details
2.1. Straightening Procedure[17]
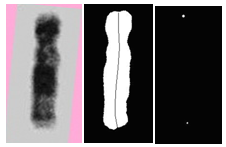
- At the first stage, the effective chromosome straightening algorithm of reference[17], which was developed and reported by the authors of the current article is employed. In brief, the chromosome straightening algorithm automatically identifies single chromosomes within the input image and uses each single separated chromosome as input. Next the input image is initially modified by means of a Median filter to reduce the effects of noise. The binary version of the image is generated next and the medial axis (MA) of the chromosome is then extracted by means of the thinning procedure using the binary version of the image. For chromosome straightening, the initially extracted medial axis is then modified by extending it in both ends considering the slope of the MA in a neighborhood of five last pixels at both ends. Next, the original input image is intensity sampled over many closely located perpendicular lines to the modified MA along the chromosome which are then mapped into a matrix (as rows) producing a vertically oriented straightened chromosome. The performance of this algorithm was evaluated using 54 selected highly curved chromosomes obtained at the pro-metaphase stage which were provided by the Cytogenetic Laboratory of the Cancer Institute, Imam Hospital, Tehran, Iran. The steps of the chromosome straightening procedure are demonstrated on an example image in Figure 3.
2.2. Medial Axis and End-points Extraction
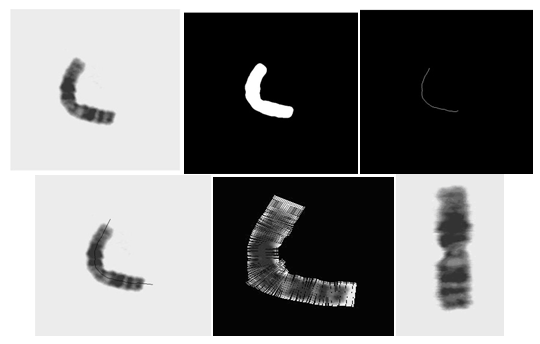 | Figure 3. (a) An example curved chromosome image, (b) The binary version of the same chromosome, (c) The extracted medial axis of the chromosome, (d) modified medial axis overlaid on the chromosome image, (e) intensity sampling of the chromosome over perpendicular lines to the MA, (f) resulting straightened chromosome[17] |
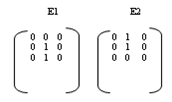 | Figure 4. Predefined masks for end points extraction of the MA in a vertically straightened chromosome |
 | Figure 5. (a) The straightened chromosome, (b) binary image with the MA overlaid, (c) the end points of the MA |
2.3. Image Coloring Using Gray Level Mask (GLM)
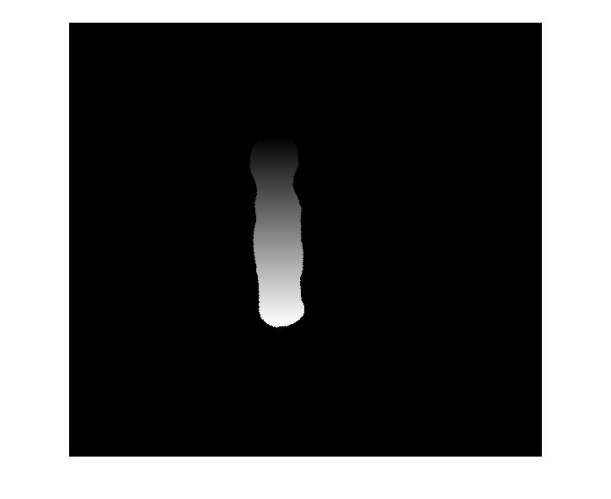
- At this stage a linearly varying gray level mask (GLM) is defined for each given chromosome as described in continue. Using the mask as a multiplicative filter a new version of the chromosome image with a new color distribution is generated. For generating the appropriate GLM for a given chromosome, the locations of the previously extracted end-points (Figure 5(c)) is used so that the gray values of the rows between the two end-points are set to linearly vary from the least gray value (0) to the upper limit gray value (255) from the top end-point to the bottom end-point as shown in Figure 6(a). Then by multiplication of the GLM and the binary image of Figure 5(b), the final processed image which is shown in Figure 6(b) is obtained. This image is now can be used to locate the Centromere of the chromosome as explained in the next section.
 | Figure 6. (a) The gray level mask (GLM) (b) multiplication of the GLM and the binary image shown in figure 4(d) |
2.4. Centromere Locating by Histogram Analysis
- The resulting image after image coloring (Figure 6(b)) is now goes through a histogram analysis procedure. Figures 7(a) and 7(b) show the histogram plots of the binary chromosome image of figure 5(b) and the colored chromosome image of figure 6(b) respectively. As shown, the histogram of the binary image includes only two peaks. The peak at the gray value 0 is related to the background black pixels while the peak at gray value 255 is related to the pixels inside the white binary chromosome. In comparison, the histogram of the colored chromosome image has the same peak for the background but a wide range of the gray values for the pixels inside the colored chromosome. This is due to the image coloring step. Since by definition, the Centromere is the narrowest part of the chromosome along its longitudinal direction, therefore the gray values coincident with the Centromere will have less population compared to the other gray values at other locations of the colored chromosome. This dictates that the global minimum along the histogram of the colored chromosome (Fig. 7(b)) identifies the location of the Centromere, which is marked in Figure 8.The length of the chromosome, can also be simply identified using the two end points shown in figure 5(c).
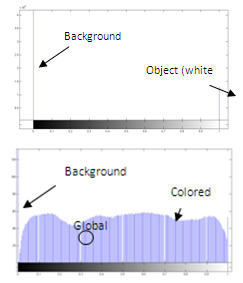 | Figure 7. (a) The histogram of the binary chromosome image of figure 5(b), (b) the histogram of the colored chromosome image of figure 6(b) |
 | Figure 8. The location of the Centromere which is automatically extracted and marked over the image |
3. The Data Set
- The performance of the proposed Centromere and length detection algorithm for the artificially straightened highly curved human chromosomes was evaluated using a dataset of 54 highly curved human chromosome images[17]. These single highly curved chromosome images were extracted from microscopic images which were produced in the Cytogenetic Laboratory of the Cancer Institute of the Imam Hospital, Tehran, Iran. These images each of size 768 × 576 pixels were generated by a conventional photography system using a Leitz light microscope with a gray level resolution of 256 levels.
4. Results and Discussions
- The proposed algorithm is now applied to the images in the data set and the location of the Centromere and the length of each chromosome were extracted. Next, all chromosome images were considered by a cytogenetic expert and the location of the Centromere and the length of each chromosome were manually identified which are considered as the gold standard. For performance evaluation of the proposed algorithm the Euclidian distances between the experts defined Centromeres and the automatically identified ones were calculated in terms of the number of pixels for all chromosomes in the data set. Similarly, the differences between the expert defined chromosome lengths with those automatically identified by the proposed algorithm were calculated for each chromosome in terms of the number of pixels and the differences are considered as the algorithm's error.The mean value and the standard deviation of the absolute values of these errors are then calculated which are shown in Table I. In addition, since due to the different sizes of the chromosomes the absolute errors in Centromere locations have different meanings, the mean and standard deviation of the normalized errors are also calculated by dividing each absolute error to the expert defied chromosome lengths and shown in table I.
ACKNOWLEDGMENTS
- The authors would like to express their sincere thanks to Ms. Farideh Farzanfar from the Cytogenetic Department of Imam Hospital for her valuable comments.
References
| [1] | L.M. Hong, "Medical Cytogenetics", 1st ed. Marcel Dekker, NY, USA, 2000. |
| [2] | F. Mitelman, "An international system for human cytogenetic nomenclature”, Recommendations of the International Standing Committee on Human Cytogenetic Nomenclature, Memphis, Tennessee, October 1994. |
| [3] | M. Moradi, S.K. Setarehdan and S.R. Ghaffari, “Automatic locating the centromere on human chromosome pictures”, Proceedings of the 16th IEEE Symposium on Computer-based Medical Systems, June 2003, pp. 56-61. |
| [4] | A. Carothers, J. Piper, “Computer-aided classification of human chromosomes: A review”, Statistics and Computing, Vol. 4, 1994, pp. 161–171. |
| [5] | J.M. Cho, “Chromosome classification using back propagation neural networks”, IEEE Eng. in Medicine and Biology, 2000, pp. 28-33. |
| [6] | J. Piper, E. Granum, “On fully automatic feature measurement for banded chromosome classification Cytometry”, Cytometry, Vol. 10, 1989, pp. 242–255. |
| [7] | J. Piper, “Finding chromosome centromeres using boundary and density information”, in: J.C. Simon, R.M. Haralick (Eds.), Digital Image Processing, D. Reidel Publishing Company, London, 1981, pp. 511–518. |
| [8] | F. Groen, T. ten Kate, A. Smeulders and I. Young, “Human chromosome classification based on local band descriptors”, Pattern Recognition Letters, Vol. 9, 1989, pp. 211–222. |
| [9] | J. Gregor, E. Granum, “Finding chromosome centromeres using band pattern information”, Compt. Biol. Med, Vol. 21, 1991, pp. 55–67. |
| [10] | R.J. Stanley, J.M. Keller, C.W. Caldwell, P. Gader, “Centromere attribute integration based chromosome polarity assignment”, Proceedings of the American Medical Informatics Association Conference, WA, USA, 1996, pp. 284–288. |
| [11] | E. Faria, D. Guliato and J. Santos, “Segmentation and centromere locating methods applied to fish chromosomes images,” in: Brazilian Symposium on Bioinformatics Proceedings, Sao Leopoldo, Brazil, 2005, pp. 181–189. |
| [12] | D. Vernon, “Machine Vision,” Prentice-Hall, 1991, pp. 49-51. |
| [13] | M. Moradi and S.K. Setarehdan, “New features for automatic classification of human chromosomes: a feasibility study”, Pattern Recognition Letters, Vol. 27 (1), 2006, pp. 1928-1935. |
| [14] | X. Wanga, B. Zhengb, S. Li C, J. J. Mulvihillc, and H. Liua, “A rule-based computer scheme for centromere identification and polarity assignment of metaphase chromosomes,” Comput Methods Programs Biomed, PubMed publication, Vol. 89, No.1, 2008, pp. 33-42. |
| [15] | E. Poletti, E. Grisan and A. Ruggeri. “Automatic classification of chromosomes in Q-band images,” 30th Annual International Conference of the IEEE-EMBS, Vancouver, British Columbia, Canada, August 20-24, 2009. |
| [16] | M. Javan Roshtkhari and S. K. Setarehdan, “A novel algorithm for straightening highly curved images of human chromosome”, Pattern Recognition Letters, Vol. 29, 2008, pp. 1208-1217. |
| [17] | S. Jahani and S. K. Setarehdan, "An automatic algorithm for identification and straightening images of curved human chromosomes", In press, in the Journal of Biomedical Engineering Applications, Basis and Communications, World Scientific Publishing, DOI No: 10.1142/S1016237212500469, Accepted 2012-05-13 |