-
Paper Information
- Next Paper
- Previous Paper
- Paper Submission
-
Journal Information
- About This Journal
- Editorial Board
- Current Issue
- Archive
- Author Guidelines
- Contact Us
International Journal of Biological Engineering
p-ISSN: 2163-1875 e-ISSN: 2163-1883
2012; 2(5): 44-47
doi: 10.5923/j.ijbe.20120205.02
An Algorithm for Detection of Arrhythmia
 Abstract
 Reference
 Full-Text PDF
 Full-Text HTML
Mujeeb Rahman , Mohamed Nasor
Department of Biomedical Engineering, Ajman University of Science & Technology, P. O. Box 346, Ajman, UAE
Correspondence to: Mujeeb Rahman , Department of Biomedical Engineering, Ajman University of Science & Technology, P. O. Box 346, Ajman, UAE.
| Email: |  |
Copyright © 2012 Scientific & Academic Publishing. All Rights Reserved.
This paper presents an algorithm for Electrocardiogram (ECG) analysis to detect and classify ECG waveform anomalies and abnormalities. This is achieved by extracting various features and durations of the ECG waveform such as RR interval, QRS complex, P wave and PR durations. These durations are then compared with normal values to determine the degree and types of abnormalities. Most of the data used for this study were extracted from the MIT-BIH arrhythmia database while some data was extracted from ECG recordings acquired specifically for the purposes of this study. The paper is concluded with detailed results obtained from testing the algorithm using the ECG data.
Keywords: Electrocardiogram, QRS Complex, Arrhythmia, Fiducial Point, Sampling Rate, Peak Valley Checker
Article Outline
1. Introduction
- The ECG waveform reflects the electrical activity of the heart. It is widely used as a routine cardiac diagnostic tool. The ECG signal is a repetitive waveform that comprises several waves distinguished each other by frequencies and amplitudes. These waves originate from different parts of the heart and are denoted by letters P, QRS, T and U as shown in Figure 1. Table 1. Shows characteristics of normal ECG. The normal rhythm of the heart is commonly named as normal sins rhythm (NSR). Variations in the time durations of these waves and segments from the NSR parameters indicate a pathological condition called arrhythmia. Arrhythmia can be classified into several types such as tachycardia, bradycardia, premature ventricular contractions, ventricular fibrillation, atrial flutter, sick sinus syndrome and heart blocks[1-2].
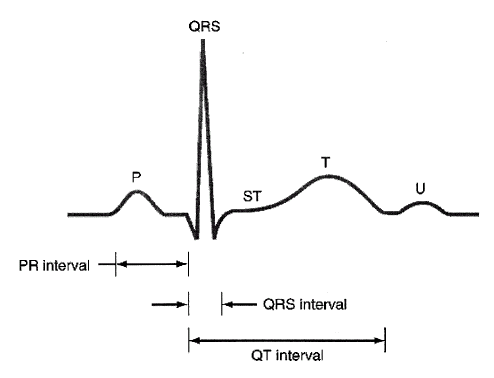 | Figure 1. Typical ECG Signal[12] |
|
2. Methodology
2.1. Data Acquisition
- Most of ECG signals were downloaded from the MIT-BIH arrhythmia database[6], which are sampled at the rate of 360 samples/sec. Additional ECG signals were acquired from patients suspected to have cardiac problems, by using a bio-amplifier together with data acquisition card (Advantech DAQ). Figure 2 explains the real time ECG data acquisition. Presence of noises were the most difficult threat while recording ECG signal. These noises are base line wandering noise, muscle tremor, power line (50Hz) noise etc. Specially designed filters were used in the bio amplifier module, which include band pass filter, notch filter etc to filter out these potential noises. In addition to this software based filters were also used to filter the acquired signal for better efficiency. Sampling rate of the acquired signal are 250 Hz. All ECG data used in this study were standard lead II. MATLAB was used as back end and front software.
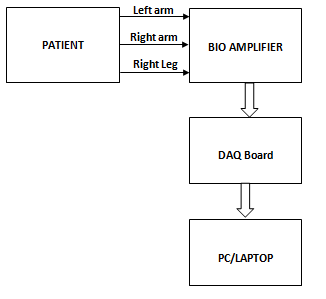 | Figure 2. Block diagram for real time ECG data acquisition |
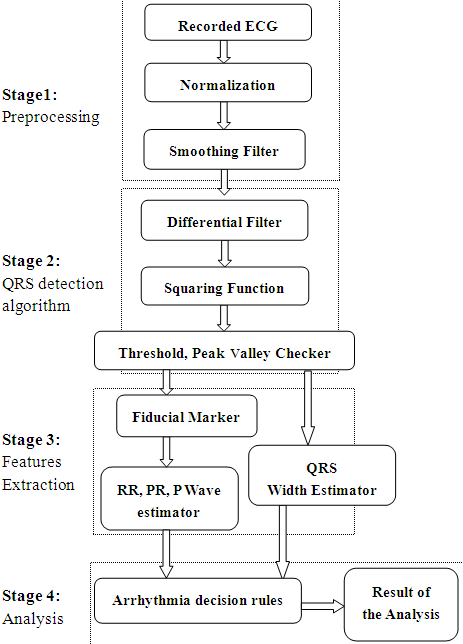 | Figure 3. Block diagram of ECG processing and arrhythmia interpretation |
2.2. ECG Data Processing and Arrhythmia Detection Algorithm
- The flowchart in Figure 3. explains the algorithm used for ECG data pre processing, features extraction, arrhythmia detection and interpretation. The waveform diagrams given in Figure 4 are the results of the various stages of the ECG pre processing.
2.2.1. ECG Preprocessing
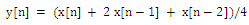
- The ECG waveform was first normalized to remove the DC offset. After that the ECG signal was passed through squaring and smoothing filters[3]. Stage 1 in figure 3 show various steps during ECG pre processing.Filtered signal y[n] is obtained using the formula:
 | (1) |
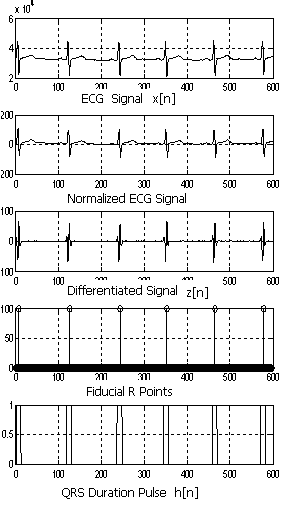 | Figure 4. ECG signal at various stages of the algorithm |
2.2.2. QRS Detection Algorithm
- Stage 2 in the figure 3 shows the various steps in QRS detection algorithm. The signal y[n] from (1) was then differentiated twice to give z[n] using the following equations:
 | (2) |
 | (3) |
 | (4) |
 | (5) |
2.2.3. Features Extraction
- After the determination of the QRS durations the fiducial points which show the location of R points were determined. The cardiac cycle (RR) intervals were obtained and hence the heart rate (HR) for each beat was calculated using the relationship:
 | (6) |
2.2.4. Arrhythmia Interpretation
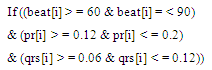
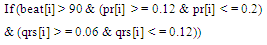
- Sixteen arrhythmia decision rules were developed after consultation with a group of cardiology specialists. The rules were applied to the features extracted from each ECG data files. There were two types analysis applied, one is the beat analysis and second is the beat to bat analysis. In beat analysis, each beat was examined against standard values, where as in the beat to beat analysis the similarities in the beat morphology between adjacent beats were examined.Some of the arrhythmia decision rules are explained in the equations (7) and (8).
 | (7) |
 | (8) |
3. Results and Discussion
- An algorithm for the detection of arrhythmia were developed. The algorithm was tested for twenty four recorded ECG data files. The values of the features extracted for one of the ECG files are given in Table 2. Table 3. shows the classification of arrhythmias based on features given in Table 2. Table 4 shows arrhythmia classifications of all data files using the algorithm compared with cardiologist interpretation of the same recording based on visual inspection only. These results show that the algorithm was able to give accurate interpretation of the various types of arrhythmias. The interesting finding was that the algorithm was able to detect additional arrhythmias in the beats which cannot be visually observed by cardiologists.
|
|
4. Conclusions
- An algorithm for the detection and interpretation of ECG arrhythmia was successfully developed and tested. The algorithm were tested for ECG data from MIT-BIH database and locally acquired ECG data files. Tests results indicate that the algorithm can help cardiologists in the diagnosis of various types of arrhythmia. This algorithm can be used to support diagnosis decisions made using other clinical tests and investigations.
References
| [1] | R Houghton, and D. Gray, Making sense of the ECG: Hands on Guide, 2nd Edition, Arnold Publishing Co., 2003 |
| [2] | Willis J. Tompkins., “Biomedical Digital Signal Processing” Prentice – Hall, 2000. ISBN -81-203-1478-6 |
| [3] | C. Caroubalos, C. Perche, C. Metaxaki-Kossionides, Sangriotis, and D. Maroulis, “Method for automatic analysis of the ECG, ”J. Biomed. Eng.Vol.10, 1988, pp. 343-347 |
| [4] | David. H. Bennet., “Cardiac arrhythmia (practical notes on interpretation and treatment)”, 7th edition. ISBN-10 0340925620 |
| [5] | Physionet: Research resource for complex physiological signals, online: http://www.physionet.org |
| [6] | Pan J. and Tompkins W. J. (1985) “A Real time QRS Detection Algorithm, IEEE Trans. Biomedical. Eng., 32. 230-236 |
| [7] | U. Kohler, C. Henning, and R. Orgmeister, “The principles of software QRS Detection”, IEEE Engineering in Medicine and Biology Magazine, vol. 21, no. 1 pp 42-57, 2002 |
| [8] | Fraden J., and Neumna M. R. (1980) “QRS Wave Detection”, Med. Biolog. Eng Comput., 18 pp. 125-132 |
| [9] | B. U. Kohler, C. Henning, and R. Orglmeister, “The principles of software QRS detection,” IEEE Eng. in Med. and Bio. 2002, pp. 42-47 |
| [10] | K. F. Tan, K. L. Chan, and K. Choi, “Detection of the QRS-complex, P-wave, and T-wave in electrocardiogram,” Proc. First Int. Conf. on advances in medical signal processing and information processing, Bristol, UK, 2000, pp. 41-47 |
| [11] | S. S Mehta and N. S. Lingayat, “Detection of P Wave and T Wave in Electrocardiogram”, Proceedings of the world congress on Engineering and computer science 2008, Oct 2008, San Francisco, USA |