-
Paper Information
- Paper Submission
-
Journal Information
- About This Journal
- Editorial Board
- Current Issue
- Archive
- Author Guidelines
- Contact Us
International Journal of Biological Engineering
p-ISSN: 2163-1875 e-ISSN: 2163-1883
2012; 2(1): 1-4
doi:10.5923/j.ijbe.20120201.01
Design and Construction of Compressive Force Measuring Device for Engineering and Biomaterials
 Abstract
 Reference
 Full-Text PDF
 Full-text HTML
Aye T. Ajiboye1, Isiguzo E. Ahaneku2
1National Centre for Agricultural Mechanization, P.M.B. 1525 Ilorin, Nigeria
2Department of Agricultural and Bioresources Engineering, Federal University of Technology, Minna, Nigeria
Copyright © 2012 Scientific & Academic Publishing. All Rights Reserved.
This paper presents the design and construction of a device for measuring compressive force of engineering and biomaterials. The device was calibrated and tested. The results obtained show that the device is adequate for measuring compressive force, ranging from 0-100kN in a situation where a percentage error of up to 0.4% is permissible.
Keywords: Design, Construction, Compressive Force, Biomaterials
Cite this paper: Aye T. Ajiboye, Isiguzo E. Ahaneku, Design and Construction of Compressive Force Measuring Device for Engineering and Biomaterials, International Journal of Biological Engineering, Vol. 2 No. 1, 2012, pp. 1-4. doi: 10.5923/j.ijbe.20120201.01.
Article Outline
1. Introduction
- The compaction of soil by agricultural equipment has become a matter of increasing concern due to the developments in the mechanization of agricultural operations leading to a steady increase in the average size of tractors and equipment[1]. For each crop, soil and season, there is an optimum level of compaction for maximum crop yield[2]. Loading beyond this optimum level can be very detrimental to crop development and yield. Other biomaterials, such as yams, tomatoes, etc are also subjected to compressive forces either during handling or transportation. These forces tend to exacerbate the degradation and deterioration of these biomaterials. Thus, there is the need to determine the magnitude of such compressive forces in order to device appropriate strategies for a particular situation. Therefore, the development of simple devices or techniques that will identify and quantify the compressibility of these biomaterials is a first step towards their effective management.Interpretation of compression data in terms of squeezing-flow parameters is receiving increasing attention in food research[3]. It has also been used in polymer science, particularly for measuring biaxial extensional viscosity of highly viscous polymers[4]The transducing method of measuring force is the most common because of its flexibility. The transducer had been utilized by earlier researchers for tension force measurement of strip materials[5]. While other methods of force measurements can be used for static or slowly varying loads, the elastic deflection method which fall under transducing method are widely used for both static and dynamic loads of frequency content of the order of thousands of hertz[6] and[7].Instron or Testometric Universal Testing Machine has always been used for obtaining most information on mechanical and textural properties of biomaterials. These force measuring devices earlier used for such research work are very expensive and difficult to maintain, especially in developing countries with low income and where Hi- technology is rarely available. When these machines break down, the only resort may be to send them abroad for repair unlike a locally designed and constructed machine with easy access to the developers for maintenance.The objective of this study is to design and construct a compressive force measuring system for engineering and biomaterials in order to determine the maximum load that will not adversely affect the materials.
2. Methodology
2.1. Design
- High reliability, accuracy, repeatability and reasonable sensitivity were put into consideration during the design and construction of this device. The components used for the designed circuit were selected based on technical, economic and availability considerations.The device is to measure force that ranges from 0kN to 100kN. Therefore, the maximum rating of the selected load-cell was 100kN. The load cell excitation voltage was +5v d.c and the output from each of the terminals with respect to ground under no-load (balanced) condition was 4.7mV d.c. The differential output between the two output terminals was to be 0 volt under no load condition.The detection of the differential output voltage from the load cell under maximum load is practically impossible for most available display that can only detect voltage in millivolt range and above. In order to display the voltage with reasonable accuracy and for ease of calibration, there is the need for this differential voltage to be amplified using differential amplifier.The design of the amplifier and associated circuit was carried out as follows:Figure 1 shows the circuit diagram of a differential amplifier. R1 and R2 are the input resistance, while Rf is the feed back resistance. R3 is the input voltage balancing resistance, while R4 and R5 are combined to form zero adjusting resistors. A is the operational amplifier; V1 and V2 are the inverting input and non-inverting input, respectively. V0 is the amplifier output voltage, while +Vcc and –Vcc are the positive and negative amplifier biasing voltage, respectively.
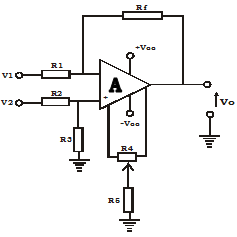 | Figure 1. Circuit diagram of a differential amplifier |
 | (1) |
 | (2) |
 But
But  Therefore,
 To obtain Rf, a value of 1KΩ was used for R1 to improve the input impedance of the amplifier. Thus, the value of Rf can be determined as follows:
 From equation (2)
 And
And A general-purpose operational amplifier UA741 was used for this work.For proper balancing (nulling) of the amplifier output, a 10KΩ pot and 1KΩ resistor was used for R4 and R5, respectively. The complete circuit diagram of the designed circuit is as shown in Figure 2.
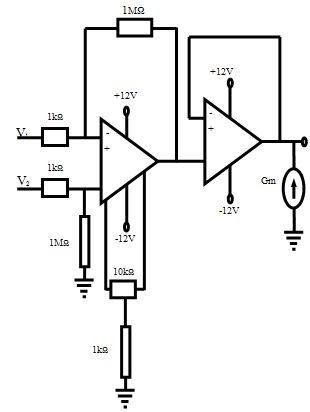 | Figure 2. Complete circuit diagram of the designed force-measuring device |
2.2. Construction of Compressive Force Measuring Device
- The component conditions were ascertained through testing before using them. The components were arranged accordingly on the Vero board and soldered.Conformance tests were carried out on the output of the load cell and output of the differential amplifier to ensure conformity with the desired voltage which is 1milli volt and 100milli volt for load cell and amplifier, respectively at full load and the results agreed with the desired voltage values. Figure 3 shows the designed and constructed compressive force measuring device mounted on a 15ton hydraulic press.
2.3. Calibration of Compressive Force Measuring Device
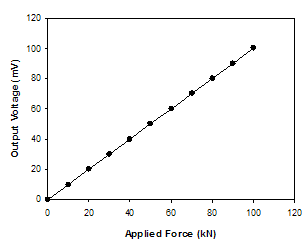
- According to [8], calibration is the process by which the output voltage of the constructed force-measuring device recorded as the applied force was varied in a predefined environment. The applied force could be from a primary standard force (dead weight) or a secondary standard force (e.g. Hydraulic press). For the purpose of this work, a hydraulic press with 300kN force rating was used and readings were obtained as the applied force was varied from 0kN to 100kN. The result is as shown in Table1. The calibration curve in Figure 4 was obtained by plotting the values of output voltage against the applied force. It can be established from the calibration curve, that the relationship between the output voltage and the applied force was linear with no hysteresis. Furthermore, when the data obtained were fitted to a linear regression model, the resulting equation for the calibration is stated in equation (3).
 | (3) |
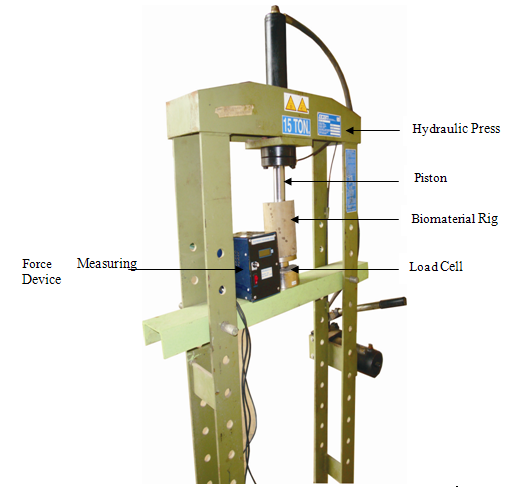 | Figure 3. Constructed Force Measuring Device Mounted on 15 ton Hydraulic Press |
|
 | Figure 4. Calibration Curve for the Force Measuring Device |
3. Results and Discussion
- The device was used on another hydraulic press different from the one used for calibration to further authenticate the results of the calibration test. The results obtained are shown in Table 2.It can be seen from Table 2 that the force-measuring device can be used for both dead weight and varying compressive force measurements ranging from 0 to 100kN. One can also observe that the maximum error obtained was 0.4% of the measured force. Therefore, it can be inferred that the device is adequate for force measurements in situations where 0.4% error is acceptable.
4. Conclusions
- In order to obtain high quality products of engineering and biomaterials, it is necessary to keep the compressive force on these materials below yield limit. To address this problem, a compressive force-measuring device was designed and constructed. The output of the device was linear, indicating that non-linearity has been compensated for in the selected sensor (load cell). The device is suitable for measuring both dead load and slow varying force ranging from 0-100kN. The device is “home grown” and therefore can be maintained locally.
References
| [1] | A. Alexandrou, R. Earl, and T. A. Gemtos. 2002. In Situ Assessment of Soil Compactibility. Paper No. 021088. 2002 ASAE Annual International Meeting/CIGR XVth World Congress, Chicago, Illinois, USA. |
| [2] | B. D. Soane. 1985. Traction and transport systems as related to cropping systems. In Proc. 1st International Conference on Soil Dynamics, 5:863 – 935. |
| [3] | M.M. AK and S. Gunasekaran. 1992. Stress-Strain Curve Analysis of Cheddar under Uniaxial Compression. Journal of Food Science. Vol. 57, no.5, pp 1078-1081. |
| [4] | S.H. Chatraei, C. W. Macosko, and H. H. Winter. 1981. Lubricated Squeezing Flow: a new biaxial extensional rheometer. J. Rheol. 25: 433. |
| [5] | Emad Said Addasi 2005. Transducer for Tension Force Measuring of Strip Materials American Journal of Applied Sciences 2 (1):400-402. |
| [6] | O. E. Doebelin. Measurement Systems Application and Design, International Student Edition, Mc Graw-Hill Intn’l Book Company, Tokyo pp. 333, 338, 341 and 342. 1975. |
| [7] | R. K. Jain Mechanical and Industrial Measurement, 2nd Edition, Khanna Publishers, Delhi pp. 54, 73-77. 1974. |
| [8] | E. Mamman, K.C. Oni and A.T. Ajiboye. 2002. Design and Construction of an Instrumen-tation System for Measuring Draught on Model Tillage Tools. Proceedings of the 1st Int’L Conference of West African Society of Agricultural Engineering (WASAE), Abuja, Pg. 23 |