-
Paper Information
- Paper Submission
-
Journal Information
- About This Journal
- Editorial Board
- Current Issue
- Archive
- Author Guidelines
- Contact Us
International Journal of Brain and Cognitive Sciences
p-ISSN: 2163-1840 e-ISSN: 2163-1867
2014; 3(1): 25-34
doi:10.5923/j.ijbcs.20140301.03
Meta-Analysis of Visual-Spatial Deficits in Dyslexia
 Abstract
 Reference
 Full-Text PDF
 Full-text HTML
Mahnaz Akhavan Tafti1, Joseph R. Boyle2, Candy Marie Crawford2
1College of Education & Psychology, Alzahra University, Tehran, Iran
2College of Education, Temple University, Philadelphia, Pennsylvania, USA
Correspondence to: Mahnaz Akhavan Tafti, College of Education & Psychology, Alzahra University, Tehran, Iran.
| Email: |  |
Copyright © 2014 Scientific & Academic Publishing. All Rights Reserved.
A number of studies have investigated visuo-spatial traits in dyslexia, and have reported mixed results. We undertook a systematic search of studies that examined visual-spatial deficits in dyslexia. The analysis involved comparisons of 324 students with dyslexia compared to 304 students without dyslexia from 12 studies. To address whether there was a difference between students with and without dyslexia (controls) on visual learning tasks, effect sizes were pooled and a weighted averaged effect size was computed using a fixed effects model. A significance test for the weighted average effect sizes was computed using an alpha level of .05.The weighted average effect size computed from these studies was found to be.72 (a medium effect size), which was statistically significant. Using a fixed-effects model, the mean effect size of our sample was .717+ .089, with a lower confidence mean effect size of .627 and an upper mean effect size of .806. The magnitude of deficits was, on average, moderate. Evidence for the visual attentional deficit was found to be robust to many variations in study design. The weighted average effect size for M(y)-cell abnormalities, was 1.0 (right eye) and 1.3 (left eye). However, moderate levels of heterogeneity were found between study-level effect sizes, Tau = .38771 (p=.092). These associations are discussed with respect to other findings that have demonstrated the existence of some specific visuo-spatial disorders in dyslexia.
Keywords: Dyslexia, Visuo-spatial deficits, Meta-analysis
Cite this paper: Mahnaz Akhavan Tafti, Joseph R. Boyle, Candy Marie Crawford, Meta-Analysis of Visual-Spatial Deficits in Dyslexia, International Journal of Brain and Cognitive Sciences, Vol. 3 No. 1, 2014, pp. 25-34. doi: 10.5923/j.ijbcs.20140301.03.
Article Outline
1. Introduction
- Dyslexia is one of the most common learning impairments, as evidenced by an unexpected difficulty in reading in children and adults, who otherwise possess the intelligence and motivation considered necessary for fluent and accurate reading. This implies a severe and persistent problem despite appropriate learning opportunities and absence of any obvious endogenous or exogenous pathology (American Psychiatric Association, 2000; Shaywitz, Gruen, & Shaywitz, 2007). Dyslexia is one of the most carefully studied types of learning disabilities, affecting more than 80% of all individuals identified as learning disabled. It is considered to be a neurobehavioral disorder affecting children, with prevalence rates ranging from 5% to 17.5% (Shaywitz, & Shaywitz, 2005). Developmental dyslexia is typically characterized by persistent, recurrent, and universal phonological impairments (for a review of related literature, see Judge, Knox, & Caravolas, 2013).For decades most research on dyslexia has emphasized the cognitive, behavioral, and neurological deficits at the core of this syndrome, though there is no consensus on the neuro-pathological mechanisms underlying the disorder. Developmental dyslexia was first recognized in the latter half of the 19th century, although the first case of loss of reading ability was described in 1676 by the physician John Schmidt. Adolph Kussmaul was the first physician to describe dyslexia in 1877, calling it 'word blindness.’ In 1896 W. P. Morgan, coined the term "Congenital Word Blindness", though James Hinshelwood, - a Scottish ophthalmologist- is known as, the ultimate founder and sponsor of the study of dyslexia. In 1895, in his article “word blindness and visual memory”, Hinshelwood postulated that dyslexics have a congenitally defective visual memory for words and letters, due to amalfunction in a specific cerebral area –the angular and supramarginalgyri- of the left brain. During the early stages of the study of developmental dyslexia, it was always described as a disease of the visual system, and patients with dyslexia were frequently seen by ophthalmologists (Critchley, 1964; Shaywitz, & Shaywitz, 2003). Other theories attributed the causes of dyslexia to brain structural defects. Following the innovative work of Dejerinein 1892, localizing the lesion causing the reading problems to the parietal lobe and the middle and inferior segments of the left occipital lobe, including the fibers connecting both occipital lobes, dyslexia essentially came to beconsidered as a disability of neurological origin. This notion was further consolidated by one of the most eminent figures in the history of dyslexia, American neurologist Samuel Torrey Orton. In 1925 he proposed his "strephosymbolia", or twisted symbols theory, suggesting a deficiency in visual perception of letters, possibly due to a brain malfunction, especially in the cerebral hemisphere dominance of one occipital lobe over the other (Critchley, 1964; Guardiola, 2001; Shaywitz, & Shaywitz, 2003). Since then, dyslexia has been linked to neuro-visual abnormalities, and most research has attempted to focus on the neurological deficit and its behavioral manifestations. However, substantial research has also indicated the existence of possible compensatory strengths, and an association of visual-spatial talents with dyslexia (i.e., von Karolyi, Winner, Gray, & Sherman, 2003; Geschwind, 1982, 1984; Galaburda, & Livingstone 1993; Gordon, 1983; Davis, & Braun, 1997; von Karolyi, 2001; Silverman, 1989, 2002; Attree, Turner, & Cowell, 2009; Wang, & Yang, 2011; West, 1992, 2005).However, a better understanding of how individuals with dyslexia differ in using their abilities to process thevisual informationmay have important implications for teaching and learning.
1.1. Visual Systems and Dyslexia
- Nearly half of human cerebral cortex is involved with processing visual information (Milner & Goodale, 1998). Three major parallel channels that carry visual information from the retina to the cortex are: magnocellular (M), parvocellular (P), and koniocellular (K) pathways. Most studies have concentrated on P and M channels in general, whereas research on dyslexia has focused on abnormalities in the magnocellular pathway in particular (Vidyasagar, &Pammer, 1999; Talcott, et.al, 1998). The magnocellular pathway or transient system is specialized in processing fast temporal information indifferent modalities (visual, phonological and motor). One of its important functions is to help control eye movements. It is sensitive to high temporal and low spatial frequencies. Although, the mechanism by which deficits of the M pathway affect reading has not yet been fully identified, but it is suggested that dyslexic readers suffer from a deficit in the M system (Facoetti, & Paganoni, 2000; Ramus, 2004; Schulte-Körne, & Bruder, 2010;Stein, 2001; Stein and Walsh, 1997). Pammer, and Wheatley, (2001) suggest that if a magnocellular deficit exists in dyslexia, it may originate at a retinal level, which is partly mediated by M(y)-cell abnormalities. Many dyslexics complain that words and letters move around, blur and merge with each other. Theimpaired magnocellular function of dyslexics mightaccount for the destabilized binocular fixation; apparentmovement of letters, poor binocular control, and visual confusion caused by two images moving around independently (Galaburda, &Livingstone, 1993; Graves, Frerichs, & Cook 1999; Stein and Walsh, 1997).However, there are contradictory findings about the role of the M pathway impairments causing reading difficulties. For example, Breitmeyer, (1993), and Lovegrove et al. (1982), reported a failure of this pathway to suppress the activity of the parvocellular (P) pathway at the time of saccadic eye movements, which in turn would support word fixation during reading. In contrast some studies (e.g., Bridgeman & Macknik, 1995, Volkman, et al. 1978, as cited in Skottun, 1997; Burr et al., 1994, as cited in Facoetti, Paganoni, & Lorusso, 2000; Skottun, & Parke1999) have reported that it is the M pathway, not the P pathway which is suppressed during saccades. Although most of the studies have demonstrated a problem with visual magnocellular pathway, Skottun, (1997, 2000) defies the notion that a magnocellular deficit should cause reading problems. Given that the magnocellular neuronsrespond most vigorously to coarse patterns with rapid temporal changes, hesuspected that how problems in the reading of printed characters that are stationary and that are distinguishable primarily on the basis of fine details, could be attributed to a magnocellular deficit. Hayduk, Bruck, and Cavanagh (1996), also suggest that a transient processing deficit is not a general characteristic of dyslexia. Additional functional visual system impairments in dyslexia have also been studied, including: visual evoked potential, abnormally prolonged visual persistence, decreased luminance contrast sensitivity, lower flicker fusion thresholds, abnormal meta-contrast masking, lower motion detection sensitivity, motion coherence, and visual search, left visual mini-neglect (see Borsting, et.al., 1996; Graves, Frerichs, & Cook 1999; Hari, Renvall, & Tanskanen, 2001; Iles, Walsh, & Richardson, 2000; Slaghuis & Ryan, 1999; Talcott, et.al, 1998).
1.2. “PCR”, “lateral masking”, and ‘‘visual crowding’’ Models of Dyslexia
- The central and peripheral visual fields are the separate yet complementary visual systems, each optimized for very different needs. Information from the central and peripheralparts of the visual fieldsis largely segregated in the brain. The central region of the visual system can resolve fine detail, from a tiny portion of the visual field at a particulartime, whereas theperiphery is less acute but coversan area roughly three times larger in the surrounding visual field. These visual systems differ in boththeir anatomical and functional properties. Periphery-to-center ratio (PCR) is a useful parameter that describes the degree to which a person favors one region over the other (Facoetti, Paganoni, Turatto, Marzola, & Mascetti , 2000 ; Geiger, Lettvin and Fahle, 1994; Schneps, Rose & Fischer, 2007).On the basis of a center – periphery distinction, the assumption is that people’sabilities for visual search and visual comparisonis strongly affected by their relative abilities to use information in the center versus the periphery. There is a reciprocal inhibitory interaction between the center and the periphery. A bias to over-stimulate the center over the periphery will increase the attentional load in the center, which in turn will further suppress the periphery. Similarly, a bias that over-stimulates the periphery will tend to suppress the center (Plainis et al., 2001, as cited in Schneps, et al., 2007; Schwartz et. al., 2005). The load on attentional processing too is affected by the preferential use of one region over the other, suggesting that the periphery and the centerinterfere under attentional task load. Evidence suggests that at least some people with dyslexia may be biased to favor information in the peripheryover the center, which accounts for the observed deficits in tasks such as visual search, but tend to exhibit peripheral advantages, as in visual comparison characteristic of a high-PCR group. Visual-spatial properties of periphery are: broad perceived field of view, high confusion from distracters or noise, high need for attention in spatial comparisons, fast processing speed, low need for working memory in spatial comparisons, good concurrent spatial processing, poorsequential visual processing (favoring high PCR),that enhance visual comparisons and implicit spatial learning (Schneps, et al., 2007). The center’s restricted field of view reduces attentional demands as it limits the number of distracters that need to be processed at any given time, whereas the periphery receives information from many locations at once and is therefore prone to confusion, limiting the region’s utility in the presence of noise or distracters (Ibid).The lack of coordination between peripheral and central vision, is interpreted as the cause of lateral masking, sometimes referred to as ‘‘visual crowding’’. Visual masking is the process by which a visual stimulus becomes less recognizable when surrounded by other visual inputs, as demonstrated by similar line of research (e.g. Bouma & Legein, 1977 as cited in Lorusso, et.al 2004; Hill and Lovegrove 1993; Lovegrove & Mac-Farlane, 1990). This lateral masking, would also account for the dyslexics’ greater difficulties in reading strings of letters than single letters. According to Geiger, Lettvin, & Zegarra-Moran (1992), non- effective lateral masking in the periphery leads to a simultaneous processing of the visual information from the entire surroundings, which may result in confusion and unclear perception (Lorusso, et.al 2004). On the other hand few studies have reported the dyslexic group to exhibitboth a peripheral advantage along with an increased peripheral distraction, which is consistent with the notion that dyslexia constitutes a high-PCR group (e. g., Howard, Howard, Japikse, & Eden 2006; Grosser, & Spafford, 1990). Goolkasian, and King (1990), also found that dyslexic readers were better than average readers at detecting scaled letters embedded in an array tested in some of the peripheral locations. However, because the central field is more important than the peripheral field in reading, few researchers have systematically investigated visual differences in processing the visual information in the peripheral field in dyslexia (Schneps, et al., 2007).
1.3. Visual Attention in Dyslexia
- It is rational to assume that visual attention plays an important role in the reading process. Two distant, yet integrated mechanisms of spatial attention are: a facilitatory process for the attended location enhancing processing of selected information and an inhibitory process for the unattended location, which suppresses unselected information. Both work as complementary mechanisms for efficient processing of attended stimuli, while suppressing the unattended ones. The inability to ignore or filter irrelevant inputs –like peripheral cues-has been emphasized in dyslexia (Facoettia, A., Lorussob, M L., Paganonic, P., Umilta, C., & Mascetti, G G 2003). Other recent studies also have demonstrated the existence of specific visuo-spatial attention disorders in dyslexia (e.g., Ackerman et al. 1990; August & Garfinkel 1990; Casco et al.1998, as cited in Facoetti, Paganoni, & Lorusso, 2000). According to these authors, the deficit in visual selective attention may be responsible for reduced reading speed and accuracy. However, there is some evidence to suggest that the difficulty with reading skill acquisition in dyslexia can be attributed to narrower perceptual span (Roach & Hogben, 2008). Studies of visual attention in dyslexic groups have shown, specific deficit in exogenous orientinginvisual attention and difficulties in sustaining focused attention for efficient processing of visual information(Facoetti, Paganoni, Turatto, Marzola, & Mascetti 2000), asymmetrical distribution of attention of left and right visual fields (Facoetti, & Turatto, 2000),weakness of attentional selection in dyslexia (Roach & Hogben, 2008), deficit in visuo-spatial attention (Vidyasagar, & Pammer, 2009), spatial cueing conditions(Posner, 1980); deficit on serial visual search tasks (Iles, Walsh, & Richardson, 2000), visual search and attention (Skottun, & Skoyles, 2007), selective attention (Rayner, Murphy, Henderson, & Pollatsek, 1989), localization of visual stimuli (Graves, Frerichs, & Cook 1999), allocation of attention to rapidly-sequential stimuli (Visser, Boden, & Giaschi, 2004), visual attention (VA) span deficit (Bosse, Tainturier, & Valdois, 2007), spatial deviation of attentional weighting along with a striking reduction in perceptual processing speed (Stenneken, et. al., 2011), a general attentional deficit to visual stimuli, slower responses and longer reaction times in both the short and long cue–target interval (CTI) conditions (Heiervang, & Hugdahl, 2003), and impaired ability to process dual targets, longerattentional blink (AB) recovery time, and deficits in processing rapidly changing visual displays (Laasonen, 2012). Nonetheless Heiervang, and Hugdahl, (2003), found that the dyslexic readers did not differ from non-impaired readers, using purely visual task. Their finding is contrary to the basic visual-attentional deficit model.Facoetti, and Turatto, (2000), reported that dyslexia is associated with an asymmetrical distribution of spatial attention in the visual field, suggesting that the major problem of dyslexic children might be an inability to suppress distracting information in the right visual field. More research on visual field asymmetry in the form of over-distractibility of right and inattention of left has provided support to the hypothesized left-side mini-neglect in dyslexics (e. g., Facoetti, & Turatto, 2000; Hari, Renvall, & Tanskanen, 2001; Sireteanu, Goertz, Bachert, & Wandert, 2005). Facoetti, Molteni, (2001), also found that children with dyslexia showed an anomalous and asymmetric distribution of visual attention with the gradient of left inattention and right over-distractibility. However, the findings of the overlapping studies of visual attention, magnocellular pathway visual processing deficits, and periphery-to-center ratio (PCR) are useful both to illustrate the deficits in visual processing tasks in people with dyslexia, as well as for talents in spatial learning and the perception ofvisual anomalies (Facoetti, Paganoni, Turatto, Marzola, & Mascetti 2000; Goolkasian, & King, 1990; Howard, et al., 2006; Schneps, Rose & Fischer, 2007).Dyslexia is primarily a language-based disorder that hinders reading acquisition skills. Reading as the signature deficit of dyslexia is inherently a visual behavior, and any visual deficit would necessarily interact with a language-processing deficit to compound the dyslexics reading difficulties. The purpose of this meta-analyses study was to synthesize the empirical evidence from many pieces of clinical research in the field to determine if it holds a clear picture of visual-spatial characteristics that may account for the reading deficiencies of dyslexia.
2. Method
2.1. Study Design
- In this research procedures used by previous meta-analyses of learning tasks and students with dyslexia (Lum, Ullman, & Conti-Ramsden, 2013) were followed. We identified articles using major data bases related to dyslexia that included: Science Direct, ERIC (hosted by Ebsco Host), MEDLINE (hosted by OvidSP), EMBASE, CINAHL (hosted by Ebsco Host), PsycInfo (hosted by EbscoHost).
2.2. Study Inclusion Criteria
- Studies were selected on the basis of the following criteria: First, all the articles aboutvisual / spatial or visual-spatial problems in dyslexia were assessed regardless of the publication year. Second, studies included in the meta-analysis were required to be published in a peer-review journal reporting on an original piece of research. Third, the study was required to have dependent measures that assessed visual, spatial or visual-spatial information on students with dyslexia in clinical settings. Fourth, the study needed to have presented the dependent measures to only one group comprising K-12 individuals identified with dyslexia prior to the study and one control group comprising individuals that did not have an identified disability (typically developing individuals). We chose to use only those studies that had students who had been already identified and diagnosed through their school/clinic/health care system. All of the above criteria served to identify studies that used similar methodologies.
2.3. Study Selection
- Figure 1 summarizes the studies that were removed at various steps when using the selection criteria. After the removal of duplicate entries, one reviewer assessed all the abstracts. A random sample of 10% of all abstracts was assessed by a second reviewer. Any disagreements were resolved by discussion. Finally, the reviewers independently retrieved and screened full-text articles according to the eligibility criteria. Of the relevant articles, only those articles that contained useable data could be used to determine effect size. Only those studies were used that could provide a sufficient amount of data. In order to be included in our analysis, a study had to have reported a mean group score (with standard deviation) for each group (e.g., students with and without dyslexia), or reported the necessary values (e.g., type of test, degrees of freedom, F or t value and the level of significance) of a t-test or F-test. The article could not be used, if they did not report this minimal level of data for a comparison between the control (students without dyslexia) and students with dyslexia group. Without this data, it was impossible to complete an effect size analysis. Moreover, those studies that did not disaggregate their data into a control group and students with dyslexia could not be used. Through an analysis of the data, seven such studies had to be eliminated. Inter-rater reliability was strong, for 12 out of the 13 articles (r =.93). There viewers independently agreed upon the suitability of each article for inclusion in the meta-analysis, and anagreement about the suitability of one article was reached through consensus (Lum, Ullman, & Conti-Ramsden, 2013; Moher, Liberati, Tetzlaff, Altman, 2009).
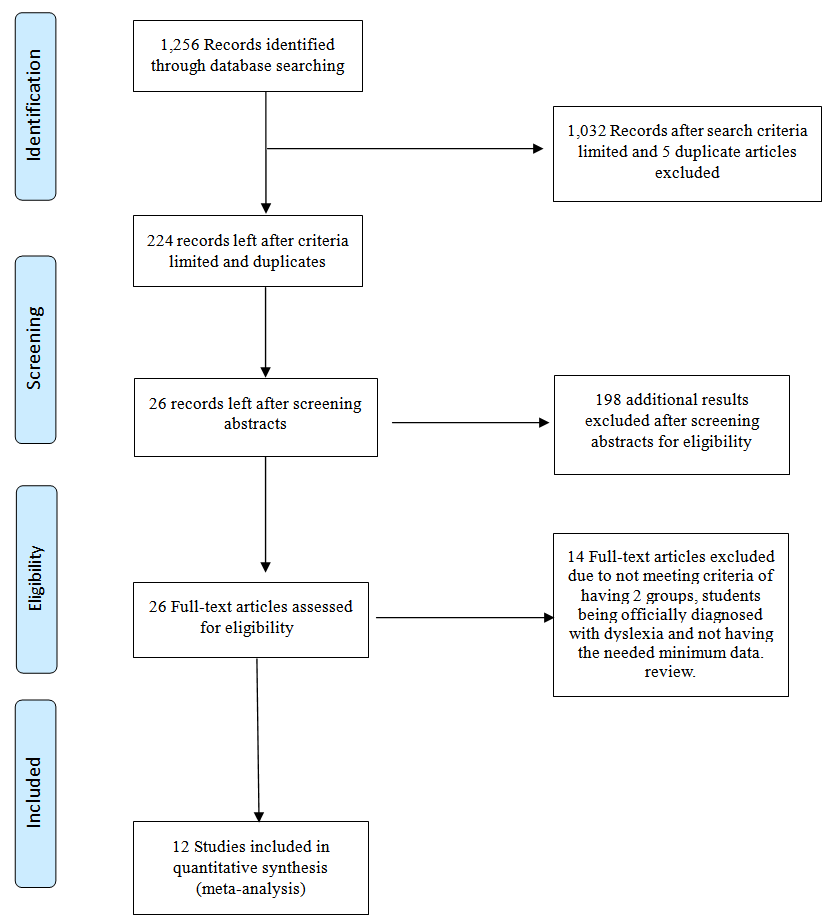 | Figure 1. Flow diagram showing article selection procedure adapted from www.prisma-statement.org |
|
2.4. Effect Size (ES) Calculations
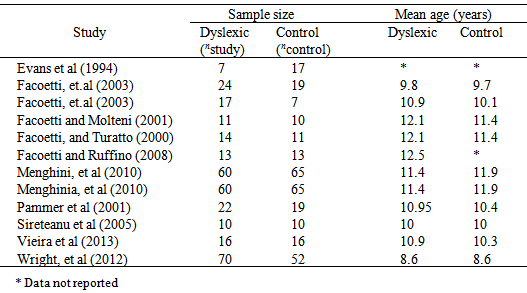
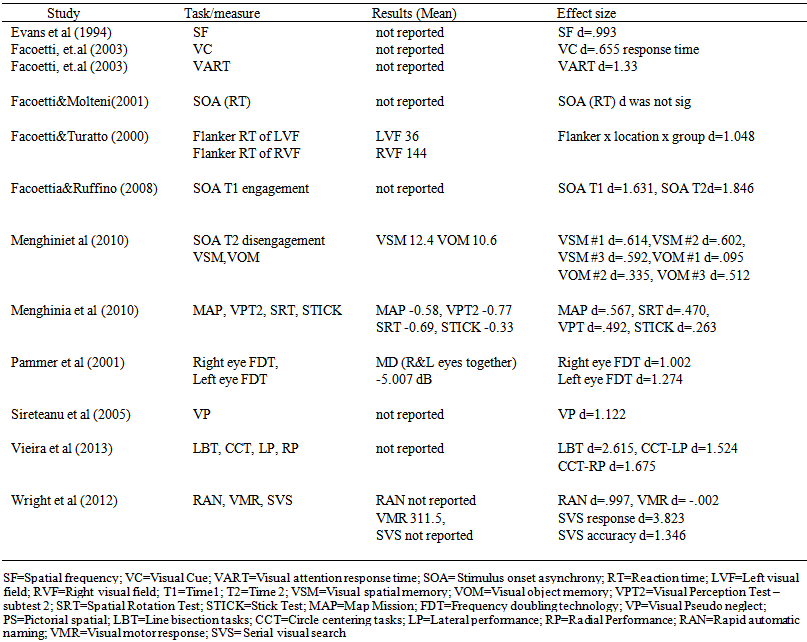
- For control group studies, the ES was estimated using Cohen’s d, whereby the difference is derived by the mean control group (students without dyslexia) score minus the mean score from the students with dyslexia group and divided by the pooled standard deviation. For this meta-analysis, the ES was computed so that positive values indicated that the control group evidenced higher scores on the visual measures, as compared to the study group of individuals with dyslexia. According to Cohen (1988), ESs can be interpreted as follows: ES = 0.20 (small), ES = 0.50 (medium) and ES = 0.80 (large).The results from each study include an effect size for each visual measure that was used to compare groups on visual tasks. In some cases, more than one measure was reported so we reported on multiple measures for some studies. Table 2 presents the summary of each studies sample characteristics.
 | Table 2. Summary of study sample characteristics |
3. Results
- To address whether there was a difference between individuals with dyslexia and students without dyslexia (controls) on visual learning tasks, effect sizes were pooled and a weighted averaged effect size was computed using a fixed effects model (Hedges & Olkin, 1985). A significance test for the weighted average effect size was computed using an alpha level of .05. Using a fixed-effects model, the mean effect size of our sample was .717+ .089, with a lower confidence mean effect size of .627 and an upper mean effect size of .806.
3.1. Evaluation of Publication Bias of Included Studies
- Preliminary analyses investigated the presence of publication bias using a funnel plot which plots standard error against individual study effect sizes using Beggs and Mazumdar rank order correlation (Beggs & Mazumdar, 1994). These data are presented in Fig. 2. This approach uses the Spearman rank correlation to examine the relationship between standardized effect sizes and variance in effect size.
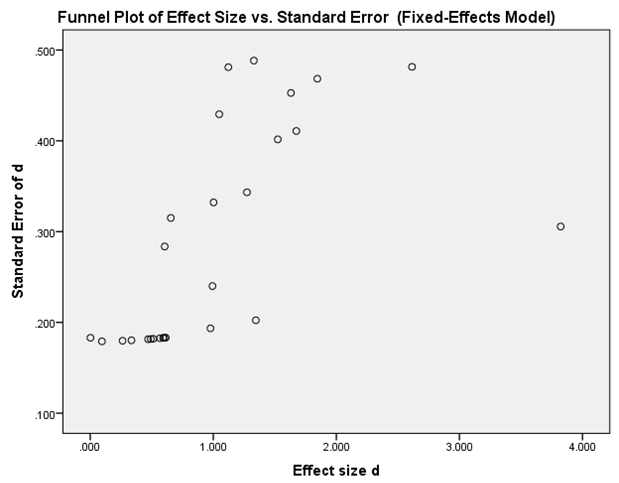 | Figure 2. Funnel Plot of Visual Spatial Studies |
3.2. Heterogeneity
- Heterogeneity may either arise from systematic differences between studies or random differences between effect sizes, or both. Much for more so than clinical trials, performing meta-analyses of observational studies have the challenge of incorporating various designs and levels of quality. If the heterogeneity is due torandom differences then it can be modeled. Even in the presence of heterogeneity, study characteristics and effects can be analyzed. Using a random effects model, the Q-test is unbiased and is the most efficient. The Q-test was introduced by DerSimonian and Laird (1993). The extent of heterogeneity, the number of studies included, and the weight given to each study all affect the power of the test for heterogeneity. In our study, Tau = .38771 (p=.092).
4. Discussion
- There has been a long-standing controversy over the role of visual factors in dyslexia. This report reviewed and synthesized evidence from research on this topic as indexed by the differences in performance of students with and without dyslexia on visual and visuo-spatial tasks. Following a systematic search of the literature, 12 studies were included in the meta-analysis. The analysis involved comparisons of 324 students with dyslexia compared to 304 students without dyslexia. The weighted average effect size computed from these studies was found to be.72 (a medium effect size), which was statistically significant. This result signifies that on average, the mean difference in visual andvisuo-spatial attention was about 0.72 standard deviation smaller in students with dyslexia than in control participants. Although most studies demonstrated a problem with visual attentional factors, some studies obtained much larger effect sizes than others, with d-values ranging from .002 to 3.823. The results of the study were consistent with other findings that have demonstrated the existence of specific visuospatial attention problems in dyslexia (e.g., Ackerman et al. 1990; August & Garfinkel 1990; Casco et al. 1998, as cited in Facoetti, et al., 2000; Facoetti, et al. 2009; Roach & Hogben, 2008; Skottun, & Skoyles, 2007; Stenneken, et. al., 2011; Vidyasagar, & Pammer, 2009; Visser, et al., 2004). The results are also interpreted as a support for the notion of developmental dyslexia as a deficit in spatial relationship perception, characterized by an increased anisotropy that account for both the global perceptual distortions and abnormal crowding. According to Evans, Drasdo, and Richards (1994), visual sequential processing accounts for much of the slightly slower performance of dyslexic group at the simulated reading task, than the low-level visual deficits.The heavy concentration on reading has resulted, the extant visual research on dyslexia to neglect visual skills other than the context of reading. And to disregard the need to reexamine the notion that atypical brain development or functioning, apparent in characteristics rightly described as deficits, could also result in an enhancement of certain cognitive abilities (e.g., advantages for peripheral vision, Howard et al., 2006). A further significant variable associated with visual deficiencies in dyslexia was the M(y)-cell abnormalities (Pammer, & Wheatley, 2001), with the weighted average effect size of 1.0 (right eye) and 1.3 (left eye). Several other studies also have linked visual deficits in the perception of luminance contrast, coherent motion, flicker persistence, and other processes associated with the magnocellular system with dyslexia (Borsting, et.al., 1996; Facoetti, & Paganoni, 2000; Galaburda, &Livingstone, 1993; Graves, Frerichs, & Cook 1999; Iles, Walsh, & Richardson, 2000; Ramus, 2004; Slaghuis & Ryan, 1999; Stein, 2001; Stein & Walsh, 1997; Talcott, et.al, 1998). Whereas, Wright, et al., (2012) taking into account the reaction time to visual stimuli in their research, found visual search deficits to be independent of magnocellular deficits in dyslexia. Furthermore, Hayduk, et al., (1996), also have acknowledged that a transient processing deficit is not a general characteristic of dyslexia. Such discrepancies might, however, make the results less robust. On the basis of the fact that there are studies that are consistent and not consistent with a magnocellular deficit, or the studies that have found deficits that are incompatible with magnocellular impairment, Skottun, (1997, 2000) maintains that by focusing narrowly on a magnocellular deficit, the true variety of visual anomalies suffered by dyslexic individuals is overlooked. He further asserts, “However, it seems that at this point in history the magnocellular deficit theory has outlived its usefulness and that it will be more of a hindrance than a help to progress in this area” (Skottun, 1997, p. 398).Given the complex and multifaceted nature of visual functioning, it is unlikely that any single factor alone (including all the factors discussed here) can account for all of the rich variability inherent in the dyslexic phenotype. Additional research is required to examine the visual differences and possible strengths further.In conclusion, results presented in this report indicate that several visual traits are consistently associated with dyslexia without actually explaining them. The magnitude of deficits was, on average, moderate. Evidence for the visual attentional deficit was found to be robust to many variations in study design. In the ongoing effort to improve identification and remediation of reading difficulties, the results from the present study suggest that poor visual attention, visual masking, deficiencies in magnocellular pathway, and problem with periphery to center ratio might be risk factors for reading problems. But at the same time, the possibility of the existence of some advantages (e. g., in peripheral vision) is worthy of further consideration. However, further research is needed to develop a new approach for identification and assessment practices.
4.1. Limitations of the Study
- Limitations that need to be addressed when interpreting the results presented in this report are: First, results from the meta-analysis showing visual problems in dyslexia do not explain the causality between any visual deficits and reading problems. Studies identified in the systematic search of the literature have used different methodologies, measures, and samples. Moreover inconsistent terminology and definitions, and the lack of consistent criteria for visual-spatial tasks also make the results less robust. Second, the individual variability found among dyslexics may yield to unpredictable individual differences in their cognitive skills repertoire. For many reasons, people vary in their abilities to make use of information in different forms or in one region relative to the other. This variation may influence effect sizes. Besides most of the studies we drew upon for this research did not differentiate between subtypes of dyslexia, each may be regarded as the probable source of bias. Third, studies about adults with dyslexia were not included in this research. This may lead in missing of any information on the developmental changes that might have been occurred. Most importantly studies investigating visual strengths of dyslexia were not included. They are dealt with in another report. Moreover, we were limited in our analysis based upon the data that authors provided in their studies. If all of the authors of studies had reported means and standard deviations of all measures in their studies, we could have been more inclusive in our analysis. Reporting of these data would have permitted us to conduct a larger analysis.
4.2. Educational Implications
- Given different patterns of ability and disability for visual functioning, different instructional approaches can be designed that are compatible with each pattern, and provide opportunities for diverse visual learning needs. In doing so, combining visual and verbal approaches allow students to use the mode that is most compatible with their mode of learning. For example, graphic organizers have long been found to yield more effective learning (Dexter & Hughes, 2011). Graphic organizers are visual and spatial displays used during complex or abstract learning. Using these types of approaches would help scaffold students’ learning by providing a cognitive structure for students to learn complex information. Likewise, when used during reading comprehension tasks, visual displays have been effective at helping students comprehend information (Kim, Vaughn, Wanzek, & Wei, 2004).
ACKNOWLEDGMENTS
- Partial funding for the sabbatical leave was provided by Alzahra University, Iran. College of Education at the Temple University, USA was the host for this research project in fall semester 2013. We wish to thank both the universities for their support and cooperation.
Note
- * Denotes study included in the meta-analysis