-
Paper Information
- Next Paper
- Previous Paper
- Paper Submission
-
Journal Information
- About This Journal
- Editorial Board
- Current Issue
- Archive
- Author Guidelines
- Contact Us
International Journal of Brain and Cognitive Sciences
p-ISSN: 2163-1840 e-ISSN: 2163-1867
2013; 2(2): 14-22
doi:10.5923/j.ijbcs.20130202.02
Moderate Chronic Alcohol Consumption Ameliorates Diabetes Induced Cognitive Dysfunction
 Abstract
 Reference
 Full-Text PDF
 Full-text HTML
Shallie Philemon D1, Adejumo Esther. N2, Shotunde Damilola3, Ihyar Ayenge C4, Adenuga Adebukola K3
1Anatomy Department, Babcock University. Ilishan-Remo. Nigeria
2Histopathology Unit, Department of Medical Laboratory Science, School of Public and Allied Health, Babcock University, Ilishan-Remo. Nigeria
3Anatomy Department, Olabisi Onabanjo University. Ago-Iwoye. Nigeria
4Anatomy Department, Benue State University. Nigeria
Correspondence to: Shallie Philemon D, Anatomy Department, Babcock University. Ilishan-Remo. Nigeria.
| Email: |  |
Copyright © 2012 Scientific & Academic Publishing. All Rights Reserved.
Type II diabetes mellitus (DM2) has been associated with an increased risk of cognitive dysfunction and dementia through disease processes such as Alzheimer's disease and vascular dementia. While reduced glucose tolerance has deleterious effects on memory in the elderly and concomitant hippocampal atrophy. We investigated the impact of chronic intake of high and low alcohol on diabetes induced cognitive dysfunction.Adult male wistar rats were randomly divided into four groups of five rats each viz; GROUP 1- Normal control, were given rat pellets adlibitum; GROUP 2- Untreated diabetic, diabetes was induced with multiple dosages of alloxan per k/body weight. GROUP 3- Diabetic and low alcohol consumption, the rats in this group received multiple dosages of alloxan (as in group 2), followed by 9% w/w alcohol daily. GROUP 4- Diabetic and high alcohol consumption, the rats received multiple dosages of alcohol (as in group 2), and 20% w/w alcohol. At the end of the four weeks, rats in all the groups were subjected to Barne’s Maze test to assess their spatial memory. The rats were weighed and then euthanized by an overdose of chloroform. The skull was cut open and the brain excised and a portion of the prefrontal cortex taken and processed for the determination of some biochemical parameters. Sections of the brain were taken and processed routinely and stained with H&E. The results showed impairment of spatial memory, decrease psychomotor speed, neuronal necrosis and apparent decreased neuronal density. From our findings, we concluded that diabetes significantly impaired spatial memory and decrease psychomotor speed, while chronic alcohol intake ameliorated the detrimental cognitive dysfunctional. Both diabetes and alcohol operate probably by interfering with insulin sensitivity.
Keywords: Diabetes, Alcohol, Spatial Memory, Hippocampus
Cite this paper: Shallie Philemon D, Adejumo Esther. N, Shotunde Damilola, Ihyar Ayenge C, Adenuga Adebukola K, Moderate Chronic Alcohol Consumption Ameliorates Diabetes Induced Cognitive Dysfunction, International Journal of Brain and Cognitive Sciences, Vol. 2 No. 2, 2013, pp. 14-22. doi: 10.5923/j.ijbcs.20130202.02.
Article Outline
1. Introduction
- Type II diabetes mellitus (DM2) has been associated with an increased risk of cognitive dysfunction that can be seen with brain imaging ([2]), decreases in psychomotor speed ([3]), frontal lobe/executive function ([4, 5]), verbal memory, processing speed ([6]), complex motor functioning ([4]), working memory ([5]), immediate recall, delayed recall, verbal fluency ([4]), visual retention and attention ([7]) . The impact of these subtle neuro cognitive deficits on and dementia through disease processes such as Alzheimer's disease and vascular dementia ([1]). It has been shown that reduced glucose tolerance has deleterious effects on memory in the elderly and concomitant hippocampal atrophy. ([1]). The impact of these subtle neuro cognitive deficits on the daily lives of patients with type 2 diabetes is not clear. Sinclair et al. 2000 found that subjects with mini-mental status exam scores less than 23 fared worse on measures of self care and ability to perform activities of daily living ([8]). These subjects also displayed an increased need for personal care and increased rates of hospitalization when compared with controls. Patients with diabetes also have been found to have slower walking speed, lack of balance, and increased falls associated with type 2 diabetes, but whether the cerebral affects of diabetes contributed to these abnormalities is debatable ([9]). Complicating the impact of mild neuro cognitive dysfunction secondary to diabetes on daily living is the observation that patients with diabetes are twice as likely to have depression ([5]), which will also negatively affect cognitive function and daily activities. Type 2 patients also have an increased incidence of Alzheimer’s disease ([10]), and increased incidence of vascular dementia ([11 & 12]). On the other hand excessive alcohol intake is associated with impaired prospective memory ([13]). This impaired cognitive ability leads to increased failure to carry out an intended task at a later date, for example, forgetting to lock the door or to post a letter on time. The higher the volume of alcohol consumed and the longer consumed, the more severe the impairments ([13]). One of the organs most sensitive to the toxic effects of chronic alcohol consumption is the brain. In France approximately 20% of admissions to mental health facilities are related to alcohol related cognitive impairment most notably alcohol related dementia. Chronic excessive alcohol intake is also associated with serious cognitive decline and a range of neuropsychiatric complications. The elderly are the most sensitive to the toxic effects of alcohol on the brain. ([14]).There is some inconclusive evidence that small amounts of alcohol taken in earlier adult life are protective in later life against cognitive decline and dementia ([15]). We investigated the impact of chronic intake of high and low alcohol in adult life on diabetes induced cognitive dysfunction.
2. Materials and Methods
- Adult wistar rats were used in this research work. They were housed in individual wooden cages given food and water ad libithum and were allowed to adapt to their new environment for a period of three weeks before the commencement of the experimental protocols. The rats were randomly picked into four groups of five rats viz; GROUP 1- Normal control given normal rat pellets ad libitum; GROUP 2- Untreated diabetic, diabetes was induced with multiple dosages of alloxan; 150mg/kg body weight of alloxan for a start and subsequently 50mg/kg body weight weekly till the end of the experiment. GROUP 3- Diabetic and low alcohol intake, the rats in this group received multiple dosages of alloxan (as in group 2). After establishing diabetes, they were given 9% w/w alcohol daily; GROUP 4- Diabetic and high alcohol intake, the rats received multiple dosage of alcohol (as in group 2), they were given 20% w/w alcohol. Fasting blood glucose level and body weight of the animals were monitored regularly throughout the duration of the experiment which lasted for four weeks. At the experimental period rats in the groups were subjected to Barne’s Maze test to assess their spatial memory. After which they were euthanized by an overdose of chloroform. The rats were then dissected and of blood sample collected directly from the heart, while the skull was cut open and the brain excised and a portion of the prefrontal cortex taken homogenized. The blood and the brain sample were centrifuge and the supernatant analysed for some biochemical parameters.
2.1. Barnes Maze
2.1.1. Introduction
- Carol Barnes developed a dry-land maze test for spatial learning and memory in 1979 where animals escaped from a brightly lit, exposed circular open platform surface to a small dark recessed chamber located under one of the 18 holes around the perimeter of the platform. Although it was initially invented for rats, the Barnes maze (BM) has become more popular to assess spatial memory in mice, taking advantage of their superior abilities to find and escape through small holes.Visual cues are required to optimize cognitive performance in the BM. Rodents with hippocampal damage showed impaired performance in the BM, supporting the spatial nature of the task.The BM has similarities to the Morris Water Maze and to the radial-arm maze task, but no strong aversive stimuli or deprivation is being used as reinforcement. Instead, weak aversive stimulation may be applied to increase the motivation to escape from the circular platform (e.g., buzzer, light, fan). Strong aversive stimuli (i.e. water or shock) are likely to produce stress in the animal, influencing the performance in the task1.Mostly reference memory and working memory has been studied using the BM with different protocols. Here we propose a protocol to study short-term and long-term reference memory in rats.
2.1.2. Equipment Setup
- THE MAZE: The paradigm consists of a circular platform (92 cm of diameter) with 20 equally spaced holes (5 cm diameter; 7.5 cm between holes) along the perimeter and is elevated 105 cm above the floor. In the Barnes maze, animals receive reinforcement to escape from the open platform surface to a small dark recessed chamber located under the platform called a “target box”. Rats can access the target box through an escape tunnel (transparent plastic tube 50 cm long, 5 cm diameter), which is located under the target hole (28 × 22 × 21 cm). A ramp is placed under the target hole so that rat may reach the escape tunnel easily. From the centre of the maze all holes looks identical and the ramp is not visually discriminated from the other holes from most points on the maze, the rat is situated adjacent to the escape hole.
2.1.3. Stimulus/Reinforcement
- Noise was used as stimulus to complete the task. We suggest using only aversive noise as reinforcement because using a fan may be too stressful for rats and noise is considered an appropriate stimulus in the system used. Use of aversive noise of 85 dB as a motivator by an electronic metronome as a buzzer for the experiments; it is very useful because we have timbre, pitch and volume settings to choose. The same parameter was used during the whole experiments.
2.1.4. Room Configuration
- Visual cues (different colours and shapes: triangle, rectangle, circle and/or a cross) were prepared and placed surrounding the maze. Animals have spatial visual cues endogenous to the room (for example a door, a desk or a computer) and intentional (prepared by the experimenter). These cues were not being moved during the whole experiment as these are the animal’s reference points for locating the target hole.
2.1.5. Time Taken
- Each trial takes 3 min per rat, with an ITI of 15 min and 4 trials per day during the acquisition phase. During the training days at least 3 rats per hour were tested. The probe trial takes 90 s (half of the time used for the training trials) per rat. Twelve days after the first probe trial rats were tested again in a second probe trial that takes 90 s per rat. Rats were not tested between the two probe trials.
2.1.6. Procedure
2.1.6.1. Adaptation Period
- 1). Rat was placed in a cylindrical black start chamber in the middle of the maze. After 10 s have elapsed the chamber was lifted, buzzer was switched on and the mouse was guided gently to the escape box. The rat was not forced to get into the hole as this may be too stressful. If the mouse does not want to get into the target hole, place it gently to the side of the hole and pull gently the base of the tail in the direction away from the hole, which induces the mouse to move in the opposite direction of the tail pull and enter the hole. If this does not work, place the mouse directly into the escape box.2). Once the rat is inside the box, buzzer is turned off.3). The rat is allowed to stay in the escape box for 2 min. 4). The maze was cleaned using methylated spirit to avoid olfactory cues. In addition to cleaning, the maze was rotated around its central axis after each trial in order to control for possibly remaining odour cues.5). Rat was placed in the cylindrical black start chamber in the middle of the maze. After 10 s have elapsed lift the chamber, buzzer was switched on and the rat was allowed to explore the maze for 3 minutes.6). During these 3 minutes number of primary errors, total errors and primary latency were measured.7). The trial ends when the rat enters the goal tunnel or after 3 min have elapsed. Immediately after the mouse enters the tunnel, the buzzer was turned off and the rat is allowed to stay in the tunnel for 1 min. 8). If the rat does not reach the goal within 3 minutes, it is gently guided to the escape box. Rats may go out of the escape box during the time it should stay in it. The escape hole is covered once the rat is inside for 1 minute 9). Rat was placed in its home cage until the next trial.10). Steps 4-9 were repeated until the animal has had four trials each for the day with an inter-trial interval (ITI) of 15 minutes during 4 days.11). The ITI of 15 minutes were used to test the next 3 rats.Reference memory (short- and long-term retention): Probe trial12). On day 5, 24 h after the last training day, the probe trial was conducted. The target hole was closed. Maze was rotated so that the target hole is closed and re-adjusted so that the holes are in the same position as during the training days.13). Animal was placed in the middle of the maze under the cylindrical black start chamber and after 10 s have elapsed, the chamber was lifted, buzzer switched on and the rat was allowed to explore the maze.14). The rat was removed after a fixed interval (90 s). The probe trial is done in order to determine if the animal remembers where the target goal was located. Number of pokes (errors) in each hole and latency and path length to reach the virtually target hole were measured.15). To assess long-term retention a second probe trial was applied on day 12, without any training session between day 5 and day 12. Steps 11-13was repeated (to study reference memory probe trials were performed at least 24 hours after the last training trial; if the probe trial is given immediately after the last training trial recent recall is being measured).
2.2. Haematoxylin and Eosin Staining Method (Drury and Wallington, 1965)
- a) De-wax section in xylene 2mins in each of two changes. b) Rehydrate in absolute alcohol, 90% -70% -50% 1min each . c) Rinse in distilled waterd) Stain with haematoxylin for 10 – 15mine) Wash off excess stain in water 2-3minsf) Differentiate in 1% acid 1-2min (to remove excess Stain)g) Blue in running tap water for 5minutes, check micro graphically. h) Counter stain with 1%eosin for 5-10minsi) Wash off surplus stain in waterj) Mount in DPX (Distrene plasticizer xylene)
3. Results
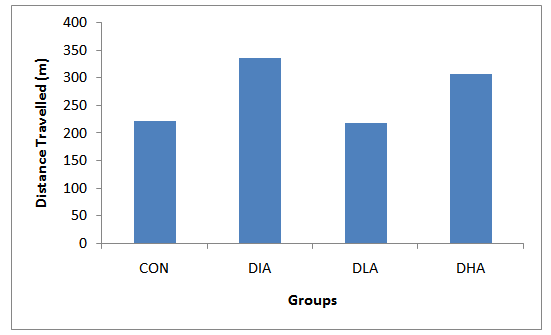
- Figs. 1 & 2 show that the mean latency period to locate the escape hole was highest in the diabetes and lowest in the low alcohol intake group, while figs. 3 & 4 reveal that the alcohol intake groups covered the longest distance when compared with the control while the diabetes travelled the shortest distance. Figs 5 & 6 compared the mean speed among the experimental groups with alcohol intake groups having the highest speed.
3.1. Mean Latency to Escape
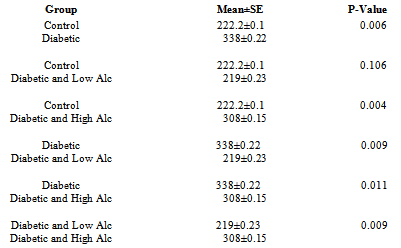
- Figs 1, 2 and Tab. 1 show the mean latency periods in experimental groups. Fig 1 reveals that the mean latency plunged on day 3 and 4 followed by a sharp rise on day 5 and the final dive on day 12. The results in fig. 2 show highest latency for diabetic and lowest for the control group. The mean latency period for control is 222.2 secs, for diabetic group is 337 secs, for diabetic and low alcohol group is 219, while for diabetic and high alcohol is 308 secs. Student t-test analyses among groups in Tab. 1 show a significant difference (P≤ 0.05) between control and diabetic, control and diabeti+high alcohol, diabetic and diabetic+low alcohol, diabetic and diabetic+high alcohol groups, while control and diabetic+low alcohol did not show any significant difference (P≥0.05).
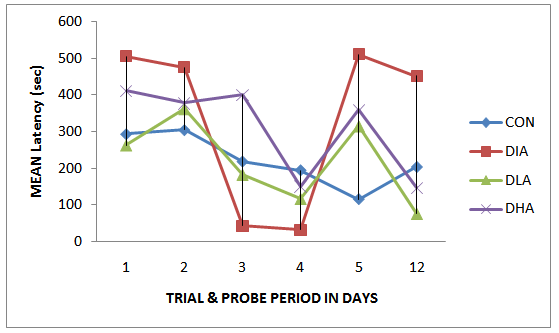 | Figure 1. Mean Latency during Trial and Probe Periods |
 | Figure 2. Mean Latency in the Experimental Groups |
|
3.2. Mean Distance Travelled
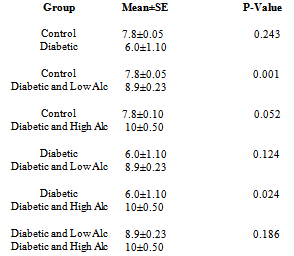
- Figs 3,4 and Tab. 2 reveal the mean distance travelled by rats in experimental groups. Fig. 3 shows that the distance travelled increase during the first three days of trial period in all groups except the control group followed by a sharp decrease on the fourth day of the trial period. The probe period is characterized by an increase on day 5 followed by a decrease on day 12. The results in fig. 4 show that the diabetic group travelled the shortest distance, while alcohol intake groups travelled the farthest distance. The mean distance travelled for control is 7.8m, for diabetic group is 6.0m, for diabetic and low alcohol group is 8.9m, while for diabetic and high alcohol is 10m. Student t-test analysis among groups in Tab. 2 show an insignificant (P≥0.05) decrease in diabetic group when compared to the control, while significant increase (P≤ 0.05) between control and diabeti+high alcohol, diabetic and diabetic+low alcohol, diabetic and diabetic+high alcohol groups, while diabetic and diabetic+low alcohol show insignificant increase (P≥0.05)
|
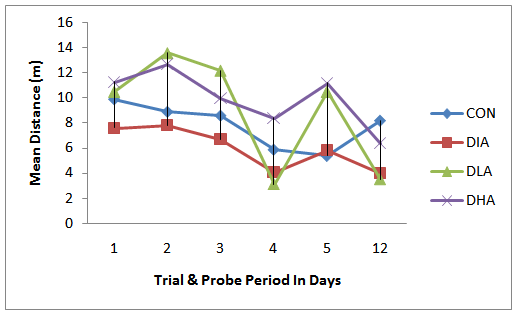 | Figure 3. Mean distance Travel during Trial & Probe Period |
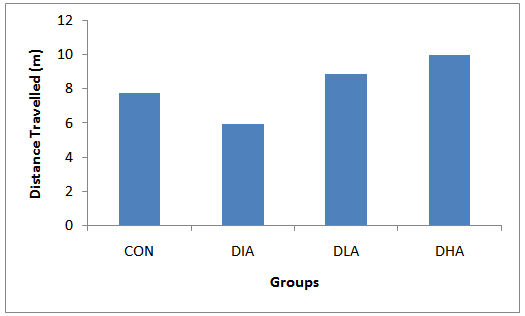 | Figure 4. Mean distance Travelled |
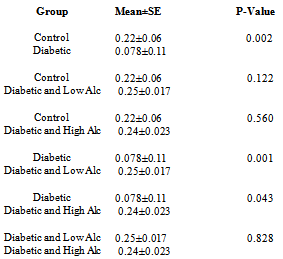
3.3. Mean Speed Travelled
- Figs 5,6 and Tab. 2 reveal the mean speed travelled by rats in experimental groups. Fig. 5 shows that the speed decrease and increase progressively during the trial and probe periods in the diabetic and control groups respectively, while the alcohol intake groups manifest undulating patterns. The results in fig. 6 show that the diabetic group has the slowest speed, while alcohol intake groups have the highest speed. The mean speed travelled for control is 0.22, for diabetic group is 0.078, for diabetic and low alcohol group is 0.25, while for diabetic and high alcohol is 0.24. Student t-test analyses among groups in Tab. 3 show a significant (P≤0.05) decrease in speed in the diabetic group when compared to the control. Significant increase (P≤ 0.05) between diabetic and diabeti+high alcohol, diabetic and diabetic+low alcohol were also noticed, while control and diabetic+high alcohol, control and diabetic+low alcohol groups show insignificant increase (P≥0.05).
|
 | Figure 5. Mean Speed Travelled During Trial & Probe Period |
 | Figure 6. Mean Speed Travelled During Trial & Probe Periods |
3.4. Qualitative Neurohistology
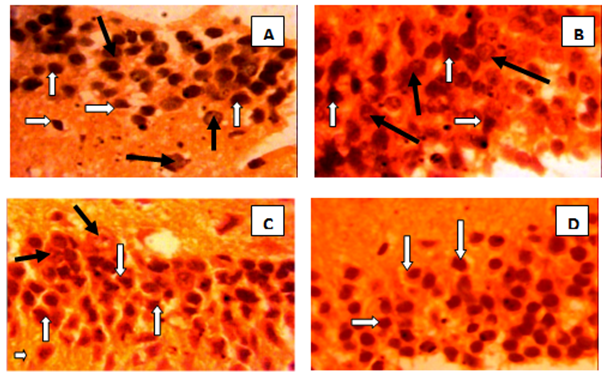 | Plate 1. Photomicrograph showing the dentate gyrus of A. Control group with neuronal cell bodies (white arrows), glial cells (black arrow); B. Diabetic group with distorted parenchyma, apparently significantly reduced neuronal density (white arrows) and increased glial cells (black arrow); C. Diabetes and low alcohol intake group showing shrunken neuronal cell bodies (white arrows), gliall cell (black arrow); Diabetes and high alcohol intake group showing apparently normal looking neuronal cell bodies (white arrows), gliall cell (black arrow) |
4. Discussion
- The main findings of this study are impairment of spatial memory and decrease psychomotor speed as indicated by prolonged latency period, longest distance travelled and slowest speed and neuronal atrophy in the diabetic group, while both high and low alcohol intake increase psychomotor speed and low alcohol ameliorates the negative impact of diabetes on spatial memory as observed by the lowest latency to locate the escape hole which in this study is related to increase in speed. The high alcohol intake group performed poorly when compared to the control but better when compared with the diabetic group. This poor performance is positively correlated to the longest distanced travelled by this group. Diabetes mellitus has been associated with alterations in neurotransmission, electrophysiological abnormalities, structural changes and moderate disturbances of learning and memory ([16, 17, 18 & 19]). In the present study alloxan induced diabetes in rats impairs spatial memory. Spatial learning impairments have been reported ([20]), as well as an impaired expression of long-term potentiation (LTP) and an enhanced expression of long-term depression (LTD) ([21, 22]). In this study learning impairments develop gradually during the trial period. This could be due to alterations in synaptic plasticity which was reported to develop gradually after induction of diabetes onwards ([23]). Some investigators have proposed that the tissue damage in diabetes may be the consequence of increased oxidative stress resulting from increased availability of metabolic substrate ([24]). It was also postulated that an alternative mechanism based on the endothelial dysfunction known to accompany insulin resistance (and type 2 diabetes). Investigators have demonstrated that there are specific interstitial decreases in glucose levels in those brain areas activated ([25]). Given that the glucose transporter at the blood–brain barrier is saturated at physiological glucose levels, to bring more glucose to the activated region acutely, new glucose transporters need to be exposed to the blood. Therefore, intact endothelial function is likely needed to recruit new capillaries to carry additional glucose to the activated sites, and its dysfunction could result in functional hypoglycaemia during periods of increased demand. This relative functional hypoglycaemia, when coupled with the elevations in cortisol levels that are often present in diabetes, may result in tissue damage, particularly in those brain regions more vulnerable to damage, such as the hippocampus ([26]). Alcohol intake can have a dramatic impact on memory. Alcohol primarily disrupts the ability to form new long-term memories; it causes less disruption of recall of previously established long-term memories or of the ability to keep new information active in short-term memory for a few seconds or more. At low doses, the impairments produced by alcohol are often subtle, though they are detectable in controlled conditions. As the amount of alcohol consumed increases, so does the magnitude of the memory impairments ([27]).Tremendous progress has been made toward an understanding of the mechanisms underlying diabetes and alcohol-induced memory impairments. Diabetes and alcohol disrupts activity in the hippocampus via several routes - directly, through effects on hippocampal circuitry, and indirectly, by interfering with interactions between the hippocampus and other brain regions. The impact of alcohol on the frontal lobes remains poorly understood, but probably plays an important role in alcohol-induced memory impairments ([28]). Chronic alcohol abuse can lead to the degeneration of genes in the brain that recognize insulin. The resulting effects are comparable to neurological deterioration's that often result from type 2 diabetes ([29]). Researchers used postmortem human tissue to show that high levels of alcohol consumption over long periods of time leads to lower levels of genes needed to respond to insulin and insulin growth factor (IGF). This gene deficiency and lack of recognition of insulin leads to further brain damage. Type 2 diabetes is characterized by decreased sensitivity in the body to insulin production, and the resistance to insulin. Having an inability to recognize insulin due to brain function, which is what appears to happen with heavy alcohol use, seems to mimic these type 2 diabetes conditions ([29]). The poor psychomotor speed noticed in this study could be attributed to Insulin and IGF resistance in the cerebellum and frontal lobe which was reported to be associated with loss of neurons and their connections, and decreased levels of neurotransmitters needed for learning, memory, and motor function ([29]).
5. Conclusions
- From our findings, we concluded that diabetes significantly impaired spatial memory and decrease psychomotor speed, while chronic alcohol intake ameliorated the detrimental cognitive dysfunction. Both diabetes and alcohol operate probably by interfering with insulin sensitivity.