-
Paper Information
- Paper Submission
-
Journal Information
- About This Journal
- Editorial Board
- Current Issue
- Archive
- Author Guidelines
- Contact Us
International Journal of Applied Sociology
p-ISSN: 2169-9704 e-ISSN: 2169-9739
2016; 6(1): 7-14
doi:10.5923/j.ijas.20160601.02

Impact of Population Growth on Land Use Changes in Wadi Ziqlab of Jordan between 1952 and 2008
 Abstract
 Reference
 Full-Text PDF
 Full-text HTML
Yaser M. Mhawish 1, Muna Saba 2
1Integrated Water and Land Management (IWLM), ICARDA, Kabul, Afghanistan
2Water, Environment, and Soil, NCARE, Amman, Jordan
Correspondence to: Muna Saba , Water, Environment, and Soil, NCARE, Amman, Jordan.
| Email: |  |
Copyright © 2016 Scientific & Academic Publishing. All Rights Reserved.
This work is licensed under the Creative Commons Attribution International License (CC BY).
http://creativecommons.org/licenses/by/4.0/

Three sets of remotely sensed data were used to measures the land use/land cover changes in Wadi Ziqlab catchment during the period 1953-2008. Its population increased from 11162 in 1952 to 63970 in 2004. The population growth have resulted into changing the land use/land cover of 4414 ha (42%) of the catchment area. The main changes show that orchard trees and urban areas increased by 22.4% and 6.2% into field crops, forest and rangeland areas. The ownership data indicates the presence of 44843 plots in the catchment, 68.9% of these have the area of less than 1 ha.
Keywords: Spatial analysis, Remote sensing, Land fragmentation, Land use/land cover, Wadi Ziqlab
Cite this paper: Yaser M. Mhawish , Muna Saba , Impact of Population Growth on Land Use Changes in Wadi Ziqlab of Jordan between 1952 and 2008, International Journal of Applied Sociology, Vol. 6 No. 1, 2016, pp. 7-14. doi: 10.5923/j.ijas.20160601.02.
Article Outline
1. Introduction
- Global land use has significantly changed during the past decades. Historically, the driving force for most of land use changes is population growth [26]. Population growth is often used as a proxy for land use change [11], but at lower scales, a set of complex drivers are important too [12]. Increasing demand on food as a result of population growth has created more pressure on land resources [1].Objectives for land use change differ between the developed and developing countries. In developed countries, land use change is based on economic reasons such as large scale farming or urban development and an increasing need to conserve biodiversity and environmental quality for current and future generations [3], whereas in the developing countries, rapid population growth, poverty and the economic situation are the main driving forces [13, 17, 26].The Mediterranean region has been affected by anthropic disturbance for thousands of years, and is, nowadays, one of the most significantly altered hotspots in the world [9].Wadi Ziqlab catchment is part of the Northwest Jordanian mountains. In an evaluation of the woodland and range in Wadi Zeqlab it was found that the natural vegetation cover decreased between 1953 to 2000, due to deforestation, overgrazing, and expansion of agriculture and urban areas. The cultivated areas (olives and field crops) are concentrated near urban areas [25].Deforestation in Wadi Ziqlab catchment and is considered as the main cause of land degradation [10]. During the last two decades, less than 60 thousands forest trees were removed and replaced with fruit trees, houses, or buildings [20].Fragmentation is also considered as a major problem, which prevents land development. Multiple ownership of single plot is also dominant and hinders proper farming. Thus, land left unused and exposed to degradation.The analysis of the study area on a territorial basis involves the use of Geographical Information System (GIS), for the management, analysis and representation of the real world. Satellite remote sensing allows a retrospective, synoptic viewing of large regions, thus providing the potential for a geographically and temporally detailed assessment of land-use/ land cover changes in estuarine watersheds [29, 22]. Remote sensing (RS) provides information about the various spatial criteria/ factors under consideration, can provide us the information like land use/land cover, drainage density, topography etc. RS in combination with GIS are powerful tools to integrate and interpret data. The integrated GIS and RS technology apart from saving time and yielding good data quality have the ability to locate potential new cropland sites [14]. The general objective of this study was to evaluate the extent of land use/land cover changes within Wadi Ziqlab catchment and to investigate the impact of population growth and land tenure on these changes.The specific objectives were to:■ Assess temporal land use/ land cover change and land ownership in the study area.■ Identify possible factors that governed land use/land cover changes and the distribution of different land utilizations during specific period of time.
2. Study Area
- Wadi Ziqlab catchment is located within an area that extends from the Highlands of Northern Jordan, to Eastern mountains bordering Jordan Valley. The study area is located between 32°23"- 32°34" North to 35°33"- 35°50" East. The catchment is 24 km long, 8 km wide, and covers about 105 km² (Figure 1).
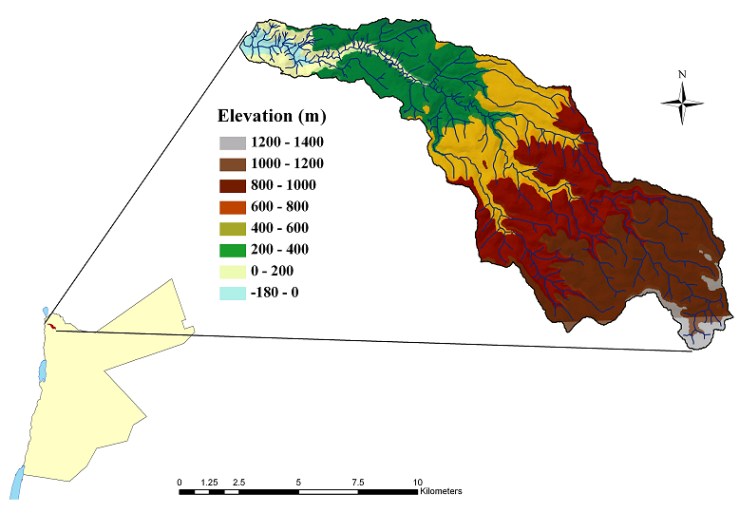 | Figure 1. Location of study area, showing the boundary of Wadi Ziqlab catchment |
3. Methods
- GIS software was used as a platform for data analyses and management of products. The following maps and data were used in this study:■ Topographic maps at scale of 1:25000 -produced by Royal Jordanian Geographic Center (RJGC) in 1997- was used to produce the contour lines and Digital Elevation Model (DEM) map.■ Different land cover maps were produced, using aerial photos at scale 1:10,000 obtained from (RJGC) for year 1953 and 1978. Satellite image Quick Bird, resolution (60 cm) prepared by (RJGC) 2008.■ Ownership and land size distribution map was produced, using cadastral maps at scale 1:10000 obtained from (Land and Survey Department-Jordan, 2004).■ The polygon boundaries were digitized by on-screen digitizing, for topographic maps, aerial photo for years 1953 and 1978, and satellite image for year 2008.Satellite image (2008) and aerial photos (1953 and 1978) were analyzed and classified to investigate land covers and land cover changes during the period from 1953-2008.Aerial photos were scanned, geo-referenced to the coordinate system (WGS84, projection: UTM zone 36) using a topographic map which was produced in 1978 at a scale of 1:25000 by RJGC. An image-to-image registration technique in the ERDAS imagine 9.3 software was used to geo-reference and mosaic of the 24 aerial photos for 1953, and 1978. The satellite images and other maps used in this study were projected to a common coordinate system and resampled to the same spatial resolution (60 cm). Visual interpretation of aerial photos and satellite images was enhanced to draw the land covers maps for 1953, 1978 and 2008 with ArcGIS 9.1 software. Field visits were carried out to validate the results of land cover interpretation and for description of the characteristics of each land cover class and land use. Selective sampling technique was used for this purpose.Cadastral maps that cover the study area were obtained in digital format from the Land and Survey Department (LSD), and were transformed and reclassified according to ownerships and parcel size using GIS. Land ownership was classified for each plot according to the type of ownership (Government or private land). The cadastral maps were classified according to parcel size according to the following categories: ≤0.10 ha, 0.11-0.20 ha, 0.21-0.40 ha, 0.41-1.0 ha, 1.1-2.0 ha, 2.1-3.0 ha, 3.1-5.0 ha, and >5 ha. The cadastral map (for selected villages) was overlaid with different land covers at various dates to evaluate effect of plot size on land use/land cover change.
4. Results and Discussion
4.1. Land Use/ Land Cover in 1953
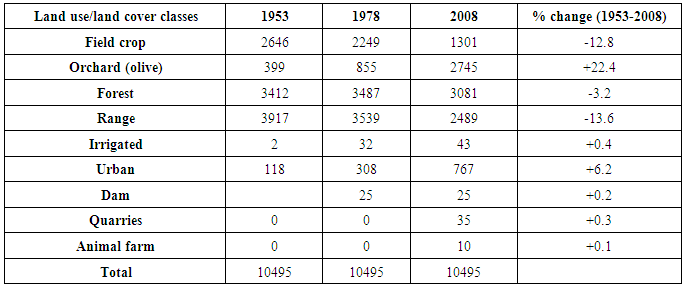
- The land use/land cover analyses of 1953 showed that 9975 ha (95% of the catchment area) was under range use, forest and field crops (Table 1). Steep, shallow, and rocky land covered about 7329 ha (70%) was not cultivated, and was covered with forest and range. Field crops were mainly cultivated on flat areas. Production of wheat, barley, and vegetables was sufficient to satisfy the need of people and the animal. Family labour and farm animals (Oxen and Horses) were used to plow the land and sow the seeds.Small areas were planted with olive trees 399 ha (3.8%). Mostly, at stream-sides protected with soil conservation measure where danger of erosion is minimum. Olive tree has long been observed as sacred, and has major agriculture importance as source of daily food and olive oil. Urban areas covered only 118 ha (1.1%).
|
4.2. Dynamics of Land Use/Cover Change during the 1953-2008 Period
- Figure 2 and Table 1 show the distribution of different land use/land covers during the periods of 1953-1978, and 1978-2008.
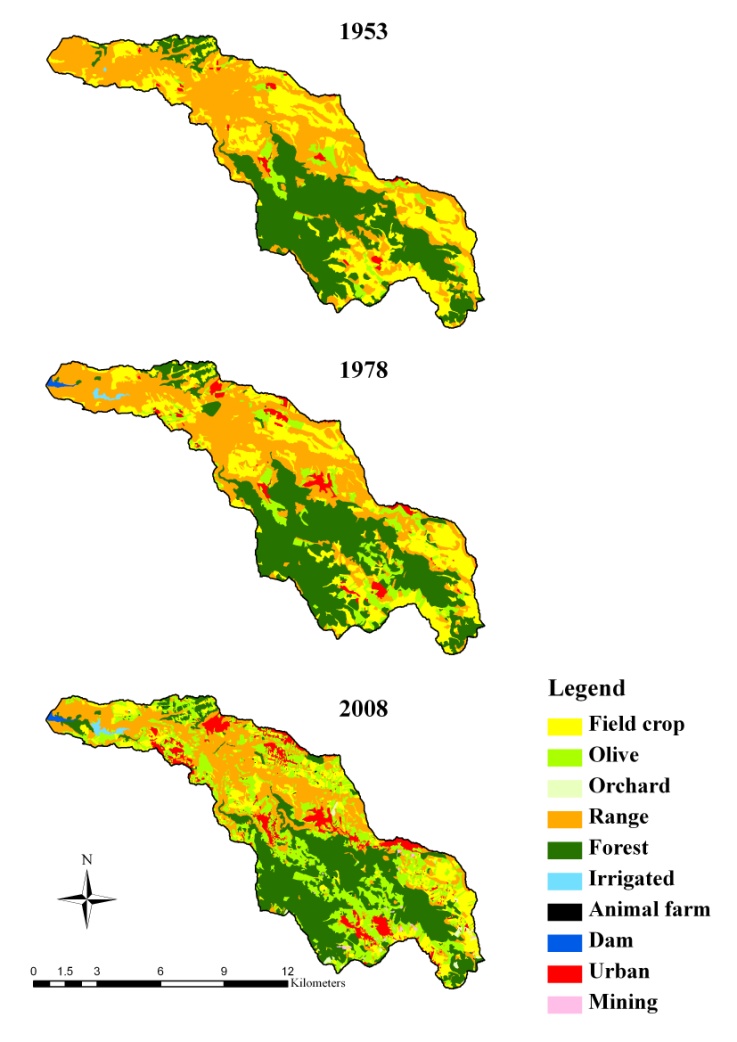 | Figure 2. Land use/land cover in 1953, 1978, and 2008 |
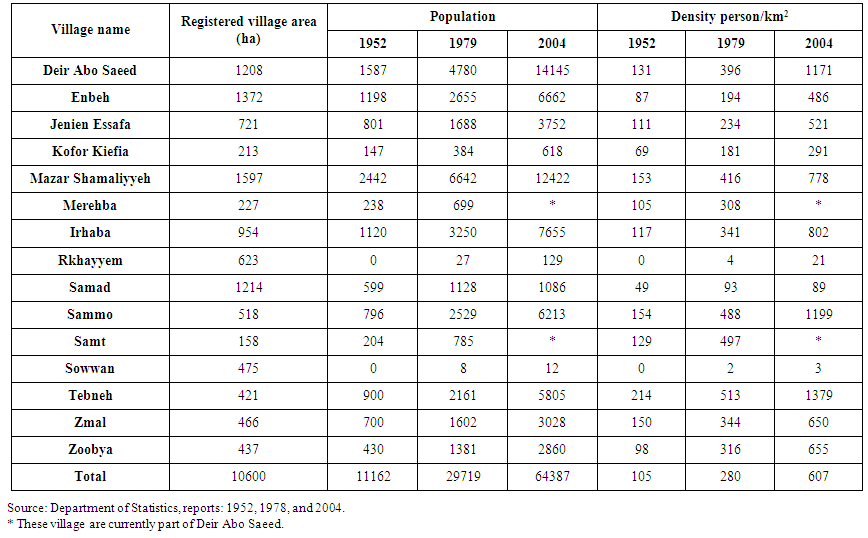 | Table 2. Distribution of population and population density for each village at different periods from 1952-2004 |
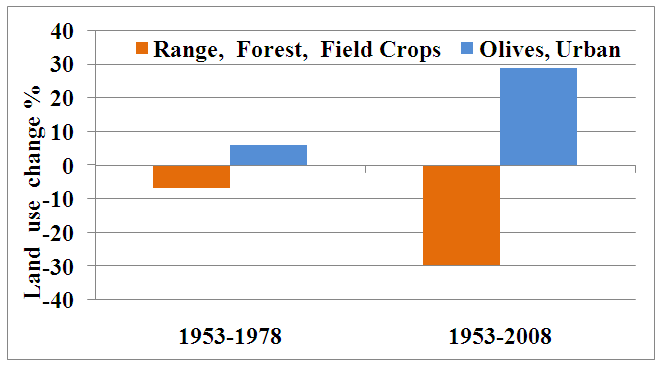 | Figure 3. Land use/land cover % change in 1953-1978, and 1978-2008 |
4.3. Population Growth
- Among the 21 villages located within the catchment, 64% of areas allocated to these villages fall within Wadi Ziqlab catchment (Figure 4).
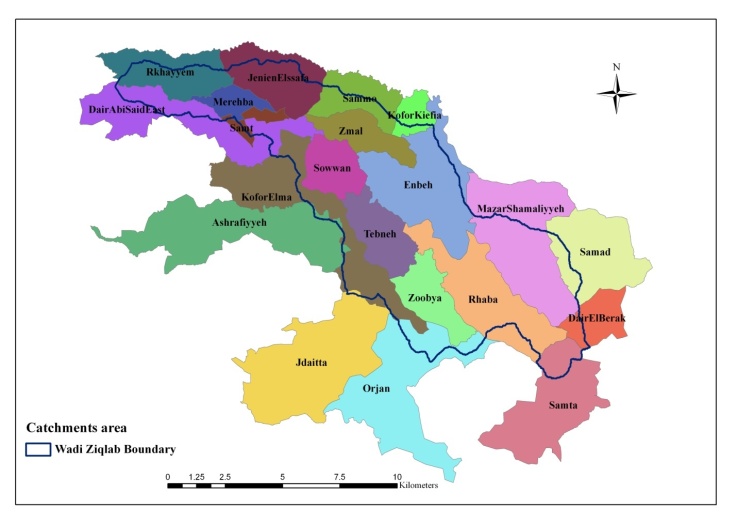 | Figure 4. Villages boundary located within WadiZiqlab catchment |
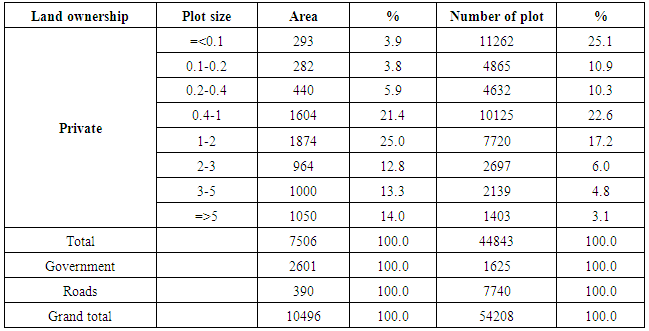
4.4. Fragmentation and Plot Size
- Generally, in Jordan, land fragmentation occurred on private land. Area of private land within the catchment is 7506 ha, or 71.5% of total area (Table 3). According to the cadastral map of 2004, private lands were classified into eight classes based on plot size.
|
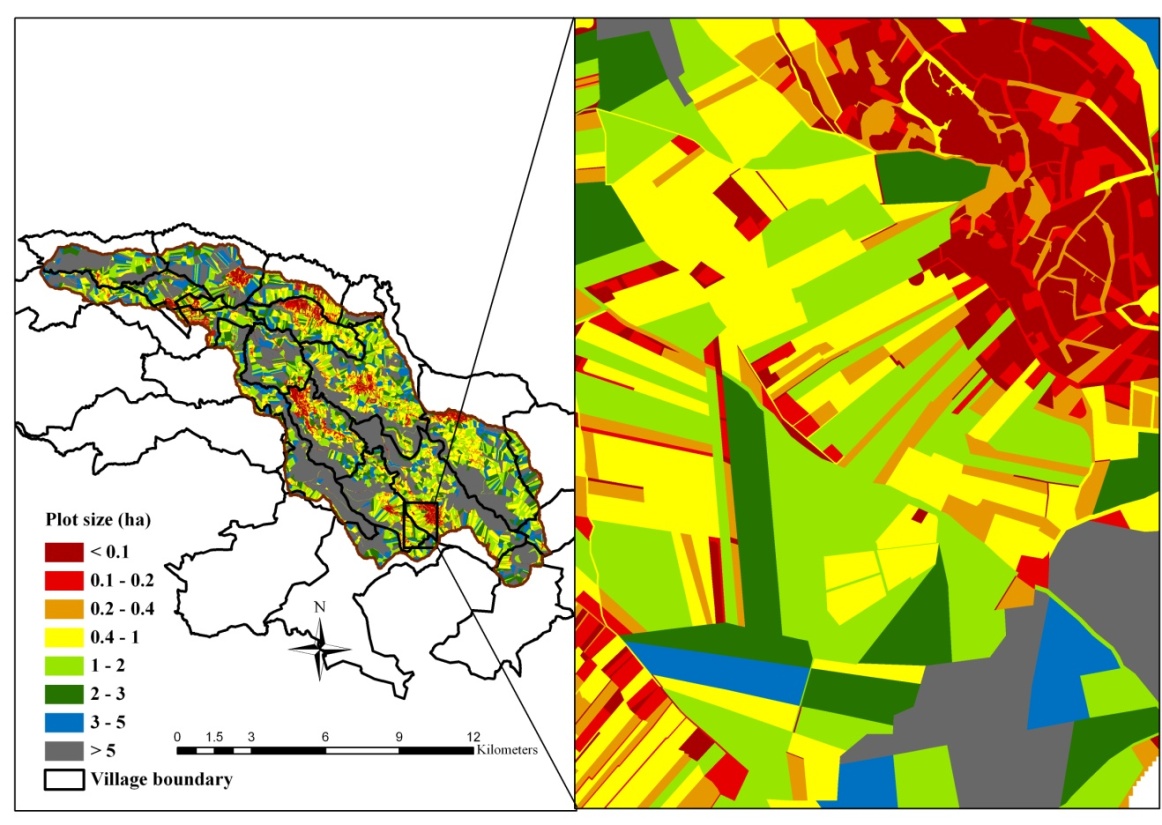 | Figure 5. Distribution of land by plot size categories (Area in hectare) |
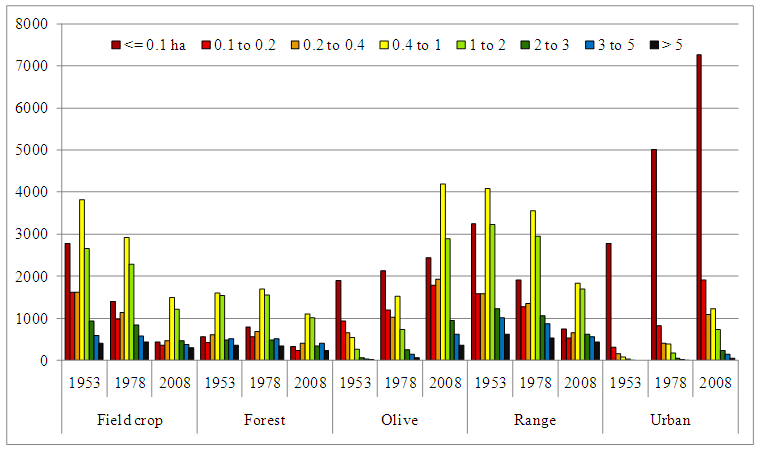 | Figure 6. Distribution of different land use/land cover with time |
5. Conclusions
- This geographical analysis between 1953 and 2008 provides a comprehensive view of land use/land cover changes, population dynamics, and land fragmentation trends in Wadi Ziqlab catchment. Major changes in land use/ land cover during this period influenced by population density show an increase in olive and urban areas on the expense of forest, rangeland and field crop cultivation. The impact of land use/land cover on land fragmentation varies according to land use situation, human needs and poor planning. Olive farms required larger plot size while urban areas expanded around villages on small plot sizes.The distressing features are that deforestation, cultivation on slope area, and land fragmentation are all leading to increased land degradation.