-
Paper Information
- Previous Paper
- Paper Submission
-
Journal Information
- About This Journal
- Editorial Board
- Current Issue
- Archive
- Author Guidelines
- Contact Us
International Journal of Applied Sociology
p-ISSN: 2169-9704 e-ISSN: 2169-9739
2013; 3(4): 76-79
doi:10.5923/j.ijas.20130304.02
Estimation of TFR, GRR, NRR, MAC, MLG and RSR of Bangladesh
 Abstract
 Reference
 Full-Text PDF
 Full-text HTML
M. Rafiqul Islam
Dept. of Population Science and Human Resource Development, Rajshahi University, Bangladesh
Correspondence to: M. Rafiqul Islam, Dept. of Population Science and Human Resource Development, Rajshahi University, Bangladesh.
| Email: |  |
Copyright © 2012 Scientific & Academic Publishing. All Rights Reserved.
The purpose of this study is to estimate TFR, GRR, NRR, MAC, MLG and RSR of Bangladesh and observe their trends during the period 1961-1991 at the census years. For this, the secondary data on age specific fertility rates (ASFRs) at the Census years 1961, 1974, 1981 and 1991 have been taken from (Islam, 2003). In this study, total fertility rate (TFR), gross reproduction rate (GRR), net reproduction rate (NRR), reproduction survival ratio (RSR), mean age of childbearing (MAC) and mean length of generation (MLG) of Bangladesh have been estimated. It is found that all fertility schedules show the traditional (reciprocal of V-shape) pattern. It is observed that TFR, GRR, NRR exhibit increasing trend during 1961-1974 and declining trend during 1974-1991. Moreover, MAC, MLG and RSR have been showing monotonically increasing trend over time.
Keywords: Age Specific Fertility Rates (ASFRs), Linear Interpolation, Life Expectancy at Birth
Cite this paper: M. Rafiqul Islam, Estimation of TFR, GRR, NRR, MAC, MLG and RSR of Bangladesh, International Journal of Applied Sociology, Vol. 3 No. 4, 2013, pp. 76-79. doi: 10.5923/j.ijas.20130304.02.
Article Outline
1. Introduction
- Total fertility rate (TFR), gross reproduction rate (GRR), net reproduction rate (NRR), reproduction survival ratio (RSR), mean age of childbearing (MAC) and mean length of generation (MLG) are actually the measures of reproductivity. These reproduction rates have been computed only from current vital statistics or any indirect technique. For this, it is to be thought that the fertility of women in, say, 30 or 35 successive years of age in the reproductive span in a single calendar year could be combined to approximate the fertility and reproductivity of a real cohort of women passing through the reproductive span (15-49 years in Bangladesh) of life. The measures of reproductivity can be used to assess the fertility behaviors of an area. Therefore, the main aims and objectives of this study are as follows:i) to study the trend and pattern of age specific fertility schedules, andii) to estimate the various measures of reproductivity and observe their trends.
2. Sources of Data
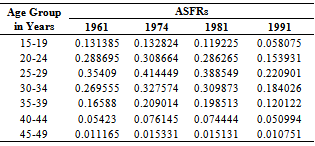
- A secondary data on ASFRs of Bangladesh at the Census years 1961, 1974, 1981 and 1991 have been taken from[4] which is shown in Table 1.
|
3. Methodology
3.1. Total Fertility Rate (TFR)
- It has been estimated using the traditional formula of
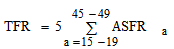 under usual assumptions from the above secondary data which can be approximated by
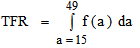
3.2. Gross Reproduction Rate (GRR)
- GRR is enumerated using the formula
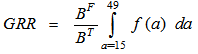 which can be approximated as
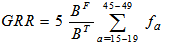 where
where  is the proportion of all births which are female and
  is the ASFRs at the age group ‘a to a +5’ in the reproductive ages. To estimate GRR, the sex ratio at birth is assumed to be 1.05 as developing country like Bangladesh[8].
3.3. Net Reproduction Rate (NRR)
- NRR is estimated using the formula
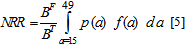 which can be approximately estimated as
 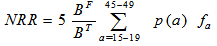 where
where  is the ASFRs at age ‘a’ or age group ‘a to a+5’ and p(a) is the probability of surviving from birth to age a. It is to be noted that to select life table female stationary population for the Census years 1961, 1974, 1981 and 1991, the
  values for the corresponding years have been taken from the Statistical Year Book of Bangladesh of 1986, 1998 and 1999. South Asian Model life tables have been chosen from United Nation’s Model Life Tables for Developing Countries[9]. It should be mentioned here that linear interpolation technique[10] has also been applied to estimate female stationary population for the years 1961, 1974, 1981 and 1991 for the corresponding life expectancy at birth.
3.4. The Mean Age of Childbearing (MAC)
- It can be expressed as
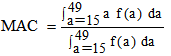 which can be approximately estimated by
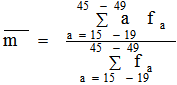 where ‘a’ represents the mid-point of each age group ‘a to a+5’ in the reproductive span of life and
  represents an ASFR in the same age group . It should be noted that in the population of high fertility, the mean age of childbearing is usually high. On the other hand, in low fertility population the mean age of childbearing is lower[6].
3.5. The Mean Length of Generation (MLG)
- MLG is defined as the mean age of mothers at the birth of their daughters. MLG has been approximately estimated applying the formula
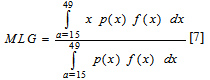 where p(x) is the probability of surviving from birth to age x and f(x) is the number of live female births to each woman of age x.
3.6. Reproduction Survival Ratio (RSR)
- It has been approximately estimated using the formula
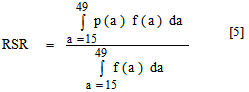 where f(a) is the ASFRs in the age group ‘a to a+5’ and p(a) is the probability of surviving from birth to age group ‘a to a+5’. The RSR is the proportion of potential reproductivity that survives the effects of mortality.
4. Results and Discussion
- To see the trend and pattern of fertility schedules, the data have been plotted in graph paper shown in Figure 1. From the figure, it is observed that all fertility schedules show the traditional (reciprocal of V-shape) pattern. It can also be observed that with passing of time the peaks of the curves are showing declining trend of fertility during 1961-1991 excepting 1961. That is, ASFRs in 1974 is higher than that of 1961 at each age in the reproductive age group. Then, ASFRs at each age strictly started to decrease during 1974-1981 slowly where as it rapidly commenced to decrease during 1981 census to 1991 census. It is observed that all these curves are unimodal. It is also found that the highest ASFRs in the age group 25-29 years were 354, 415, 389 and 221 per thousand for the years 1961, 1974, 1981 and 1991 respectively where as corresponding lowest ASFRs are 11, 15, 15, 10 in the last age group of the reproductive life respectively. From the above observations, it is found that the age interval 25-29 years is the most fertile period and the age interval 45-49 years is the least fertile period in the reproductive ages of women of Bangladesh.
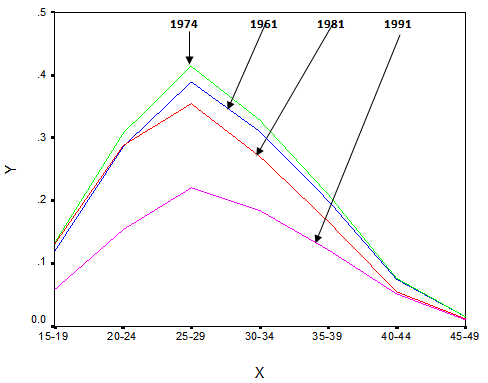 | Figure 1. The ASFRs of Bangladesh in the Census Years 1961, 1974, 1981 and 1991. X: Age Group in Years and Y: ASFRs |
|
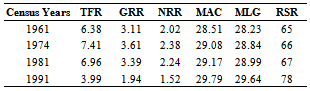
5. Conclusions
- In this study, ASFRs at the Census years 1961, 1974, 1981 and 1991 of Bangladesh show the traditional (reciprocal of V-shape) pattern and declining trend over time excepting 1961 census. The parameters TFR, GRR, NRR of reproductivity have been gradually increasing during 1961-1974 but decreasing during 1974-1991. Moreover, MAC, MLG and RSR have been monotonically increasing during the study period.