Rabab. O. Taha 1, Nagat A. M. Elmulthum 2, Haydar E. Babikir 3, Mudathir A. Ahmed 2
1Department of Planning, Ministry of Agriculture, Gezira state, Wad Medani
2Department of Agricultural Economics, University of Gezira, Wad Medani
3Department of Pediatrics University of Gezira, Wad Medani, Sudan
Correspondence to: Nagat A. M. Elmulthum , Department of Agricultural Economics, University of Gezira, Wad Medani.
| Email: |  |
Copyright © 2012 Scientific & Academic Publishing. All Rights Reserved.
Abstract
Highlighting the importance of accessibility of poor people to nutritious food, this study aimed at estimating the incidence, depth and severity of poverty in greater Wad Medani locality in Gezira state, Sudan. Data on food and non food consumption was collected by means of questionnaire from a sample of 169 households. The study was based on two income poverty lines. One is based on food consumption items that provide the recommended calories, ignoring the nutritional aspects. However, the other one is based on food consumption that considers both income and nutrition. The estimated poverty lines were used for estimation of incidence, depth and poverty in Greater Wad Medani locality, Gezira state, Sudan. The analysis was done using income and expenditure as welfare indicators. Results obtained indicated that the poverty line income estimated on the basis of caloric contents only was equal to 62.2% of the poverty line income estimated on the basis of caloric contents and nutritious food. Results obtained indicated that incidence, depth and severity of poverty were higher when we used poverty line incomes (Line one) compared with results obtained using poverty line incomes(Line two) In addition, results obtained proved that, incidence, depth and severity of poverty were higher when we used income as welfare indicator compared to results obtained when we used expenditure as welfare indicator, a results which may be attributed to the fact that people usually underestimate their incomes. Based on the above results, emphasizing the importance of nutrition and access of poor people to nutrition and recommended calories, we recommend that consumption and hence estimation of poverty line incomes to be based on food consumption items that contains essential nutrients and at the same time provide the recommended calories. In addition, polices to empower poor and vulnerable households, aiming at improving their access to nutritious food, through the provision of microfinance are highly recommended.
Keywords:
Calories, Food Baskets. Nutrition, Poverty, Gezira State, Sudan
1. Introduction
Agriculture in Sudan contributed more than 40% of GDP in the 1960s, 1970s and 1980s but declined to more than 36.2%and 35.9% in 2007 and 2008, respectively (Ahmed, 2010). In addition, agriculture provides live hood to 70 % of the population, (WHO 2006). According to (SCN, 1997) low income countries, Sudan being one of them spend a greater portion of their budget on food and are more responsive to income and food price changes than middle and high income countries. In addition, developed countries exhibit greater preference for high-value processed products as income increases. Analysis of 51 countries indicated that on average, high income countries spend 16% of their expenditures on food while low income countries spend 55%.According to Human Poverty Index (HPI), Sudan ranks 53rd among 88 developing countries. The incidence of poverty is high and there is considerable variation in poverty levels between and within states. The country suffered from socioeconomic-demographic factors, including low maternal education, poor nutrition knowledge for mothers and incorrect feeding practices for sick children that negatively affects children's health. Moreover, the civil wars add its toll.Most of the procedures for estimating the poverty line income were based on cost estimates of food baskets that constitute items common in poor people diets and at the same time provides the recommended amount of calories. [Anand and Nur 1988, Nur (1995), Ali (1994) and Baiker et all (2006)] However, the nutritional awareness of people living in developing countries is very weak. People consume calories regardless of nutritional contents of the food. In addition, because, of the low income levels people go for the cheapest kind of food. Based on the above, studies on measuring intensity and depth of poverty were based on income poverty lines calculated on the basis of caloric intake, ignoring the nutritional aspects. Elgeilani (2004) attempted to examine the prevalence of poverty and income inequality across socio economic groups in Sudan, with special emphasis on a set of interrelated factors that contribute to poverty and affect human capabilities. Hence, a reduction in the incidence of poverty as well as in its depth and severity is significantly associated with access to social services.Ali (2005) investigated the MDG of reduction of poverty by 50% halve by the year 2015 in Sudan. It is noted that poverty in the context of MDGs means the spread of poverty as measured by the head count ratio. The major results were (a) to achieve the MDG on poverty, Sudan's GDP needs to grow by an annual rate of 7.2%, requiring an investment rate ranging from 35% to 42% of GDP, (b) given Sudan's last growth performance, and assuming that Sudan will be able to sustain a GDP per capita growth rate of 2.2% (equivalent to a GDP growth rate of 5%) a reasonable horizon for reducing poverty by half would be 28 years starting from 2001, almost double the horizon implied by the MDGs.Mahran (2005) argued that “although some controversy has surrounded the level of poverty, what is indisputable about poverty in Sudan is that it has been rising over the last three decades, with adjustment and liberalization policies contributing significantly to this upward trend”.According to Elmulthum and Abdellmolla (2011) Incidence and depth of poverty during the period 1978-2000 were increasing; signifying that the ability to attain a minimal standard of living of most Sudanese population was at risk. However, the rate of increase in poverty was much more pronounced during the period 1978-1986, which witnessed the application of the IMF policy package. In addition, further hardship was observed during 1990’s which might be attributed to liberalization of all prices including basic food items. A significant reduction of poverty measures was observed during the period 2000-2009, which might be attributed to the relative stability of prices and exchange rate. This paper aimed at estimating incidence and depth of poverty in greater Wad Medani, locality in Gezira state, Sudan. Estimates of poverty line incomes and hence poverty indices will be based on nutritional and caloric contents of food.
2. Methodology
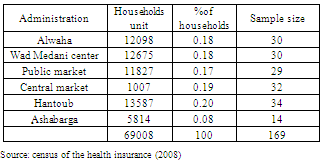
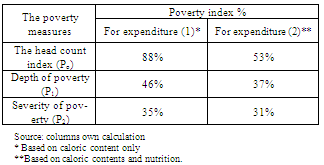
The study was conducted in greater Wad Medani locality, Gezira State in Sudan. Gezira state consists of six administrative units. Namely Alwaha, Wad Medani centre, Public market, Central market, Hantoub and Alshabarga. The total number of household of greater Wad Medani locality in the year 2008 was estimated at 69008 households. The households’ guardians enrolled are mainly engaged in agricultural, trade and as employees in public services.The study was based on primary data collected by means of questionnaire from a random stratified sample designed to provide statistical information on households. The sample size (N) is determined by using the following formula: | (1) |
where (N) is sample size, P is prevalence of phenomena in the population, Z is critical value, D statistical precision. P is assumed to be (0.05), putting Z, D as 1.96 and 0.075 respectively. A sample size of 169 households was set.The total sample size was distributed between the administrative units of the study area according to the population proportion in each unit as shown in table (1).Table 1. Distribution of sample according to administrative unit in greater Wad Medani locality, 2008
 |
| |
|
Data were then collected on the variables of interest, which include income and expenditure on, food and non food items. For the purpose of calculating the poverty indices a poverty line income was calculated based on nutritional requirements. Based on Sukkar (1985) eleven food baskets were constructed from which four baskets were selected on the basis of nutritional requirements and costs. These four baskets include alternative food baskets for children (0-9) years, males (10-19) years, females (10-19) years and above (20) years for males and females. The constructed baskets composed of items which contain the necessary requirements of carbohydrates, proteins, fats and vitamins and at the same time provide the recommended calories for each age group. Appling (2010) prices on the nutritional consumption items of the selected basket we obtained the cost of each food basket. The average cost of these baskets was used as the minimum cash requirement for nutritious food consumption. Multiplying the minimum cash requirement for nutritious food consumption by a conversion factor of 2, the minimum cash requirement for nutritious food and non food consumption namely the poverty line, for Greater Wad Medani locality for the year 2010 was obtained. It may be noted that the conversion factor 2 was based on the average percentage of income devoted for nutritional food consumption (50%) calculated from the collected data. The data collected was tabulated and analysed using statistical package for social science (SPSS).The estimated poverty indices include the following: Head count index which measures the incidence of poverty is given by: | (2) |
Whereq = number of poor below the poverty line.n = total number of people in the community.Poverty gap index (P1) which measures the depth of poverty is given by the following specifications:  | (3) |
WhereZ= the poverty line.y= average income of the poor people Severity of poverty (P2) is given by the following specification: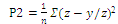 | (4) |
The calculation of poverty line was based on the estimation of the nutritional requirements coupled with caloric requirements for different age groups.
3. Results and Discussions
Results pertaining to the head count index, depth of poverty, and severity of poverty will be discussed. The constructed baskets (table 2) represent consumption alternatives for children (0-9) years, males (10-19) years, females (10-19) years and adults of both above 20 years. Based on Elmulthm (2007), these baskets would yield on average the recommended level of calories for each sex group which is equal to 1550 k.cal for children (0-9) years, 2857 k.cal for males (10-19) years, 2383 k.cal for females (10-19) years and 2600 k.cal for adults above 20 years (table 2).The per capita cost of each basket per day was obtained by applying 2010 prices on the selected baskets. The estimated per capita costs of the four basket were equal to SDG 6.408 for basket (1) for children from (0-9) years, SDG 7.315 for basket (2) for males from (10-19) years, SDG 7.086 of basket (3) for females from (10-19) years and SDG 7.107 of basket (4) for males and females above (20) years. The four baskets yield the recommended level of calories depending on age-sex caloric requirements (Elmulthum 2007). The average per capita cost of the four nutritional baskets was equal to SD 6.9785 per day, SD 209.355 per month. The per capita income poverty line for 2010 which was equal to SD 418.71 was obtained by multiplying the cost of the basic food items by a conversion factor of 2 based on the average expenditure on food. It may be noted that the conversion factor 2 was based on the average percentage of income devoted for food consumption (50%) calculated from the collected dataFor the purpose of calculating the income poverty line for a household, the per capita income poverty line for food and non food consumption was multiplied by the average family size which is equal 5, based on data collected. Hence the household income poverty line for the greater Wad Medani for the year 2010 in Gezira state was equal to SDG 2093.55. For the purpose of comparing poverty indices estimated on the basis of poverty line incomes considering nutrition and caloric intake with poverty indices using poverty line based on caloric intake only we re-priced Nur 1995 consumption baskets using 2010 prices. The cost of Nur 1995 basket was then multiplied by a conversion factor of 2 to obtain the per capita income poverty line based on caloric intake. To obtain the income poverty line for a household the per capita income poverty line for food and non food consumption was multiplied by the average family size which is equal to 5. Hence, the household income poverty line for the re-priced Nur 1995 baskets, which was based on caloric content only for the Greater Wad Medani in Gezira State was equal to SDG 1303.2 which is 62.2% of the poverty line estimated above on the basis of caloric contents and nutritious food. Results obtained proved that the average income of the households in Greater Wad Medani Locality was equal to 756 SDG which is only 36% of the income poverty line computed considering nutrition and caloric content of the food consumed.Table 2. Contents of nutritional food baskets for different age groups
 |
| |
|
Applying the estimated poverty lines computed above to income distribution data of the surveyed sample, the incidence of poverty was able to be estimated by measuring the head count index, depth of poverty measured by the poverty gap index and severity of poverty measured by Foster Greer and Thorbecke index. In particular, poverty indices were calculated using poverty lines computed on the basis of caloric content only and on the basis of nutritious food and caloric intake. Table (3) below shows the results related to incidence, depth, and severity of poverty, using two poverty line incomes. Income (1) was obtained on the basis of caloric content of food which was obtained by re-pricing Nur 1995 food baskets. On the other hand income (2) was calculated on the basis of nutrition and caloric content of food Table 3. Head-count index (H), Depth of poverty (P1) and Severity of poverty (P2)
 |
| |
|
From table (3) above it is clear that the head count index using income approach was equal to 92% compared to 58% obtained by re-pricing Nur (1995) using 2010 prices. The above result indicated 58% of the households were below the poverty line when we apply the poverty line based on re-priced Nur (1995) baskets. However, results obtained, indicated that applying nutritionally based poverty line, 92% of the households were below the poverty line. Moreover, the depth and severity of poverty using income approach was equal to 59% and 57% respectively compared to a lower result of 43% and 38% respectively obtained by using Nur (1995) re-priced baskets.Table 3. Head-count index (H), Depth of poverty (P1), and Severity of poverty (P2)
 |
| |
|
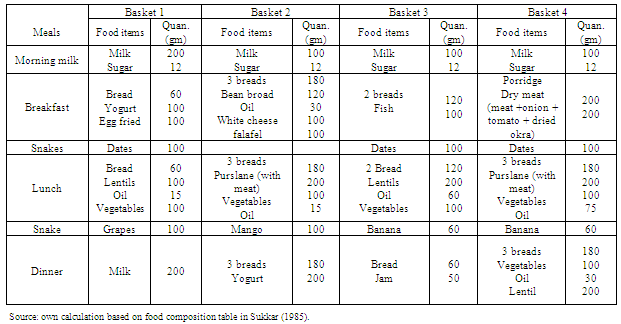
Using expenditure as welfare indicator, results obtained showed that 88% of households were below the poverty line compared with 53% obtained by re-pricing Nur (1995) using 2010 prices. Moreover, the depth and severity of poverty using expenditure as welfare indicator were equal to 46% and 35% respectively using poverty lines based on nutrition and caloric content. The comparable figures for poverty line incomes were equal to 37% and 31% respectively, obtained by re-pricing Nur (1995) baskets. It is clear from the above results that incidence, depth and severity of poverty were higher when we used income as welfare indicator compared to results obtained when we used expenditure as welfare indicator. The above results may be attributed to the fact that people underestimates their income.The above results indicated that, based on poverty lines that considers only the caloric content of the food consumed, poverty indices were lower when both income and expenditure as welfare indicator were used, compared with results obtained using poverty line incomes, that considers both nutrition and caloric content of the food. This may be attributed to the fact that nutritional consumption of food which is necessary to health and capability of people to contribute to development and growth requires higher levels of income and expenditure compared with consumption which is based only on caloric content of food. Based on the above results, to give real estimates of poverty indices it is recommend that consumption and hence estimation of poverty line incomes to be based on food consumption items that contains essential nutrients and at the same time provide the recommended calorie. In addition, the researchers highly recommend polices to empower poor and vulnerable households, aiming at improving their access to nutritious food, through provision of microfinance.
References
| [1] | Ali, A.A.G. (1994): Structural Adjustment Programs and Poverty in the Sudan (in Arabic), Arab Research Center, Cairo |
| [2] | Ali, A.A.G. (2005). Can the Sudan Reduce Poverty by Half by the Year 2015?www.arab-api.org/cv/aali-cv/aali/wps0304.pdf. |
| [3] | Annand, V.K. and E.M. Nur (1988): “The Absolute Poverty Line in the Sudan; Estimates and Analysis” The Asian Economic Review xxx, no3: 357-383. |
| [4] | Babiker, K., Elmulthum, N.A. and Ahmed, M.A.,(2010) "Assessment of poverty among employees of the University of Gezira : an empirical investigation 2006, Gezira Journal of Agricultural Sciences: 8(1):1-11. |
| [5] | Elmulthum, N.A. (2007):"A National Nutritional Food Security Index for the Sudan".pp 364-367 In Proceedings of TWOWS Third General Assembly and International Conference: Women's Impact on Science and technology in the new Millennium. 21-25 November 2005 Banglore, India, 21-25 November 2005. |
| [6] | Elmulthum, N.A and Abdelmawla M. A (2011)“ Availability and Accessibility to Food as Pillars of Food Security in Sudan” presented at Food Security and Poverty alleviation under changing enviromental conditions: Challenges and Opportunities in Sudan, Khartoum, Sudan. |
| [7] | Fadllalla, A.E. (2004).Poverty and Inequality in Sudan: An Analysis of Household Data 2000. Ph.D Thesis, Department of Economics University of Gezira Sudan. |
| [8] | Mahran. H. A. (2005). Public Policy and Poverty Reduction in Sudan. 1971-2002. www.cmi.no/Sudan/doc/ |
| [9] | Nur. E. M. (1995). Poverty in Sudan in 1992, with and without coping practices, Research report presented to social solidarity fund, Sudan |
| [10] | Sukkar, M, Y,. (1985). Human Nutrition Biddles Guildford, London, UK |
 Abstract
 Reference
 Full-Text PDF
 Full-Text HTML