-
Paper Information
- Paper Submission
-
Journal Information
- About This Journal
- Editorial Board
- Current Issue
- Archive
- Author Guidelines
- Contact Us
International Journal of Applied Psychology
p-ISSN: 2168-5010 e-ISSN: 2168-5029
2025; 15(3): 82-98
doi:10.5923/j.ijap.20251503.03
Received: Dec. 2, 2025; Accepted: Dec. 19, 2025; Published: Dec. 22, 2025

Psychometric Evaluation of the Ktiri-Stimuli Diagnostic Tool (Ktiri-SDT) for the Assessment of Cumulative Stress and Relaxation in Moroccan Adults: A Pilot Study
 Abstract
 Reference
 Full-Text PDF
 Full-text HTML
Ktiri Fouad
Higher Institute of Nursing Professions and Health Techniques, Rabat, Morocco
Correspondence to: Ktiri Fouad, Higher Institute of Nursing Professions and Health Techniques, Rabat, Morocco.
| Email: |  |
Copyright © 2025 The Author(s). Published by Scientific & Academic Publishing.
This work is licensed under the Creative Commons Attribution International License (CC BY).
http://creativecommons.org/licenses/by/4.0/

Objective: This study presents a pilot evaluation of the Ktiri-Stimuli Diagnostic Tool (Ktiri-SDT) and its preliminary validation within a Moroccan sample. Grounded in the updated Tri-Transactional Theory of Stress (Tri-TTS), the Ktiri-SDT provides an ecologically valid, predictive, and operational model for assessing cumulative stress and relaxation, and for exploring their interaction to understand an individual’s week-to-week lived experience. This work examines the tool’s feasibility, clarity, and potential clinical relevance. Methods: A cross-sectional pilot study was conducted with a purposive–convenience sample of adult participants aged 18 years or older. The study evaluated the tool’s feasibility, face and content validity, and convergent validity through correlations with the Perceived Stress Scale (PSS-4) and the WHO-5 Well-Being Index. The Ktiri-SDT captures cumulative periods of stress and relaxation experienced over a representative week, reflecting activities and thoughts regularly repeated over the preceding weeks. It distinguishes between positive and negative stimuli and integrates the frequency, duration, and perceived effect (PE) of activities, intrusive thoughts, sleep, and wakefulness quality (PSS). Results: The pilot study included 29 adults (9 females, 20 males) aged 24 to 67 years (M = 45.79, SD = 11.38) working in the health, education and public administration sectors. All participants completed the Ktiri-SDT, assessing weekly activities, intrusive thoughts, sleep, and wakeup quality, as well as the PSS-4 and WHO-5 Well-Being Index. The Ktiri-SDT was well accepted, with good face and content validity. The Ktiri-SDT score (Stress Power, SP) was correlated negatively with the PSS-4 (r = -0.848, p < .001) and positively with the WHO-5 (r = 0.786, p < .001), consistent with SP scoring, where negative values reflect stress and positive values reflect relaxation. SP and Awakening quality (PSS) significantly predicted Sleep Quality, explaining 63% of the variance, providing a second empirical confirmation of the Tri-Transactional Theory of stress. Conclusion: The Ktiri-SDT is a feasible, valid, and user-friendly tool for assessing individualized stress and relaxation patterns over a representative week, capturing both duration and perceived effect of activities and thoughts. Its potential applications for interventions and research are discussed in detail in the main text. Further large-scale studies are needed to confirm its robustness and applicability across diverse populations.
Keywords: Tri-Transactional Theory of Stress, Ktiri-SDT, Cumulative stress and relaxation, Sleep quality, Awakening quality, Pilot study
Cite this paper: Ktiri Fouad, Psychometric Evaluation of the Ktiri-Stimuli Diagnostic Tool (Ktiri-SDT) for the Assessment of Cumulative Stress and Relaxation in Moroccan Adults: A Pilot Study, International Journal of Applied Psychology, Vol. 15 No. 3, 2025, pp. 82-98. doi: 10.5923/j.ijap.20251503.03.
Article Outline
1. Introduction
1.1. Standardized Scales
- Over the past decades, various psychological theories have shaped our understanding of stress and its impact on health. Notable examples include Cannon’s theory [1], Selye’s General Adaptation Syndrome [2], the Holmes and Rahe life events model [3], the transactional model by Folkman and Lazarus [4], and the Tri-Transactional Theory of Stress (Tri-TTS) [5] [6] [7].Based on these foundational models, numerous stress assessment scales have been developed and validated across cultures. For instance, the Social Readjustment Rating Scale is grounded in the life events theory [3], while tools like the Perceived Stress Scale [8] and the Perceived Stress Questionnaire [9] are derived from Lazarus’s cognitive-appraisal framework [10] [11], later expanded into a comprehensive coping model [4].Standardized stress scales typically use a fixed set of predefined items, and an individual's total stress score is calculated by summing the values assigned to their responses.
1.2. Adaptive Stress Scales
- In recent years, adaptive stress scales have emerged to assess psychological well-being in clinical contexts by selecting items dynamically based on prior responses. This approach integrates Item Response Theory (IRT)—a framework that models the relationship between latent traits and item responses—and Computerized Adaptive Testing (CAT), which builds on IRT to select the most informative items while minimizing test length [12] [13] [14]. These methods allow for efficient and personalized assessment with high measurement precision. A notable example is the PROMIS Pediatric Psychological Stress Experiences item bank, administered via CAT to provide accurate, low-burden evaluations of perceived stress [15]. In such systems, individual trait estimates are updated after each response, and items are administered until a predefined precision threshold is met, at which point the test ends [16].
1.3. Daily Diary and EMA Approaches
- Alongside adaptive testing, other stress assessment methods include daily diary reports and Ecological Momentary Assessment (EMA), which capture stress in naturalistic settings. Daily diaries typically involve once-daily recall of stressors, while EMA collects data multiple times a day in real time [17]. Over the past two decades, EMA—known for its in-the-moment assessments—has gained popularity in psychological research [18]. Instruments like the Daily Stress Inventory (DSI), which lists 58 predefined stressors, and the Daily Inventory of Stressful Events (DISE), which allows for both structured and open-ended responses, are commonly used in diary formats [19] [20]. In EMA studies, participants often report their current stress levels several times daily via smartphone apps, providing a more detailed picture of stress fluctuations. Although these methods offer strong ecological validity, they rely on fixed item sets and do not adapt to individual differences in exposure to positive or negative stimuli.
1.4. Gaps in Current Stress Measurement
- Despite substantial progress in stress research, significant gaps remain in how stress is measured.First, no standardized tool directly assesses the types of stressors individuals habitually face—such as ongoing work pressure, commuting difficulties, or persistent interpersonal tension. Although tools like the Life Events and Difficulties Schedule (LEDS) assess chronic challenges, including financial strain or caregiving [21] [22], stress evaluations are conducted by interviewers and do not produce composite scores [23], limiting their ability to reflect subjective burden.Second, most tools overlook the duration of stressors when evaluating their impact. For instance, while LEDS documents the length of stressful events, it does not combine this with severity. Similarly, instruments like the Daily Stress Inventory (DSI) assess perceived intensity but ignore how long stressors last. This results in a limited understanding of cumulative stress exposure.Third, most current stress assessment tools fail to integrate positive and negative stimuli. Instruments like the PANAS [24] and the Brief Resilience Scale [25] assess emotional tone or resilience traits but are typically disconnected from the real-world stressors that provoke emotional responses. Consequently, they overlook how both positive (e.g., social support, restorative sleep) and negative (e.g., conflict, job strain) stimuli shape emotional outcomes in daily life.
1.5. A New Tool for Stress Assessment Based on the Tri-Transactional Theory of Stress
- Based on the updated Tri-Transactional Theory of Stress [7], which introduced the Ktiri-stress and Ktiri-stress accumulation equations, I developed the Ktiri-Stimuli Diagnostic Tool (Ktiri-SDT), a next-generation instrument for stress assessment. The Ktiri-SDT addresses major limitations in existing tools by avoiding predefined item sets and focusing instead on recurring real-life stressors reported by individuals—such as workplace tensions or daily commuting. It models both the severity and duration of these experiences, while also capturing the interaction between positive and negative stimuli. Unlike traditional fixed or adaptive tools, the Ktiri-SDT provides an individualized, ecologically valid profile of cumulative stress exposure.
1.6. Aim and Objectives
- The aim of this empirical study is to evaluate the feasibility and preliminary validity of the prototype Ktiri-Stimuli Diagnostic Tool (Ktiri-SDT). Specifically, this pilot study seeks to determine whether the prototype can be effectively implemented, generate meaningful data, and provide ecologically valid insights into cumulative stress.The specific objectives are to:1. Examine the face and content validity of the prototype Ktiri-SDT.2. Assess its convergent validity using two established instruments: the Perceived Stress Scale (PSS-4) and the World Health Organization Well-Being Index (WHO-5).3. Evaluate the feasibility and acceptability of the prototype in real-life contexts.4. Explore the utility of the prototype in identifying individual patterns of cumulative stress exposure and its potential for personalized stress assessment.
2. Materials and Methods
2.1. Study Design
- This study employed a cross-sectional pilot design. This approach allowed for immediate feedback on the comprehensibility and relevance of the instrument’s content, informing refinements prior to larger-scale application. The design was selected to evaluate the feasibility, clarity, and acceptability of the instrument in a real-world context. At this stage, establishing validity was not the focus, as the study served as an initial pilot investigation.
2.2. Participants / Sample
2.2.1. Sampling Method
- A purposive-convenience sampling approach was adopted, with participants recruited from readily accessible contacts. Convenience sampling was chosen because it is suitable for pilot studies: it allows timely recruitment, facilitates testing of a new or adaptive instrument, and enables assessment of face and content validity, usability, and clarity. This approach also allows rapid evaluation of the instrument’s functionality and instructions, helping to identify issues before a larger-scale study. Although the sample was not representative, including participants with diverse backgrounds captured a range of characteristics. While convenience sampling may introduce selection bias and limit generalizability, it was considered appropriate for the exploratory objectives of this pilot study.
2.2.2. Sample Size and Rationale
- The sample size was intentionally small, as the primary aim was to assess feasibility, clarity, and acceptability rather than generalize findings. Pilot study recommendations vary, with some suggesting more than 30 participants per group, while others indicate that as few as 12 may be sufficient [26] [27]. Such studies are not designed for hypothesis testing, and sample sizes are therefore often not formally determined [27]. A review of 761 UK-based pilot and feasibility studies conducted between 2013 and 2020 reported a median target sample size of 30 participants, with slightly larger numbers for trials with binary outcomes or studies labeled as both pilot and feasibility trials [28].
2.2.3. Demographics
- The participant group comprised men and women with diverse ages, educational backgrounds, occupations, and cultural contexts.
2.2.4. Inclusion Criteria
- Participants were eligible for inclusion if they:1. Were 18 years of age or older.2. Demonstrated sufficient comprehension to understand the content and instructions presented by the adaptive instrument.3. Were able to engage with the adaptive system and complete all tasks required for the pilot study.4. Reported having a relatively stable weekly routine, enabling consistent assessment of stressors and positive stimuli.
2.2.5. Exclusion Criteria
- Participants were excluded if they:1. Had a cognitive or physical impairment that limited their ability to complete the adaptive instrument.2. Experienced a severe acute psychiatric or medical condition that could interfere with participation or data reliability.
2.3. Ethical Considerations
- Participants were informed that their weekly activities and thoughts would remain confidential and that only aggregated, non-identifiable data would be reported. All participants provided oral informed consent prior to participation.
2.4. Scale Prototype
- This section presents the Ktiri-Stimuli Diagnostic Tool (Ktiri-SDT). A brief summary of the original prototype is provided, followed by the modifications implemented in the current pilot study.
2.4.1. Original Prototype
2.4.1.1. The stimuli Diagnostic Tool
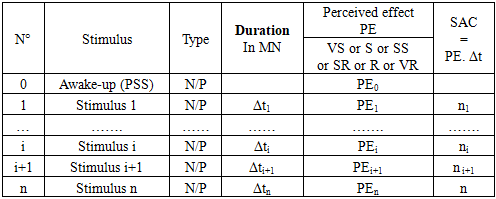
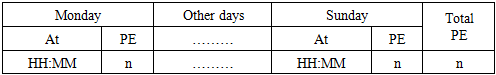
- The original Ktiri-SDT prototype [7], developed from the updated Tri-Transactional Theory of Stress, was designed to capture participant-specific positive and negative stimuli that recur in daily life. Its main features and structure are presented in Appendix Table 1.The prototype begins with the AWAKE-UP item, which reflects stress upon waking and represents the individual’s baseline daily stress (PSS) in accordance with the Tri-TTS model. Participants then report recurring activities or thoughts classified as positive or negative stimuli, each described by its duration (Δt), perceived effect (PE), and accumulated stress (SAC = PE × Δt). PE values range from –3 (very stressful) to +3 (very relaxing), allowing the tool to incorporate both negative and restorative experiences.Two formats of the tool were initially proposed: the Daily Stimuli Diagnostic Tool (Ktiri-DSDT), focusing on day-level events, and the Weekly Stimuli Diagnostic Tool (Ktiri-WSDT), assessing experiences across a representative week.
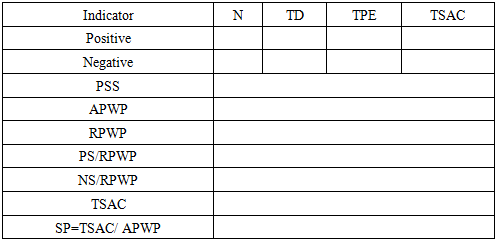
2.4.1.2. The KTIRI-Stimuli Diagnostic Outcomes
- After administering the Ktiri-SDT, Ktiri-DSDT, or Ktiri-WSDT, the main outcome variables are computed as shown in Appendix Table 2. These include the number of positive and negative stimuli (N), total active time (TD, minutes), total perceived effect (TPE), and total stress accumulation (TSAC), calculated separately for positive and negative stimuli.Additional indicators include the perceived stress state upon waking (PSS), the absolute post-wakeup period (APWP; time from waking to bedtime), the relative post-wakeup period (RPWP; total duration of stimuli), and the proportions of positive (PS/RPWP) and negative (NS/RPWP) stimuli. The combined TSAC value is used to compute stress power (SP = TSAC / APWP), which reflects cumulative stress relative to the individual’s available waking period.
2.4.2. The Updated Prototype
2.4.2.1. The Stimuli Diagnostic Tool
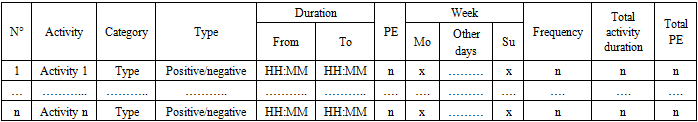
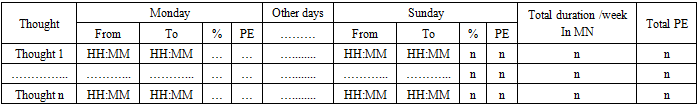
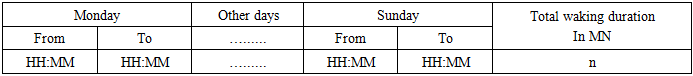
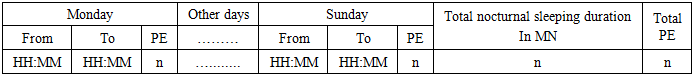
- The tool was refined iteratively during early data collection based on participant feedback, and the updated version was re-administered to ensure consistency for reliability and convergent validity analyses. Structural and procedural modifications improved clarity, feasibility, and user comprehension.Because the daily version (Ktiri-DSDT) proved impractical, the weekly format (Ktiri-WSDT), referred to hereafter as the Ktiri-SDT, was adopted to capture all recurring stimuli experienced over a representative week.In the updated prototype, participants reported several categories of week-level variables:- Week-time activities (activity, category, type, duration, perceived effect, frequency) (Appendix Table 3),- Positive and negative thoughts (thought, duration proportion, PE, frequency) (Appendix Table 4; corresponding scale in Section 2.5.5),- Daily wakefulness duration (minutes) (Appendix Table 5),- Nocturnal sleep duration and sleep quality (PE) (Appendix Table 6; corresponding scale in Section 2.5.6),- Morning stress at awakening (PSS) (Appendix Table 7; corresponding scale in Section 2.5.7).
2.4.2.2. The Ktiri-Stimuli Diagnostic Outcomes
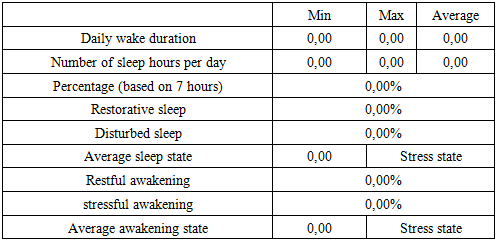
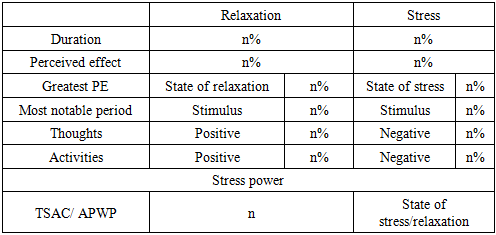
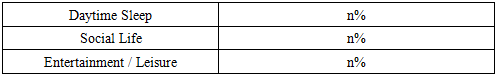
- The updated Ktiri-Stimuli Diagnostic Outcomes (Ktiri-SDO) are organized into three separate tables, replacing the single table used in the original prototype. These include:1. Outcomes related to wakefulness, nocturnal sleep, and morning awakening (Appendix Table 8),2. Outcomes related to relaxation and stress (Appendix Table 9),3. Outcomes summarizing key anti-stress moments (Appendix Table 10).Appendix Table 8 presents total hours awake, sleep duration, the proportion of restorative versus disturbed sleep, and average morning stress, offering an overview of participants’ sleep quality and stress upon waking.Appendix Table 9 summarizes participants’ activities and thoughts, showing the percentage of time spent in relaxation and stress periods relative to wakefulness, their perceived effects, the most notable stimulus (activity or thought) for each, the highest perceived effect of stress and relaxation, and the percentages of positive and negative activities and thoughts. The “stress average per minute” (or “stress power”) indicates the participant’s average stress level across the week, corresponding to the KTIRI-SDT score (see Section 2.4.1.2.).Appendix Table 10 presents the importance participants assign to three key stress-reducing factors—daytime sleep, social life, and leisure activities—expressed as percentages relative to wakefulness. These values help identify areas where individuals may be under-engaging in restorative behaviors. Together, these outcomes offer an overview of how stressful or restful a participant’s weekly experience is and guide personalized recommendations to decrease negative stimuli or enhance positive ones.Empirical evidence supports the relevance of these factors. Daytime naps can reduce perceived stress and restore cognitive performance [29,30]. Social engagement is associated with lower stress and improved well-being [31]. Physical activity and leisure pursuits also reduce stress by lowering physiological stress markers, enhancing mood, and increasing resilience to daily stressors [32,33].
2.5. Instruments
- Two standardized measures were used to assess convergent validity: the Perceived Stress Scale–4 item (PSS-4) and the WHO-5 Well-Being Index. Face and content validity of the Ktiri-SDT were evaluated using two brief questionnaires assessing clarity, relevance, and comprehensibility (see Sections 2.5.3.1 and 2.5.3.2). Ktiri-SDT scores (stress power) were expected to correlate negatively with the PSS-4 and positively with the WHO-5, consistent with the scoring system where negative values indicate stress and positive values indicate relaxation.
2.5.1. Perceived Stress Scale 4 Item (PSS-4)
- The PSS-4 is a brief and widely used measure of perceived stress, assessing the extent to which situations are appraised as unpredictable, uncontrollable, or overwhelming. It includes four Likert-type items (score range: 4–20), with higher scores reflecting greater stress. Despite its brevity, it shows acceptable reliability and validity across populations, making it suitable for time-limited research and clinical use [8] [34,35]. Its items come from the PSS-10, previously validated in Moroccan samples, supporting cultural relevance [36–38].
2.5.2. WHO-5 Wellbeing Index
- The WHO-5 is a brief questionnaire assessing current subjective well-being. It includes five positively worded items rated on a six-point Likert scale, with higher scores indicating greater well-being. Developed by the World Health Organization [39], the WHO-5 has shown good reliability and validity across diverse cultural contexts and is available in Arabic [40–42].
2.5.3. Face and Content Validity Questionnaires
- Face and content validity were assessed to ensure the quality and accuracy of the instrument. These evaluations verify that the tool is clear and relevant to respondents and that it adequately represents the construct being measured.
2.5.3.1. Face Validity
- Face validity refers to how clear, relevant, and appropriate a test appears to respondents, supporting engagement and high-quality data, whereas poor face validity can reduce understanding and response accuracy [43]. It is typically evaluated with the target population through interviews, focus groups, or rating scales in which participants judge the clarity, relevance, and difficulty of the instrument [43]. The interview questions were organized into five key categories (see Appendix A. Face Validity Interview Questions).
2.5.3.2. Content Validity
- Content validity refers to how well a measurement instrument represents the construct it is intended to measure. It ensures that the tool is relevant, comprehensive, and understandable, capturing all essential aspects without including unnecessary content; poor content validity can lead to misleading results in patient-reported, clinician-reported, performance-based, and imaging measures [44].It is typically evaluated through qualitative methods such as focus groups, interviews, or Delphi procedures. New instruments are assessed for relevance, comprehensiveness, and comprehensibility, while existing tools are evaluated on all three aspects simultaneously, with revisions made when deficiencies are identified [44]. The evaluation criteria and corresponding questions were organized into the following categories (see Appendix B. Content Validity Interview Questions).
2.5.4. Ecological Validity
- The Ktiri-SDT was designed to capture stress and relaxation as they naturally occur over a representative week, enhancing its ecological validity. Participants reported the actual stressors and positive stimuli they experienced during this period, including emotional, social, and environmental events. By relying on real experiences rather than hypothetical scenarios, the instrument provides a more accurate and individualized representation of cumulative stress exposure and recovery.
2.5.5. Assessment of Intrusive Thoughts
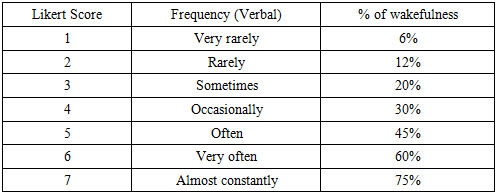
- A stimulus is any internal or external factor perceived as beneficial or harmful by the nervous system [7]. Intrusive thoughts are a type of internal stimulus—recurrent cognitions or images that enter consciousness spontaneously and may be negative, neutral, or positive. Their content and frequency influence emotional states and coping, making their assessment important for understanding cognitive contributions to stress and relaxation.Intrusive thoughts were measured using scales inspired by the Yale–Brown Obsessive–Compulsive Scale [45]. Participants estimated the percentage of wakefulness during which each thought occurred (see Appendix Table 11) and rated its perceived effect (PE) from –3 (very stressful) to +3 (very relaxing), allowing quantification of both frequency and emotional impact.Justification of the Adapted ScaleThis approach adapts the Y-BOCS method of rating obsessions by time occupied into a quantitative percentage of waking time [46,47]. The 75% upper limit reflects that intrusive thoughts seldom dominate the entire day. Expanding the scale from five to seven points increases precision, and the –3 to +3 perceived-effect (PE) ratings capture the emotional impact of thoughts, enabling a multidimensional assessment of cognitive intrusiveness and stress.Coexistence of Multiple ThoughtsHuman cognition often involves overlapping mental contents rather than a single continuous thought stream. Research shows that individuals may attend to several ideas simultaneously [48,49], and neuroscientific evidence indicates that different thought types recruit overlapping brain networks, including the medial prefrontal cortex [50]. This supports assessing both the frequency and emotional effect of intrusive thoughts within a dynamic cognitive environment.
2.5.6. Assessment of Sleep Quality
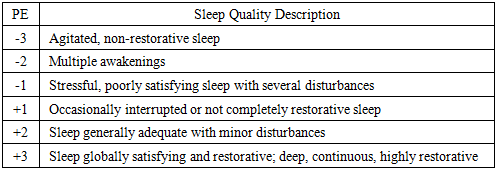
- Sleep Quality and Its EvaluationPoor sleep is closely linked to disrupted emotional functioning. Parsons et al. [51] found that higher self-reported sleep quality—but not sleep duration—was associated with stronger and longer-lasting positive emotions, weaker negative emotions, and the use of positive emotion-regulation strategies. Thus, assessing sleep quality is important for understanding its influence on cognitive and emotional processes.Measurement of Sleep QualityParticipants rated their sleep quality on a six-point scale ranging from highly disturbed, non-restorative sleep to deep, continuous, and highly restorative sleep. Each level was paired with a perceived-effect (PE) rating from –3 (very stressful) to +3 (very relaxing) (Appendix Table 12), enabling us to quantify both sleep characteristics and their perceived impact on well-being.Justification of the ScaleThe sleep-quality scale was adapted from established subjective sleep measures [52]. It used PE gradations ranging from –3 (‘agitated, non-restorative sleep’) to +3 (‘globally satisfying and restorative sleep’). This scaling provides a multidimensional assessment of sleep by capturing both its restorative quality and its emotional and psychological impact.
2.5.7. Assessment of Wakeup Quality
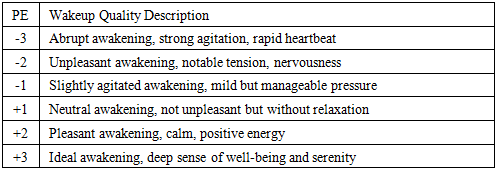
- Wakeup Quality and Its EvaluationThe quality of awakening affects daily functioning, influencing mood, stress reactivity, and cognitive performance. Stressful or abrupt awakenings can increase arousal and negative affect, while calm, restorative awakenings promote relaxation, positive emotions, and readiness for daily activities. Assessing awakening quality is therefore essential, as it is linked to sleep behavior, emotional outcomes, and overall health [53].Measurement of Wakeup QualityParticipants rated their wakeup quality on a six-point scale, from abrupt, agitated awakenings to ideal, deeply restorative ones. Each level was assigned a perceived-effect (PE) rating from –3 (very stressful) to +3 (very relaxing), reflecting the personal impact of the awakening (Appendix Table 13). This method captures both the objective characteristics of the awakening and its effect on well-being, offering a multidimensional assessment.Justification of the ScaleThe wakeup quality scale was adapted from research on sleep inertia and morning affect [53] [54] into a six-point scale with perceived-effect (PE) ratings. By combining descriptions of agitation, tension, calmness, and restorative experience with PE ratings, the scale provides a multidimensional assessment, capturing both the objective characteristics of awakening and its subjective impact on well-being.
2.6. Procedure
2.6.1. Data Collection
- Participants first completed standardized scales (PSS-4, WHO-5) and then the Ktiri-SDT tool, which included sleep and wakeup quality as well as intrusive thoughts. The procedure unfolded in four steps:1. Standardized measures: The PSS-4 (last month) and WHO-5 (last two weeks) were administered, with the content and intent of each scale explained to ensure comprehension.2. Sleep and wakeup assessment: Participants reported their bedtime and wake-up time for each day of the week to calculate total sleep duration, then rated their sleep quality (Section 2.5.6) and wakeup quality (Section 2.5.7) for each corresponding night and morning.3. Daily activities: Participants listed activities or stimuli encountered during a representative week (e.g., breakfast, commuting, work, leisure), reporting each activity’s duration (in minutes) and perceived effect (PE). These activities were assumed to reflect their usual activities over the preceding weeks. Activities that participants preferred not to disclose were recorded generically as “stimuli.”4. Intrusive thoughts: Participants reported intrusive thoughts, distinguishing positive and negative ones, and rated their frequency and perceived effect (see Section 2.5.5).Refinement of perceived-effect ratings: Participants occasionally compared activities to ensure accurate PE ratings. Standardized scale responses were also reviewed, and minor clarifications or revisions were made for accuracy.Rationale for recall periods: The three tools differed in their recall periods: the PSS-4 assessed the past month, the WHO-5 assessed the past two weeks, and the Ktiri-SDT captured a representative week, assumed to reflect activities and experiences regularly repeated over the preceding weeks. Despite these differences, prior research showed that scores remained comparable across varying recall windows [55,56], allowing meaningful comparison between standardized scales and Ktiri-SDT assessments of weekly experiences.Data were entered and organized using Microsoft Excel 2013 for preliminary management and analysis. This application was then used to automate scoring and data organization to ensure accuracy and systematic handling.
2.7. Data Analysis
- Descriptive statistics were computed to summarize Stress Power, cumulative stress and relaxation durations, and perceived-effect (PE) ratings during wakefulness. Sleep Quality and Wakeup Quality, rated daily on a six-point scale, were averaged across the seven days to produce a weekly mean for each participant, which was treated as continuous.The normality of variables (Sleep Quality, Wakeup Quality, Stress Power, Awakening Quality [PSS], cumulative stress duration, relaxation duration, PSS-4, and WHO-5) was then assessed using the Shapiro–Wilk test and visually via histograms and Q–Q plots.Two sets of correlations were planned:1. Stress Power and reference measures: Spearman or Pearson correlations (depending on normality) between Stress Power (Ktiri-SDT) and PSS-4 and WHO-5 scores were calculated to examine convergent validity.2. Sleep Quality, Stress Power, and Awakening Quality (PSS): Spearman or Pearson correlations to assess associations among these variables as a preliminary step before testing whether Sleep Quality depends on Stress Power and Awakening Quality.A multiple regression was planned with Sleep Quality as the dependent variable and Stress Power and Awakening Quality as predictors. If normality assumptions were violated, a rank-based regression using fractional ranks would serve as a non-parametric alternative.Individual stress–relaxation profiles were also examined to evaluate the functional consistency and practical applicability of the tool. All analyses were conducted using SPSS (version 28), with significance set at p < 0.05.
3. Results
3.1. Descriptive Results
3.1.1. Demographic Characteristics
- The pilot study included a convenience sample of 29 adults (9 females, 20 males) aged between 24 and 67 years (M = 45.79, SD = 11.38). Participants worked in the health, education, and public administration sectors.
3.1.2. Administration and Participant Feedback
- All invited participants agreed to take part in the study after the procedure and purpose of the tool were explained. The instrument was positively received by all participants, several of whom reported that completing it increased their awareness of daily stress levels and helped them identify potential sources of imbalance or dysfunction. Data were collected between July and November 2025. The administration required at least 30 minutes. For participants whose daily activities varied across the week and therefore could not be repeated, the administration time extended to approximately one hour or slightly more.
3.1.3. Observed Trends During Administration
- Levels of stress among participants ranged from very high to very low, a variability that became apparent during the administration of the adaptive instrument.
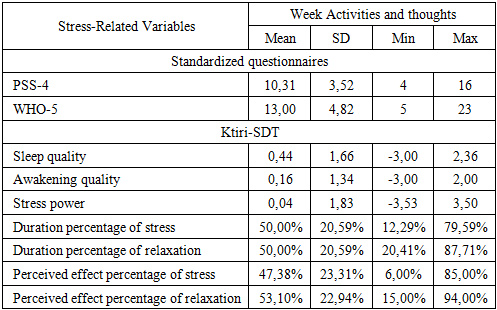
3.1.4. Stress-Related Variables
- Table 14 presents the means, standard deviations, minimums, and maximums for all stress-related variables. The PSS-4 and WHO-5 provide standardized measures of perceived stress and well-being. Sleep Quality and Awakening Quality were assessed separately using dedicated questionnaires, while the remaining variables—Stress Power, the percentages of time spent in relaxation and stress relative to the wakefulness period, and the overall perceived effects of relaxation and stress—were derived from the Ktiri-Stimuli Diagnostic Tool (Ktiri-SDT) based on participants’ reported activities and thoughts.
|
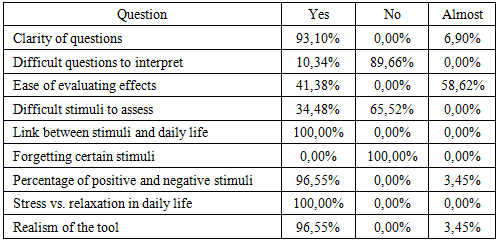
3.1.5. Face Validity Results
- Table 15 presents the results of the face validity assessment, based on participants’ evaluations of various aspects of the instrument.
|
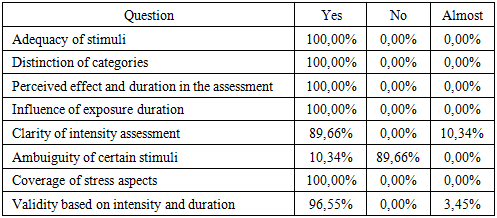
3.1.6. Content Validity Results
- Table 16 presents the results of the content validity evaluation of the Ktiri-SDT.
|
3.2. Correlations and Inferential Results
3.2.1. Normality Tests
- The normality of the variables was assessed using the Shapiro–Wilk test. The results indicated that PSS-4 (W = .953, p = .213), WHO-5 (W = .954, p = .231), and Stress Power (W = .974, p = .678) did not significantly deviate from normality. In contrast, Sleep Quality (W = .836, p < .001) and PSS (W = .909, p = .016) showed significant departures from normality. Visual inspection of histograms and Q–Q plots supported these findings. Accordingly, Pearson’s correlation coefficient was applied to normally distributed variables, whereas Spearman’s rank-order correlation was used for variables that violated normality assumptions.
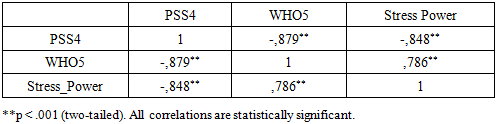
3.2.2. Correlations
- Table 17 presents the Pearson correlations among PSS-4, WHO-5, and Stress Power (SP). All correlations were significant (p < .001, two-tailed). PSS-4 correlated negatively with both WHO-5 (r = –.879) and SP (r = –.848), indicating that higher perceived stress was associated with lower well-being and more negative SP values. WHO-5 showed a strong positive correlation with SP (r = .786), meaning that greater well-being corresponded to higher SP scores. These associations align with the scoring logic of SP, where negative values reflect stress and positive values reflect relaxation.
|
|
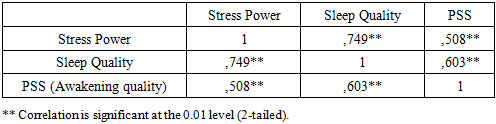
3.2.3. Predicting Sleep Quality from Stress Power and Awakening Quality
- A rank-based multiple regression using fractional ranks was conducted to address the non-normality of Sleep Quality and PSS variables. The model was significant, F(2, 26) = 21.97, p < .001, explaining 62.8% of the variance in Sleep Quality (R² = .628, Adjusted R² = .600).Stress Power strongly predicted better Sleep Quality (β = .596, B = 0.574, p < .001), indicating that more relaxed states were associated with higher sleep quality. Awakening Quality (PSS) was also a significant positive predictor (β = .301, B = 0.295, p = .040), with better awakening experiences linked to better Sleep Quality. The constant was not significant (B = 6.77, p = .386).These findings indicate that both Stress Power and Awakening Quality uniquely predict Sleep Quality, and the use of rank-based regression ensures robustness given the non-normal distributions of Sleep Quality and PSS.
4. Discussion
- Descriptive Discussion of FindingsSample Characteristics and ContextThe descriptive results from this pilot study provide an initial understanding of both the psychometric behavior of the adaptive Ktiri-Stimuli Diagnostic Tool (Ktiri-SDT) and participants’ overall stress-related experiences. The demographic characteristics of the sample indicate a diverse adult population working in health, education, and public administration, sectors commonly associated with varying levels of daily stress exposure, which makes them relevant for testing a stress-assessment tool such as the Ktiri-SDT. Teachers, for example, frequently experience work-related stress that impacts self-efficacy [57], nurses are exposed to occupational burnout due to high workload and emotional demands [58], and public administration employees report measurable perceived stress and its relationship to occupational health outcomes [59]. The age range observed, spanning from early adulthood to late middle age, may offer an opportunity to capture stress patterns across different life stages.Participant Engagement and Administration FeasibilityIn terms of how the instrument was administered, participant engagement was notably high: all invited individuals agreed to participate, and none reported negative experiences during administration. The positive qualitative feedback—particularly regarding increased awareness of stress levels and daily stressors—supports the instrument’s potential utility as both a diagnostic and reflective tool, with the reflective function aligning with recent findings that stressor-logging systems can enhance stress awareness and promote behavioral adjustments [60]. These observations reveal that the Ktiri-SDT has two distinct but complementary functions: (1) it measures stress in a structured and quantifiable manner, and (2) it increases the individual’s awareness of when and how stress occurs, helping users identify specific periods or situations associated with heightened vulnerability. This second function highlights the dual nature of the tool, which not only assesses stress but also serves as a reflective aid that may have a therapeutic dimension by helping users recognize patterns and better understand their emotional responses. However, as these insights stem from immediate subjective impressions, further research is needed to determine whether this increased awareness leads to sustained behavioral change or improvements in long-term well-being. Although the administration time of at least 30 minutes (extending to an hour for participants with more variable schedules) suggests moderate respondent load, participants did not report fatigue or disengagement.Variability in Stress Observed During AdministrationThe observed variation in stress during administration, ranging from very high to very low levels, highlights the tool’s ability to capture substantial individual differences. This wide distribution also may indicate that the adaptive nature of the Ktiri‑SDT is sensitive to these differences, reflecting its discriminative function, i.e., its ability to distinguish between individuals [61], possibly allowing the instrument to discriminate effectively between participants with markedly different stress profiles. This discrimination is essential for validating an adaptive tool, as it may suggest that the instrument responds flexibly rather than converging toward a narrow range of scores. The variability is further reflected in the quantitative measures of stress and well-being. The PSS-4 and WHO-5 scores place the sample slightly below the midpoint for perceived stress and at a moderate level of well-being, respectively. These findings may suggest that the sample was not overly burdened by stress but did not report exceptionally high well-being either.Alignment of Ktiri-SDT with Standardized MeasuresImportantly, the Ktiri-SDT measures showed clear congruence with the standardized instruments. Ktiri-SDT scores (Stress Power) clustered closely around the midpoint, aligning with the slightly below-midpoint perceived stress indicated by the PSS-4. The WHO-5 similarly reflects moderate overall well-being. In addition, the balanced proportions of time spent in stress and relaxation —each averaging approximately 50%—point to an overall equilibrium in participants' daily emotional experiences. The perceived effects of stress and relaxation followed a similar pattern, further reinforcing the notion of a generally balanced psychophysiological profile within the sample.Sleep-Related Patterns and Daily FunctioningSleep and awakening quality values, while showing broad individual variability, also tended to center near the scale midpoints. This suggests that, for most participants, sleep-related experiences were neither highly positive nor highly problematic, supporting the interpretation of a relatively stable but not optimal daily functioning profile. This stability further contributes to the overall picture of moderate stress, as participants do not show signs of severe sleep disruption. The combination of generally stable sleep patterns and moderate stress levels suggests that the sample experienced representative weekly functioning without extreme physiological or psychological strain.Evidence of Strong Face ValidityThe face-validity findings show that the Ktiri-SDT is clear, relevant, and closely aligned with participants’ daily stress–relaxation experiences. Participants overwhelmingly indicated that the questions were easy to understand, and all confirmed that the stimuli reflected their real-life contexts, demonstrating strong perceived relevance. Given that some stimuli required careful reflection and were difficult for certain participants to assess, the Ktiri-SDT must be administered by a clinical psychologist or a psychiatrist to know how to properly guide respondents through items that may demand professional judgment. Ensuring that items are clear, understandable, and interpreted as intended is a fundamental early step in scale development, helping to promote accurate and meaningful responses from participants. [62]. Moreover, the near-complete agreement that the tool’s calculation of positive and negative stimuli—and the overall balance between stress and relaxation—matched participants’ lived experience provides additional support for its practical appropriateness. This aligns with recent discussions emphasizing that face validity depends on respondents’ perceptions of clarity, relevance, and experiential appropriateness [63]. Overall, the results provide solid evidence that the Ktiri-SDT demonstrates satisfactory face validity.Evidence of Strong Content ValidityThe content-validity findings indicate that the Ktiri-SDT is conceptually robust and well aligned with the constructs it is intended to measure. Participants unanimously confirmed that the stimuli were adequate, clearly categorized, and appropriately integrated perceived effect and duration in their assessments, demonstrating comprehensive coverage of key stress-related dimensions. They also agreed that exposure duration influenced their evaluations and that the tool sufficiently represented all relevant aspects of stress. Minor ambiguities reported by a small subset of participants—such as slight uncertainty in assessing certain stimuli or selecting “almost” for perceived effect —highlight areas for potential refinement but do not compromise the overall conceptual integrity of the instrument. These results suggest that the Ktiri-SDT provides a meaningful and complete framework for evaluating daily stress–relaxation dynamics. Such systematic evaluation of conceptual coverage aligns with recommended practices for early-scale development [62]. Taken together, these findings confirm that the Ktiri-SDT is content validated.The Ktiri-SDT was perceived as clear, relevant, and well aligned with daily stress–relaxation experiences. Participants confirmed that the stimuli were meaningful, clearly categorized, and appropriately reflected perceived effect and duration, with minor ambiguities reported only by a few. Overall, these findings confirm that the Ktiri-SDT is both face and content validated.Overall Interpretation and ImplicationsTogether, these results indicate that the tool is well-received, easy to understand, grounded in real-world experience, and consistent with established measures. The balanced stress–relaxation patterns observed in the sample, along with the strong validity evidence, provide preliminary support for the Ktiri-SDT as a reliable and ecologically sensitive instrument for assessing daily stress dynamics. Its dual function—as both a measurement instrument and a reflective tool—further highlights its potential value, although future studies are needed to determine the extent to which heightened awareness contributes to lasting behavioral or psychological change.Correlations and Inferential ResultsThe correlation analyses provide evidence of convergent validity for the Ktiri-SDT. Stress Power showed strong negative associations with perceived stress (PSS‑4) and positive associations with well‑being (WHO‑5), consistent with theoretical expectations for the construct. Conversely, the positive correlation between WHO‑5 and SP demonstrates that higher well-being corresponds to more positive SP scores, which represent relaxation. These results confirm that the SP metric accurately reflects participants’ stress–relaxation states. These results provide convergent‑validity evidence in line with recent psychometric studies using correlations with established measures [64,65]. This supports the construct validity of the Ktiri-SDT, indicating that it measures stress–relaxation states in a manner consistent with established instruments, although further validation is required to fully establish the construct.Further, the associations between SP, sleep quality, and awakening quality reinforce the tool’s sensitivity to related daily functioning variables. The patterns observed indicate that more relaxed states tend to correspond with better sleep and improved morning experiences. The relationship between sleep quality and awakening quality further supports the internal consistency of participants’ self-reports. Recent findings consistently show that higher perceived stress predicts poorer sleep quality across diverse populations, including college students and healthcare workers [66,67]. Together, these patterns indicate that the Ktiri-SDT captures meaningful relationships between stress, well-being, and restorative processes, demonstrating its potential utility for both assessment and reflective awareness in daily life.Predicting Sleep Quality from Stress Power and Awakening QualityThe results demonstrate that both Stress Power (SP) and Awakening Quality play important roles in shaping sleep outcomes. Higher SP values were associated with better sleep quality and more positive awakening experiences, highlighting that individuals with stronger stress–relaxation balance tend to experience more restorative sleep. The significant predictive effects of SP and Awakening Quality, together explaining nearly 63% of the variance in Sleep Quality, underscore the functional interplay between daily stress dynamics and subsequent sleep. SP emerged as the strongest predictor, suggesting that accumulated stress regulation throughout the day is particularly influential for sleep. These findings support the utility of the Ktiri-SDT not only for monitoring daily stress–relaxation patterns but also for identifying key predictors of sleep health. This aligns with recent evidence that Stress Power significantly predicts sleep quality among college students [66].Finally, the findings provide further empirical support for the Tri-Transactional Theory of Stress, which emphasizes the dynamic interplay between stimuli (both stressors and positive stimuli), individual appraisal, and coping responses, as well as the influence of previous stress states (PSS) [5–7]. This study represents a second empirical confirmation of the theory, following the first validation in 2020 [6]. Specifically, Awakening Quality—as measured by the PSS within the Ktiri-SDT—reflected participants’ prior stress state and significantly predicted subsequent Sleep Quality, demonstrating how preceding stress influences later experiences. By capturing both current and prior stress indicators, the Ktiri-SDT operationalizes key theoretical constructs, highlighting the importance of awareness of stress–relaxation cycles for understanding daily functioning and their impact on restorative processes such as sleep.
5. Recommendations
- Based on the findings of this pilot study, several practical recommendations can be made to optimize the administration and utility of the Ktiri-SDT. First, the instrument should be administered by a trained clinician, such as a clinical psychologist or psychiatrist. This is essential because accurately determining whether a given period is stressful or relaxing—and assigning the appropriate level of stress or relaxation—often requires clinical judgment and, when necessary, follow-up interviews. During administration, the clinician must carefully monitor participants’ responses to avoid misclassification, particularly when determining whether a situation is experienced as positive or negative and how it contributes to the perceived effect (PE).Second, to refine the evaluation of PE, participants may be asked to compare activities with one another. For example, if commuting is rated as “slightly relaxing,” participants can be invited to indicate whether this effect is similar to, greater than, or less than that of another activity, such as sleeping or working. Additionally, reviewing participants’ stress ratings is recommended to ensure that the assigned values accurately reflect their subjective experiences and thoughts (see Section 2.6.1. Data Collection).Finally, as an adaptive tool, the Ktiri-SDT can be further enhanced by incorporating additional categories of activities, such as spiritual or mindfulness-related practices. Expanding the activity list allows the instrument not only to capture overall stress–relaxation patterns more comprehensively but also to identify which specific activity periods help participants feel more relaxed or less stressed. This enhancement may improve the ecological validity of the tool and increase its sensitivity in detecting individualized stress–relaxation dynamics.
6. Implications
- The findings of this pilot study have several important implications for both research and practice.First, the Ktiri-SDT demonstrates strong face and content validity, indicating that it is a reliable and user-friendly instrument for assessing stress and relaxation patterns of a representative week, reflecting activities and thoughts regularly repeated over the preceding weeks. Its adaptive design allows for the measurement of perceived effect (PE) and duration of stress and relaxation periods, providing a nuanced understanding of individual experiences over time.Second, the tool’s ability to capture specific activity categories, including newly suggested categories such as spiritual practices, offers practical insights into which daily activities and thoughts most effectively promote relaxation or mitigate stress. These insights can guide clinicians and participants in tailoring interventions and lifestyle adjustments to enhance well-being.Third, the study highlights the importance of professional administration, emphasizing the need for careful interpretation of subjective stress and relaxation ratings. Clinicians can use the Ktiri-SDT to inform personalized stress-management strategies, monitor changes over time, and support therapeutic decision-making.Finally, the successful application of the Ktiri-SDT in this pilot suggests its potential for broader use in research settings, such as exploring stress dynamics across different populations or evaluating the efficacy of stress-reduction interventions. Its adaptive and individualized approach may enhance both ecological validity and sensitivity in capturing the complex interplay of repeated stressors, relaxation periods, and coping responses over a representative week.
7. Limitations and Perspectives
- Although the Ktiri-SDT was well accepted by participants and demonstrated strong face and content validity, this pilot study involved a relatively small sample, which limits the generalizability of the findings. Future studies should include larger and more diverse populations to validate the instrument more robustly and confirm its reliability across different demographic and occupational groups.Additionally, while the adaptive design of the Ktiri-SDT allows for individualized assessment, further refinement of activity categories could enhance its sensitivity in capturing stress and relaxation patterns over a representative week, and help identify whether activities, thoughts or both most strongly contribute to participants’ stress or relaxation experiences.
8. Conclusions
- The Ktiri-Stimuli Diagnostic Tool (Ktiri-SDT) is a clear, adaptive, and well-accepted instrument for assessing stress and relaxation patterns over a representative week, capturing individualized activities and thoughts rather than relying on fixed questionnaire items. This dual function allows the tool to serve both as a structured measure and a reflective aid that enhances participants’ awareness of their stress and relaxation experiences. The tool’s outputs align closely with standardized measures of perceived stress, well-being, and sleep quality, while capturing temporal fluctuations and activity- and thought-specific variations.Importantly, the Stress Power score (the main Ktiri-SDT outcome), together with Awakening Quality (PSS), predicted subsequent Sleep Quality, providing a second empirical confirmation of the Tri-Transactional Theory of Stress, following the first validation in 2020 [6]. This demonstrates the Ktiri-SDT’s ability to operationalize core theoretical constructs, illustrating the dynamic interplay between prior stress, current appraisal, coping responses, and restorative processes.Face and content validity assessments further confirm that the instrument is intuitive, realistic, and comprehensive, with participants endorsing the clarity, relevance, and ecological applicability of its assessment approach. Minor ambiguities were reported by only a few participants, indicating areas for refinement without undermining overall validity.Overall, the Ktiri-SDT shows strong potential as an ecologically valid, sensitive, and practical tool for evaluating stress and relaxation patterns over a representative week. Future studies with larger and more diverse samples are warranted to further validate its measurement properties, ecological validity, and applicability in both research and clinical contexts.
Appendix
|
|
|
|
|
|
|
|
|
|
 ☐ Somewhat
  ☐ NoDifficult questions to interpret- Q2: Were any questions confusing or difficult to interpret?A2: ☐ No
  ☐ Yes (please specify ____)2. Ease of evaluationEase of evaluating effects- Q1: Was it easy to evaluate how each stimulus affected you (positively or negatively)? A1: ☐ Yes
  ☐ Somewhat
  ☐ NoDifficult stimuli to assess- Q2: Were there any stimuli that were difficult to understand or assess?A2: ☐ No
  ☐ Yes (please specify ____)3. Relevance to daily lifeLink between stimuli and daily life- Q1: Do the stimuli you identified reflect your daily life experiences?A1: ☐ Yes
  ☐ Somewhat
  ☐ NoForgetting certain stimuli- Q2: Do you think you might have forgotten any important stimuli that reflect your experience of stress?A2: ☐ No
  ☐ Yes (please specify____)4. Perceived balance of exposure to stressPercentage of positive and negative stimuli- Q1: Did the tool’s calculation of positive versus negative stimuli reflect your real-world experience?A1: ☐ Yes
  ☐ Somewhat
  ☐ NoStress vs. relaxation in daily life- Q2: Do you generally feel more exposed to stress or to relaxation in daily life?A2: ☐ Yes
  ☐ No (please explain ____)5. Overall realism and usefulnessRealism of the tool- Q: Overall, do you think the tool realistically reflects your experience with stress and positive stimuli?A: ☐ Yes
  ☐ Somewhat
  ☐ NoAppendix B. Content Validity Interview Questions1. Relevance of Stimulus CategoriesAdequacy of stimuli- Q1: Do the stimuli generated by the tool adequately represent the key aspects of exposure to stress and relief experiences?A1: ☐ Yes
  ☐ Somewhat
  ☐No (please explain____)Distinction of categories- Q2: Are the categories (positive, negative) appropriate and clearly distinguishable?A2: ☐ Yes
  ☐ Somewhat
  ☐ No2. Appropriateness of Intensity and Duration as MetricsPerceived effect and duration in the assessment- Q1: Is it appropriate to include both the perceived effect and duration of each stimulus in calculating emotional exposure balance?A1: ☐ Yes
  ☐ Somewhat
  ☐ NoInfluence of exposure duration- Q2: Does the duration of exposure meaningfully contribute to understanding the impact of the stimulus?A2: ☐ Yes
  ☐ No (please comment ____)3. Clarity and Interpretability of StimuliClarity of perceived effect assessment- Q1: Are the stimuli generated by the tool clear and easy to interpret in terms of intensity?A1: ☐ Yes
  ☐ Somewhat
  ☐ No (please describe the confusion____)Ambuiguity of certain stimuli- Q2: Are any stimuli ambiguous or difficult to classify as positive or negative?A2: ☐ No
  ☐ Yes (please list examples____)4. Coverage of the ConstructCoverage of stress aspects- Q: Do the stimuli and the generation rules cover all the important aspects of stress (for example: both frequent and less frequent stress triggers)?A: ☐ Yes
  ☐ Somewhat
 ☐ No (what is missing? ____)5. Overall Judgment of Content ValidityValidity based on perceived effect and durationQ: In general, does the tool provide a valid representation of the balance of stress exposure, based on the perceived effect and duration of the stimuli?A: ☐ Yes
  ☐ Somewhat
  ☐ No
☐ No
|
|
|