-
Paper Information
- Next Paper
- Paper Submission
-
Journal Information
- About This Journal
- Editorial Board
- Current Issue
- Archive
- Author Guidelines
- Contact Us
International Journal of Applied Psychology
p-ISSN: 2168-5010 e-ISSN: 2168-5029
2025; 15(2): 40-55
doi:10.5923/j.ijap.20251502.02
Received: Jun. 30, 2025; Accepted: Jul. 17, 2025; Published: Jul. 23, 2025

The Tri-Transactional Theory of Stress: Theory Update and Birth of a New-Generation Stress Diagnostic Tool
 Abstract
 Reference
 Full-Text PDF
 Full-text HTML
Fouad Ktiri
Higher Institute of Nursing Professions and Health Techniques, Rabat, Morocco
Correspondence to: Fouad Ktiri, Higher Institute of Nursing Professions and Health Techniques, Rabat, Morocco.
| Email: |  |
Copyright © 2025 The Author(s). Published by Scientific & Academic Publishing.
This work is licensed under the Creative Commons Attribution International License (CC BY).
http://creativecommons.org/licenses/by/4.0/

In this paper, I present an update version of the Tri-Transactional Theory of Stress without compromising its theoretical foundation. I eliminated confusion associated with the previously used stimulus objective intensity variable, replacing it by two new variables: Stimulus perceived intensity and individual sensitivity. As a result, the KTIRI-Stress equation developed in the latest versions of the theory is revised, and a simplified KTIRI-Stress accumulation equation was derived. By analogy with physics, I introduced a new concept called Stress Power (SP), which reflects the rate at which stimuli are converted into feelings of stress. This concept, together with the KTIRI-Stress accumulation equation, enabled us to enhance our understanding of the stress accumulation phenomena, in a manner consistent with prior research findings. Finally, the introduction of new variables and the revision of the equations helped us develop and present a prototype of a new-generation stress diagnostic tool, the KTIRI-Stimuli Diagnostic tool (KTIRI-SDT), presented in two variations. The implications of the study are thoroughly examined within the paper.
Keywords: Tri-transactional theory of stress, Perceived intensity, Sensitivity, KTIRI-Stress equation, KTIRI-Stress accumulation equation, Stress power, KTIRI-Stimuli Diagnostic Tool
Cite this paper: Fouad Ktiri, The Tri-Transactional Theory of Stress: Theory Update and Birth of a New-Generation Stress Diagnostic Tool, International Journal of Applied Psychology, Vol. 15 No. 2, 2025, pp. 40-55. doi: 10.5923/j.ijap.20251502.02.
Article Outline
1. Introduction
1.1. The Tri-transactional Theory of Stress
- In the theoretical study [1] of my Tri-Transactional theory of stress (Tri-TTS), which completes the Transactional model of stress [2], I introduced an additional dimension referred to as PSS (Previous State of Stress) and the notion of positive stimulus (PS). PSS was introduced to take into account an individual’s state of stress before he or she encounters any type of stimulus (stressful or restful). Both factors are in fact necessary to consider in the assessment of the state of stress generated when facing an environment to which we can react positively (feeling relaxed) or negatively (feeling stressed). In the original formulation of the Tri-TTS, the stress level experienced upon encountering a stimulus depends on three dimensions:- PSS- The intensity of the stimulus (denoted as SV, negative)- The coping strategy (noted as R), if available, that is used to eliminate the effect of the stimulusIts value, denoted as S, was presented in the form of the following proposed original equation [1]:
 | (1) |
 | (2) |
 | (3) |
1.2. The Confusions
- Nonetheless, although the results of the empirical study were consistent with the theoretical framework [1], asking participants to rate the objective intensity (ST) of the stimulus may lead to confusion or errors, namely:- Although the objective intensity of the stimulus is the same for all participants under identical experimental conditions, not all of them can perceive it in the same way; - Some participants may confuse the generated state of stress (S) with the objective intensity of the stimulus (ST).
1.3. Aim and Objectives
- The aim of the present theoretical study is twofold:- Updating the Tri-TTS while preserving its theoretical foundation;- Refining the Ktiri-Stress equation to enhance its utility in psychological research and practice.The related objectives are:- Distinguishing between the real and perceived intensities of a stimulus, as well as their corresponding effects;- Avoiding confusion between variables to be assessed in future empirical studies that apply the Tri-TTS on other population groups;- Revising the Ktiri-Stress equation by integrating two variables: perceived stimulus intensity and the individual’s sensitivity to the stimulus;- Deriving a stress accumulation equation from the revised stress equation. - Establishing that the predictions of the reformulated Ktiri-Stress accumulation equation are consistent with the findings of previous studies;- Presenting a prototype of a new-generation stress diagnostic tool based on the Ktiri-Stress accumulation equation.
2. The Intensity and Effect of a Stimulus
2.1. The Experienced Effect of a Stimulus
- Both early and recent studies refer to any influence (or event), which elicits a response (or activity) when talking about a stimulus. “It is any external influence that elicits a response” [4], or it is any external or internal event that triggers activity in the nervous system of an individual (Bhatia, 2009 as cited in Kim, 2019) [5] [6]. In my current study, a stimulus is defined as any internal or external agent interpreted by the nervous system as positive or negative, eliciting a response. It is internal if it comes from within us, such as thoughts, or external if it comes from the environment, such as noise. A negative stimulus can make a person feel stressed, but a positive stimulus can reduce the intensity of their stress, eliminate it, or even make them feel relaxed. Some examples of stimuli include noise, verbal aggression, joke, bad souvenir, rumination, soft music, relaxation technique, etc.A stimulus possesses an intensity, measured in decibels (dB) in the case of noise, and can have an effect, which may be perceived as strong or weak by an individual. Similarly, aggressive words interpreted as a negative stimulus within an individual’s culture, may have a strong or weak effect depending on whether they are perceived as highly or moderately offensive. The elicited effect of a stimulus then varies depending on many factors, including individual characteristics such as sensitivity to the stimulus (see heading “3.1. Integration of Individual Sensitivity to the Stimulus (parameter α)”. Moreover, its effect alone is not always experienced. According to the version of the Tri-TTS currently being updated, the response elicited when encountering a stimulus then depends on three dimensions: the pre-existing feeling of stress (PSS); the stimulus intensity, influenced by individual sensitivity; and the coping strategy.For instance, a noise of a certain intensity is not perceived by an individual if they wear noise-cancelling headphones (coping strategy available). Similarly, noise can be perceived if the individual is not wearing headphones or if they wear noise-reducing headphones. Additionally, if the same subject were already stressed (PSS<0), the intensity of their stress feeling would be higher if they did not wear headphones or if they wore noise-reducing headphones. Furthermore, two individuals perceiving the intensity with the same coping strategy can experience different sensations if they differ in their sensitivity to it. For more details about the noise stimulus and the use of the stress equation, see heading “5.1. Stimulus = Noise”.What an individual actually experiences when exposed to a stimulus is the state of stress generated by various factors (PSS, Sensitivity…) and not solely the effect of the stimulus itself.
2.2. The Objective Intensity of a Stimulus and Its Ambiguous Usage
- In my empirical study [3], the aim was to show that the previous state of stress (PSS) was necessary to take into account when assessing the state of stress generated by exposure to a stimulus. I asked the participants to evaluate their pre-existing states of stress (PSS), the effect of each task, Relaxation and Mental arithmetic, considered as two types of stimuli and their states of stress experienced after performing both tasks.However, because the only effect of a stimulus cannot be evaluated, see heading “2.1. The experienced effect of a stimulus”, I asked the participants to evaluate the objective perceived effect of the stimulus, i.e. the objective intensity of the stimulus, denoted as ST. The study generated Equation (3) above, where ST represents the objective stimulus intensity.Since the intensity of each stimulus (task) in the experiment does not change, it is expected to be perceived objectively by all participants. Indeed, the empirical study found that ST for two types of tasks (stimuli) were approximately constant across all participants [3]. Nonetheless, these results are not sufficient, as certain confusions may arise in future studies. Among these, the most likely to be made by future participants are:- To confuse the intensity with the effect experienced- To confuse the perceived effect of a stimulus with its true effectTo avoid any confusion, I will introduce new parameters and rewrite the stress equation without altering the core of the Tri-TTS, thereby preventing future participants from having to evaluate some unnecessary variables.
2.3. The Actual and Perceived Intensity of a Stimulus and their Respective Effects
- We can categorize stimulus intensity into two types: actual intensity (AI) and perceived intensity (PI). The first represents the intensity of the stimulus regardless of the subject who perceives it, while the second one depends on the coping strategy used by the subject so that he or she will perceive it as either reduced or amplified. For example, if the actual intensity of a noise is 50 dB, the perceived intensity for a person wearing noise-reducing headphones will be less than 50 dB (40, 30 dB, etc.), not to mention their sensitivity to noise.Likewise, the effect of a stimulus can be divided into two types: the actual effect and the perceived effect. The actual effect (AE) corresponds to its actual intensity (AI), which does not change by itself. The perceived effect (PE) corresponds to the effect generated by the perceived intensity (PI), influenced by individual sensitivity.Using the same example of the noise of 50 dB, the experienced effect for a person not wearing headphones will correspond to the actual effect (AE). In contrast, the experienced effect will be lower than the AE-or even negligible-, if the person is wearing noise-reducing or noise-cancelling headphones. In both cases, however, the outcome also depends on the individual’s sensitivity to noise (see heading “3.1. Integration of Individual Sensitivity to the Stimulus (parameter α)).
3. Introduction of Two New Parameters (α and β)
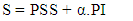
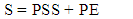
- Based on the stress equations (2), where the variable ST referred to the objective intensity of the stimulus, I will reformulate it by removing ST and incorporating the perceived intensity and the sensitivity parameter, denoted as α. Another parameter, additional sensitivity (β), will be considered and discussed, but its integration will remain implicit.According to the Tri-TTS, the state of stress induced by a stimulus is a combination of the previous state of stress (PSS) and the stimulus-specific effect. This effect modulated by individual sensitivity and coping strategies, determines the perceived effect of the stimulus. The variable ST will then be replaced by PE, representing the perceived effect of the stimulus, see heading “2.3. The Actual and Perceived Intensity of a stimulus and their Respective Effects”.
 | (4) |
3.1. Integration of Individual Sensitivity to the Stimulus (Parameter α)
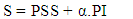
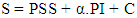
- When an individual encounters a stimulus and applies a coping strategy, (see heading “4. Encountering a Stimulus and Coping Strategies”), let us define the variable PI as the perceived intensity of the stimulus. The effect of this perceived intensity, however, may vary depending on the individual’s sensitivity to the stimulus. To represent this effect, let us define a second variable, PE, such that PE= α.PI, where α reflects the individual’s sensitivity. It also represents, according to the relationship, the perceived effect per unit of perceived stimulus intensity (α= PE/PI). We then observe that the higher the value of α, the greater the effect of the stimulus. Similarly, the higher the perceived intensity (PI), the greater the effect. Additionally, if a subject encounters a stimulus without using a coping strategy-meaning that the perceived intensity equals the actual intensity (PI=AI)-the stimulus will have no effect (PE=0) if the subject is not sensitive to it (neither negatively nor positively), as if the stimulus does not exist, see heading “4. Encountering a stimulus and coping strategies”. Likewise, if a person perceives a stimulus with a certain PI, their sensitivity to it remains constant during the exposure.The total effect then scales with both how sensitive (α) a person is to the stimulus and the perceived intensity of that stimulus (PI) after applying a coping strategy. Therefore, the perceived effect defined as the product α.PI, which models the interaction between α and PI, represents a theoretically justified relationship. Accordingly, the Ktiri-Stress equation becomes as follows:
 | (5) |
3.2. Consideration of Additional Sensitivity to the Stimulus (Parameter β)
- It is also important to mention another factor, which I consider significant and should not to be overlooked. A previously stressed person (PSS not null) is expected to be more sensitive to stimuli. An additional parameter of sensitivity, denoted as β, which generates an added stress effect, should be considered in addition to the previous one (parameter α). It will be estimated null, if the person is not previously stressed (PSS=0). The consideration of this newly proposed parameter is consistent with prior research findings. For example, as reported by Das et al., stressed people cognitions are hypersensitive to criticism [10]. Similarly, deprivation of sleep increases individual’s sensitivity to stressful events and stimuli [11] and any work rhythm that results in prolonged periods of sleep deprivation can lead to increased resting cortisol secretion and activation of the Hypothalamic- Pituitary-Adrenal (HPA) axis, which is more sensitive to stressors (Minkel et al. 2014 as cited in Rippon, 2024) [12] [13]. In addition, people who are more sensitive to stress are also more influenced by positive environment [14].At every point during exposure to a stimulus or combination of stimuli, an individual’s state of stress changes and becomes the baseline (PSS) for the subsequent response to continued exposure. And, given that β is dependent on PSS, it will also change over the course of exposure.Therefore, the additional perceived effect of stress (APE) due to the influence of PSS on sensitivity will also change, either increasing or decreasing. I define it as APE = β.PI. See the example of the strike stimulus “heading 5.2. Stimulus = Strike”.The parameter β actually represents the effect of the PSS on the individual’s sensitivity to a stimulus. For instance, if an individual is accustomed to a noise, α is null, but if they are stressed they will be sensitive to the noise, and their total sensitivity will be (0 + β). The parameter β then does not depend on α, but on PSS and on the intensity of the stimulus. Thus, (α + β) represents the total sensitivity of a previously stressed person to a stimulus, with α remaining constant and β varying during the exposure to the stimuli. I assume that the greater the stress state valence, the higher the total sensitivity. The total perceived effect of stress if the person was previously stressed, is then PE + APE = α. PI + β. PI. However, since the additional effect due to the additional sensitivity is driven by PSS, the latter and APE appear to be the same. Therefore, integrating both into the equation - rewritten as S = PSS + PE + APE - seems redundant. It is like saying “If I am stressed (PSS), I am more sensitive to the stimulus (β # zero). My additional stress (APE = β.PI), which originates from PSS, is a combination of APE and PSS”. This leaves us with two options, either integrate only PSS or only APE.Nevertheless, we cannot claim that PSS has the same valence as APE. A person may experience high stress but still exhibits lower sensitivity. Similarly, it is uncertain whether a previously stressed individual will always be more sensitive than someone who has not experienced stress. Additionally, rather than being negatively stressed, a person might be in a relaxed state, which could make them less sensitive to a negative stimulus. It is therefore necessary to explicitly mention PSS in the equation, and its mention is in fact an implicit acknowledgment of the additional sensitivity it introduces. This provides further evidence for considering the previous state of stress (PSS) and explicitly representing it within the Ktiri-Stress equation as was postulated by the Tri-TTS theory [1] [3]. The new final structure of the Ktiri-Stress equation is then:
 | (6) |
 | (7) |
4. Encountering a Stimulus and Coping Strategies
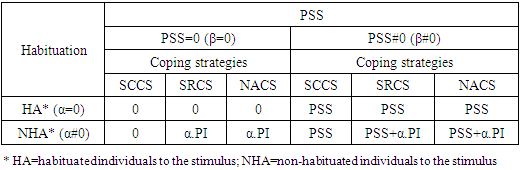
- The level of stress induced by a stimulus is subject to individual’s differences [1] [2]. Its experienced effect depends on three dimensions, see heading “1.1 the Tri-Transactional theory of stress”, including the coping strategy used to reduce or eliminate the effect of the stimulus. Four distinct cases emerge in response to a stimulus:Case 1: The person has learnt to ignore the irrelevant stimuli. This ability of learning is called “Habituation” (HA). This concept means that the sensitivity to a stimulus is decreased after repeated stimulation [15] [16]. In this case, the sensitivity parameter (α) is equal to zero, and as a result, the perceived effect is null.Case 2: The coping strategy is not available (NACS). The person is exposed to the full intensity of the stimulus (perceived intensity=actual intensity). Case 3: The coping strategy does not eliminate the effect of the stimulus, but reduces it. It is a stimulus-reducing coping strategy (SRCS). The individual is exposed only to a part of the stimulus’s actual intensity (perceived intensity < actual intensity). Case 4: The coping strategy eliminates the full effect of the stimulus, as if the stimulus did not exist (perceived intensity = null). It is a stimulus-cancelling coping strategy (SCCS). This case is equivalent to case 1.Combining PSS with these four cases results in twelve sub-cases when encountering a stimulus. The twelve different cases of the corresponding KTIRI-Stress equation are presented in Table 1.
|
5. Illustrative Examples
- This paragraph presents some concrete examples applying the KTIRI-Stress Equation developed above to clarify the terms introduced and the distinction between them.
5.1. Stimulus = Noise
- Suppose a noise, considered a negative stimulus, with an intensity of 50 dB. A previously stressed person (PSS <0) encounters it and is not accustomed to it (NHA). PI1, PI2, and PI3 represent the three perceived intensities corresponding to the following studied cases.Case 1: Person not wearing headphones- Actual intensity AI = 50 dB- Perceived intensity PI1= 50 dB- Sensitivity to PI1 = α1 - Perceived effect PE1 = - (α1.PI1) = - (α1.50) <0- Additional stress APE1= -β1. PI1<0 - S1 = PSS + PE1- PE1<0 ⟹ S1 < PSSThe noise caused the person’s stress level to rise.Case 2: Person wearing noise-cancelling headphones- Actual intensity AI = 50 dB- Perceived intensity PI2= 0- Sensitivity to PI2 = α2=0- Perceived effect PE2 =0- Additional stress APE2= 0- S = PSS + PE2- S = PSS < 0The person’s stress level has remained the same, as though the stimulus (noise) did not exist.Case 3: Person wearing noise-reducing headphones- Actual intensity = 50 dB- Perceived intensity PI3< 50 dB- Sensitivity to PI3 = α3< α1- Perceived effect PE3 > PE1 (the perceived effect is lower than in case 1)- Additional stress APE3= -β3. PI3<0- S3 = PSS + PE3 > S1- PE3<0 ⟹ S3 < PSSThe noise caused the person’s stress to rise, but to a lower extent than in case 1.The level of stress an individual experiences upon hearing a noise depends on their prior stress level (PSS) and the availability of a coping strategy, which influences both the perceived intensity (PI) of the noise and the individual’s sensitivity (α) to it. In addition, if the individual is habituated to the noise, it has no effect. This is as if it is perceived as nonexistent or because habituation acts like a coping strategy that eliminates its impact. Thus, the actual intensity of noise is not always perceived as it truly is, and distinguishing between them is crucial.If the individual were not previously stressed (PSS and β are null), their level of stress (S= α.PI) would be due only to the noise, as determined by its perceived intensity and the sensitivity to it.Previously stressed people and their reaction to noise have been the subject of experimental studies. In their research examining exposure to noise in relation to personality traits, Abbasi et al. [17] showed that neurotic students react strongly to noise. Moreover, as reported by van Kruijsdijk [18], neurotic people have increased stress levels compared to emotionally stable people.If certain types of previously stressed individuals (PSS<0) are more sensitive to noise, as shown in these studies, the additional sensitivity β and its corresponding effect, APE=β.PI, are different from zero (Case 1 and case 3). However, since it is unclear whether all stressed individuals are more sensitive to noise, it is more appropriate to reflect the additional effect in the PSS, which may or may not induce it (see heading “3.2. Consideration of Additional Sensitivity to the Stimulus (Parameter β”)).
5.2. Stimulus = Strike
- To enhance the understanding of the parameter PSS and the additional sensitivity β, I will present another type of stimulus that activates the sensory organ of touch. Let us take the example of a blow to the legs.
5.2.1. Analogy with the Previous State of Stress (PSS)
- If you hit a person on the leg, the perceived effect will be different depending on whether they are injured or not.If the person is injured, their leg may be swollen or red. By analogy with states of stress, this prior condition of the leg can be described as negative. Additionally, the leg injury will increase the person’s sensitivity to the hit, indicating that the additional sensitivity β and APE (=β.PI1) are different from zero. By analogy with the stress equation (6), the total effect felt, denoted as S1, by the person after receiving the hit can be expressed as S1 = PSS + PE1, where PSS is the sensation associated with the pre-existing injury and PE1 is the effect of the hit (in the absence of injury).If the additional effect due to the injury (APE1) is equivalent to PSS, the total effect can also be expressed as S1= PE1 + APE1.The total effect S1 is then greater than in the absence of injury (S1 = PE1), which is logically expected.If we define S1 = PE1 + PSS + APE1, this would be redundant, as it effectively states that the perceived effect after the hit is the combination of: the effect of the hit in the absence of the injury, the pre-existing effect due to the injury and the additional effect of the hit resulting from the injury. This is consistent with the earlier discussion regarding additional sensitivity and its overlap with PSS, see heading “3.2. Consideration of Additional Sensitivity to the Stimulus (Parameter β)”.
5.2.2. Analogy with the Perceived Intensity of Stimulus PI
- If the person wears a protective bandage on their leg, the perceived intensity of the blow and the corresponding physical effect will change. The effect felt will differ from that in the absence of the bandage. While the prior condition of the injured leg remains unchanged (PSS), the total effect felt after the hit will be reduced and can be expressed as S2 =PSS + PE2, where PE2 > PE1; it follows that S2 > S1.In this case, the additional effect due to the injury (APE2) cannot be considered equivalent to PSS, because the sensation of the injury under the bandage remains unchanged (PSS), whereas the bandage specifically reduces the additional effect. This provides further evidence that PSS does not always have the same valence as APE2 and must be explicitly expressed in the stress equation. In this example, we distinguish between the actual and perceived intensities of the stimulus (the blow), depending on whether the person uses a coping strategy (the bandage) or not, see heading “4. Encountering a Stimulus and Coping Strategies“. Similarly, we distinguish between the perceived effect, which corresponds to the perceived intensity, influenced by individual’s sensitivity, and the generated effect, which also depends on the prior state.
5.3. Stimulus = Light
- A similar interpretation could be made if the stimulus were light stimulating the visual sensory organs. By analogy with stress perception, if the person is affected, for example, by ocular conjunctivitis, this condition will correspond to the prior state (PSS). Therefore, the effect experienced in the eyes (S) after exposure to light can be expressed as S = PSS + PE, where,- PSS is the effect due to the ocular conjunctivitis, - PE is the effect of light in the absence of ocular conjunctivitis, APE, in this case, is the additional effect resulting from increased sensitivity caused by ocular conjunctivitis.If the person wears protective glasses, the same light will be perceived at a reduced intensity, and therefore the total experienced intensity will be diminished.I conclude, based on the theoretical conceptions introduced above and supported by these illustrative examples, that the effect of the stimulus cannot be perceived in isolation. This is because an individual’s prior state of stress is, in most cases – or perhaps always- different from zero.Therefore, I posit that a minimum level of stress is necessary to keep a person vigilant. Taking into account this minimum constant level of stress, denoted as C, I would rewrite the KTIRI-Stress equation presuming that the value of C varies between individuals:
 | (8) |
6. Stress Accumulation
- I can define stress accumulation as the amount of stress received over a period, which can be either short or long. In this period, an individual can be exposed to multiple stimuli, both positive and negative, see heading “2.1. The Experienced Effect of a Stimulus”. Some of these stimuli may occur simultaneously or successively, and each stimulus can last from a few seconds-like a disturbing car honk- to several hours, such as monotonous work.
6.1. A Case Illustrating Stress Accumulation
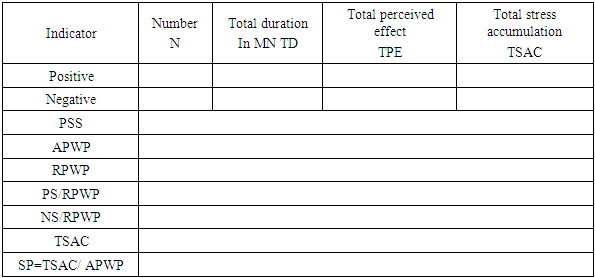
- One day, after waking up in a bad mood (PSS negative) and having his breakfast, a man took the bus to get to work. The bus was crowded with people, which stressed him out (negative stimulus 1) during his 35-minutes ride. He hates his job, which he finds boring. Throughout the trip, he thought about it (negative stimulus 2). At work (negative stimulus 3) just before starting, he received some worrying messages (negative stimulus 4) from his friend, which he thought about for one hour. After that, he called his friend. The latter explained the meaning of the message. The man realized he had misinterpreted the message, which relaxed him (end of stimulus 4).He finished his work (end of stimulus 3) and went home, making the same stressful trip for 40 minutes (negative stimulus 5). Back home, he felt very tired and slept for 2 hours (positive stimulus 6). When he woke up, he went to meet a friend at a café where he usually goes. Their discussion was pleasant (positive stimulus 7), during which they chatted and laughed.In this example, the man was exposed to seven stimuli, five negative and two positive. Stimuli 1 and 2 were triggered simultaneously and lasted the same period. Stimuli 3 and 4 were also triggered simultaneously. The following diagram (Figure 1) illustrates the above situation.
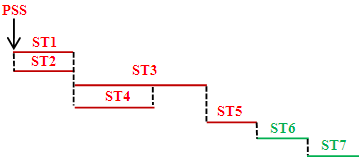 | Figure 1. The seven stimuli and their respective durations |
6.2. Calculation of the Stress Accumulation Equation
- In this paragraph, based on the KTIRI-Stress equations (7 or 8) and using a simple stress accumulation situation (e.g. Figure 2), I will develop the stress accumulation equation. This development will be carried out using two approaches: the discrete summation approach and the continuous summation approach.
6.2.1. Example of a Stress Accumulation Situation
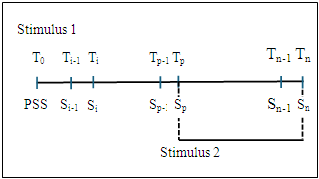
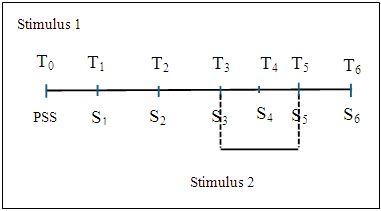
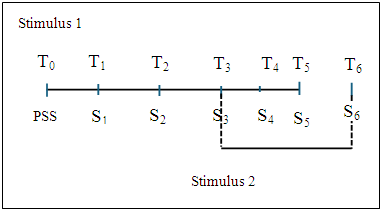
- Suppose a person is exposed to two stimuli with actual intensities AI1 and AI2, but whose perceived values by the individual are PI1 and PI2 (use of coping strategies). In addition, PI1 and PI2 are assumed to remain constant during the stimuli activation period, as are the corresponding sensitivities, α1 and α2, given that the same individual is considered. The person, before encountering the first stimulus, was in a previous state of stress at T0 (PSS), which could be either positive or negative. The first stimulus was triggered at time T1 followed by the second one, which was triggered until T3 and both of them remained active between T3 and T5. I can also describe the two stimuli as prolonged (e.g. Figure 2). Let us calculate the stress accumulation received by the person between times T0 and T5.
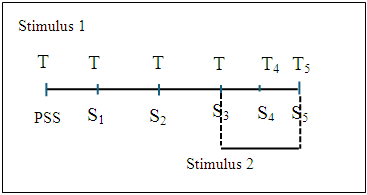 | Figure 2. Exposure to two stimuli during discrete time steps |
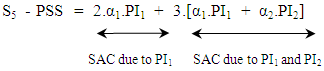
6.2.2. Discrete Summation Approach
- In this approach, the individual’s state of stress is assumed to evolve in discrete time steps (T1, T2, T3, T4 and T5) rather than continuously, remaining constant between any consecutive steps.At time T2 for instance, the person's stress state (S2) depends on the previous stress state at T1 (S1), the perceived intensity PI1 of stimulus 1 and the individual's sensitivity α1 to that stimulus. The additional sensitivities βi, which depend on each Si, are implicitly reflected in the values of Si, see heading “3.2. Consideration of Additional Sensitivity to the Stimulus (Parameter β)”. Between T3 and T5, when the person is exposed to two stimuli- with α1 and α2 as their corresponding sensitivities- the parameter βi actually represents the effect of Si on the individual’s sensitivity to both stimuli combined. Drawing upon the preceding data and applying the KTIRI-Stress equation (7 or 8), the successive stress states generated at each time step within the interval [T0, T5] can be formulated as follows:
 | (9) |
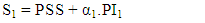 | (10) |
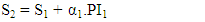 | (11) |
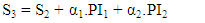 | (12) |
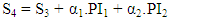 | (13) |
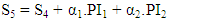 | (14) |
 | (15) |
 | (16) |
 | (17) |
 | Figure 3. Exposure to two stimuli during n discrete time steps |
 | (18) |
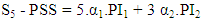
6.2.3. Continuous Summation Approach
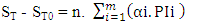
- In this approach, I assume that the stress state S (t) of the individual varies continuously over the interval [T0, T5] (e.g. Figure 2). Consequently, any period during which the stress state remains constant is considered infinitesimal. In other words, the index n representing the number of periods tends to infinity.I can therefore replace the number of periods within [T0, T3] by the quantity Δt1 = T3 - T0 and the number of periods within [T3, T5] by the quantity Δt2= T5 - T3. Thus, the stress accumulation (SAC) equation between time points T0 and T5 takes the form of:
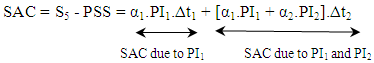 | (19) |
 | (20) |
 | (21) |
6.3. The Concept of Stress Power and its Utility
6.3.1. Definition
- I defined stress accumulation as the amount of stress received over a given period (see heading “6. Stress Accumulation”). This accumulated stress is, in fact, caused by the quantity of stimuli, which could be positive, negative or a combination of both, to which is exposed an individual. In other words, the amount of stimuli is transformed into a corresponding stress state.In physics, power is defined as the quantity of energy transferred or converted per unit of time. In other words, it represents the rate at which energy is transferred or converted [19]. By analogy with this field of science, I define “Stress Power” as the amount of stimuli converted per unit of time. In other words, it is the rate at which stimuli are converted or transferred into stress sensations over a given time interval.Stress power then describes the rate at which an individual’s stress level rises or falls over time. A more negative stress power implies a quicker onset of stress in response to negative stimuli, while a more positive value indicates faster recovery or relaxation.
6.3.2. Calculation and Application of Stress Power
- I define the stress power, denoted by SP, of an individual exposed to series of stimuli-positive, negative or both-, during a given period T, as:
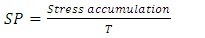 | (22) |
6.4. Use of the KTIRI-Stress Accumulation Equation and Consistency with Previous Research
- In this section, I show that the KTIRI-Stress accumulation equation (20 or 21) can predict outcomes consistent with those reported in previous empirical studies. The following scenarios will be analyzed:1- Prolonged Exposure to a Stimulus2- Immediate Effect of a New Stimulus3- Effect of Stimulus Intensity4- Effect of Continuous Stimulus Activation on Stress Accumulation5- The Impact of Stimulus Deactivation on Stress Accumulation6- Effects of Ending a Negative Stimulus and Triggering a Positive Stimulus on Stress accumulation7- Combination of Positive and Negative Stimuli8- A Comparison between Single-Stressor Repetition and Multi-Stressor Exposure
6.4.1. Prolonged Exposure to a Stimulus
- Many studies have shown that encountering a stimulus during a certain period can generate increased stress. As reported by Peavy et al. [20], prolonged stress, in both humans and animals, leads to the activation of the stress axis, the Hypothalamic-Pituitary-Adrenal axis (HPA), which results in sustained secretion of stress hormones (glucocorticoid or cortisol in humans). Similarly, chronic exposure to physical and psychosocial stressors has been reported to adversely affect adult neurogenesis in many animal species [21]. This is also supported by a recent review study, which highlighted that chronic stress can lead to elevated cortisol levels through the activation of the Hypothalamic-Pituitary-Adrenal (HPA) axis, and is associated with adverse health outcomes [22]. All these findings show that prolonged exposure to stress (threatening stimuli) increases cortisol release and worsens the sensation of stress. The terms acute and chronic refer to the duration of stressors, which may range from minutes to hours in the case of acute stress, and from days to months in the case of chronic stress [23].These outcomes can also be predicted using the KTIRI-Stress accumulation equation (20).Suppose a person encounters the same stimulus with a perceived negative intensity PI (PI<0) and a sensitivity α over the interval [T0, T]. Let us demonstrate that the quantity of stress increases between the two time points. If, at T0, the initial quantity of stress is S0 = PSS, then the stress accumulated between the two time points can be expressed as S - S0 = α.PI. (T- T0), where α and (T- T0) are positive. It follows that S - S0 < 0, or equivalently, S < S0.The intensity of the stress state then decreases (becomes more negative). Moreover, the longer the period [T, T0], the more negative the accumulation of stress becomes.
6.4.2. Immediate effect of a New Stimulus
- In this section, I will examine the immediate effect of a stimulus.Referring to the situation illustrated in Figure 2, let us imagine two scenarios in which, at time point T3, an individual is either exposed to stimulus 2 (PI2) or not. S3(2) and S3(1) are perceived states of stress corresponding to the two scenarios, respectively. According to the KTIRI-Stress accumulation equation (20), the stress accumulated is S3(1) - PSS = α1.PI1.(T3-T0) when stimulus 2 is not triggered, and S3(2) - PSS = α1.PI1.(T3-T0) + α2.PI2 when stimulus 2 is triggered at T3.It follows that S3(2) > S3(1) If PI2 > 0, and S3(2) < S3(1) If PI2<0.As predicted by the KTIRI-Stress and KTIRI-Stress accumulation equations, the stress response to a newly triggered stimulus is immediate and not time-dependent. It depends solely on the stimulus perceived intensity PI and the individual’s sensitivity α. The greater the intensity of the new stimulus, the more pronounced its effect, be it positive or negative.In real-life situations, the immediate triggering of a positive stimulus (PI2>0)-such as good news-can immediately reduce our sensation of stress. Likewise, if we receive a negative stimulus (PI2<0)-such as reading an upsetting telephone messages-our level of stress increases immediately.This outcome is also in line with previous experimental studies. Cettolin at al., examining economic rationality under stress, showed that though cortisol release takes time when an organism is exposed to a stressor, physiological responses begin within seconds [24].
6.4.3. Effect of Stimulus Intensity
- As demonstrated above (see heading “6.4.1.Prolonged Exposure to a Stimulus”), the length of stimulus activation period influences the magnitude of stress accumulation, assuming the intensity of stimuli remains constant.In this section, I demonstrate that variations in stimulus intensity-whether increasing or decreasing-also influence the magnitude of stress accumulation.Based on the scenario illustrated in Figure 2, the accumulation of stress- denoted as SAC1 of an individual between T3 and T5, where PI1(1) and PI2(1) represent the perceived intensities of the two stimuli, is given by:
 | (23) |
 | (24) |
 | (25) |
6.4.4. Effect of Continuous Stimulus Activation on Stress Accumulation
- Referring to the situation illustrated in Figure 2, where the effects of stimuli 1 and 2 ended at T5, let us imagine two cases where one of the two stimuli remains active after T5. The stimuli 1 and 2 are assumed to be negative (PI1<0) and positive (PI2>0) respectively.Case 1: The negative stimulus remains active until T6, while the positive stimulus 2 ends at T5 (e.g. Figure 4)
 | Figure 4. Continued activation of negative stimulus until T6 |
 | (26) |
 | (27) |
 | (28) |
 | Figure 5. Continued activation of positive stimulus until T6 |
 | (29) |
 | (30) |
 | (31) |
6.4.5. The Impact of Stimulus Deactivation on Stress Accumulation
- Referring to the situation illustrated in Figure 5, and assuming that the individual is exposed solely to a negative stimulus, I will demonstrate that after the stimulus is deactivated at T5, the individual’s sense of stress will gradually decrease over time. Demonstrating this using only KTIRI-Stress accumulation (SAC) equation (20) is not possible, since SAC (T0, T6) = SAC (T0, T5) = α1.PI1.(T5-T0), due to T6 - T5=0. Therefore, I apply the concept of stress power introduced above; see heading “6.3. The Concept of Stress Power and its Utility”.According to equation (22), the stress powers SP1 and SP2, corresponding to intervals [T0, T5] and [T0, T6], are given by:
 | (32) |
 | (33) |
6.4.6. Effects of Ending a Negative Stimulus and Triggering a Positive Stimulus on Stress Accumulation
- Continuing from the previous reasoning where negative stimulus 1 ends at T5, resulting in SP1< SP2, let us now consider a scenario in which a positive stimulus (PI2) is triggered at T5. The stress accumulation between T0 and T6, denoted SAC (T0, T6), is given by:
 | (34) |
 | (35) |
6.4.7. Combination of Positive and Negative Stimuli
- Referring to the situation illustrated in Figure 4, where an individual is exposed simultaneously to two stimuli with respective perceived intensities PI1 and PI2 during the period [T3, T5], the resulting stress accumulation is given by:
 | (36) |
6.4.8. A Comparison between Single-Stressor Repetition and Multi-Stressor Exposure
- If, for example, an individual is simultaneously exposed to three stressors with respective perceived intensities PI1, PI2 and PI3 during the time interval [T0, T], their stress accumulation is expressed as follows:
 | (37) |
 | (38) |
 | (39) |
 | (40) |
 | (41) |
 | (42) |
 | (43) |
6.5. The Conceptual Utility of the KTIRI-Stress Accumulation Equation
- In general, over a given time interval [T0, T]- such as during in everyday life-an individual may be exposed to a variety of both positive and negative stimuli. At the conclusion of this interval, the individual’s perceived level of stress depends on their initial stress state at T0 (PSS) and the stress accumulated from stimuli converted into stress-related sensations (see heading “6.3. The Concept of Stress Power and its Utility), as described by the KTIRI-Stress and KTIRI-Stress accumulation equations. For example, extending the duration of daily relaxation sessions or increasing exposure to positive stimuli can significantly reduce an individual’s level of accumulated stress throughout the day, helping them end the day with a lower stress level.Accordingly, the KTIRI-Stress and KTIRI-Stress accumulation equations, along with the concept of KTIRI-Stress power, provide a robust framework for modeling stress dynamics. Together, they offer a valuable methodological basis for developing a diagnostic tool to assess an individual’s stress state and investigate its underlying causes.
7. Diagnosing an Individual’s Stress
- Numerous studies have been conducted to develop scales aimed at assessing an individual's stress level. These research-based scales typically consist of items presented in the form of questions. The subjective responses provided by the individual, using a likert scale (e.g., ‘strongly agree’, ‘strongly disagree’) [36], make it possible to evaluate their stress levels. The resulting stress level corresponds to a score obtained by summing the values assigned to each response.Among the validated stress scales are: - The perceived stress scale, based on the transactional model of stress [2], was developed in 1983 [37];- The Perceived occupational stress scale [38].Unlike traditional stress scales, I aim in this study, using the KTIRI-Stress and KTIRI-Stress accumulation equations, to present the features of a prototype representing a new-generation of stress diagnostic tool. It is not a scale in the proper sense, but the purpose of administering it to an individual is to identify the number and types of stimuli they are exposed to in their daily or weekly life, including whether these stimuli are positive, negative, or both. In addition, this instrument is dynamic, with the number of items adapting to the individual being assessed.
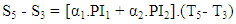
7.1. Presentation of the Prototype
- The new tool I propose, called the KTIRI- Stimuli Diagnostic Tool, first version (KTIRI-SDT V.1), is presented in tabular form, as shown in Table 2. It contains a series of questions designed to identify the stimuli to which an individual is frequently or regularly exposed in life.I propose two variations of this tool: KTIRI-DSDT and KTIRI-WSDT. In the first, KTIRI-Daily Stimuli Diagnostic Tool, I identify the stimuli to which the individual is exposed in everyday life. In the second variation, KTIRI-Weekly Stimuli Diagnostic Tool, the questions focus on experiences throughout the week, acknowledging that some stimuli are periodic and only appear on specific weekdays.For each item (stimulus), I present its type (positive or negative), its duration in minutes, the individual’s perceived effect (PE), see heading “2.3. The Actual and Perceived Intensity of a Stimulus and their Respective Effects” and the accumulated stress, which is given by SAC=PE.Δt (see equation (21). The type (positive versus negative) is indicated because the stimulus can be perceived differently by different individuals. The perceived effect PE is assessed using a 6-point likert scale with the following response options: -3=Very stressful, -2=Stressful, -1=Slightly stressful, +1=Slightly relaxing, +2=Relaxing”, and +3=Very relaxing. A response option, in fact, reflects the perceived effect of a stimulus represented by the product α.PI (see heading “3.1. Integration of Individual Sensitivity to the Stimulus (Parameter α)). For example, when a subject reports that a stimulus is “very stressful”, this suggests that the perceived effect results from the individual’s sensitivity (α) and the perceived intensity (PI), which is, in turn, shaped by the coping strategy employed.I do not include a “neutral” option in the response scale. If a subject does not perceive the stimulus as negative, the response is interpreted as reflecting a slight positive effect (e.g., “Slightly relaxing” or “relaxing”). This approach is intentional and theoretically justified.First, in Section 6.4.5, The Impact of Stimulus Deactivation on Stress Accumulation”, I demonstrate that once a negative stimulus ends, there is reduction in experienced stress-almost as if a fictional, slight positive stimulus is triggered by the cessation of the negative one. Second, in my theoretical study of the T-TTS [1], particularly in Section 5.1, No Stimuli Means Positive Stimuli”, I proposed that “the fact that a person is doing nothing but having rest could be evaluated as positive stimulus which could reduce their stress” (p. 105).The first item in the tool’s table (see Table 2), which I consider crucial and reflective of the core principles of the Tri-Transactional Theory of Stress, is the AWAKE-UP item. It reflects the level of stress individuals experience upon waking and serve as indicator of their initial baseline stress state (PSS) at the start of each day.
|
|
7.2. Case Study
7.2.1. Case Study Presentation
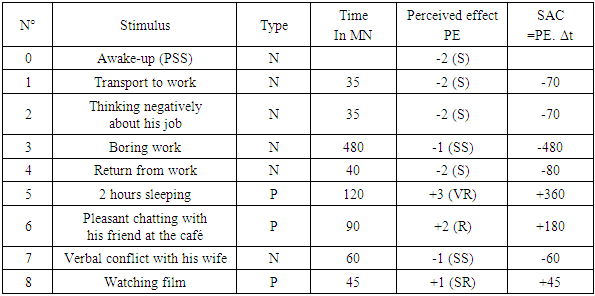
- In this section, I take the scenario presented in the illustrative case of stress accumulation above-see heading “6.1. A Case Illustrating Stress Accumulation”-and add some other stimuli, using it as a case study to which I will apply the KTIRI-SDT tool. Assuming the man’s daily routine remains consistent throughout the week, I will use the Daily Stimuli Diagnostic Tool Variation (KTIRI-DSDT).The two additional stimuli are as follows: after he leaves his friend, he usually goes home and engages in a slightly stressful verbal conflict with his wife for about one hour. Then, he turns on the TV and watches a film, which he considers a slight recovery period, until 11:30 p.m., at which point he goes to bed. The man who has begun to suffer from sleep deprivation and some psychosomatic symptoms, consults a healthcare professional. The latter administers a conventional stress scale to him.The score he obtains is high. This index is important, as it provides an initial indication of his stress level. However, this is insufficient, and the therapist wants to understand how the man leads his daily or weekly life in relation to the environmental stimuli he is exposed to. Suppose this man wakes up every day at 9 a.m., already in a state described as stressful (-2) (see heading 7.1. Presentation of the Prototype) and goes to bed at 11.30 p.m. The KTIRI-Stimuli Diagnostic Tool results for this case are presented in Table 4. Stimulus 4 (worrying message) (see heading “6.1. A Case Illustrating Stress Accumulation”) is not included in the table, as it is not a stimulus that occurs every day.
|
|
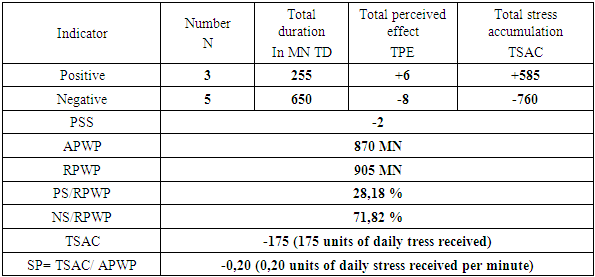
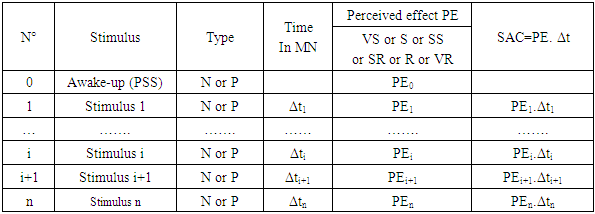
7.2.2. Case Study Interpretation
- The results of the KTIRI-DSDO (Table 5) show that the number of negative stimuli is not very high compared to the positive ones (5 versus 3). Their respective total perceived effects are also not significantly different (-8 versus +6). However, the total active period of negative stimuli, relative to the total exposure time to both negative and positive stimuli (RPWP), significantly exceeds that of the positive ones (71,82% versus 28,18%). This indicates that the duration of stimulus exposure plays a key role in determining the resulting perceived effect (“See heading “A Comparison between Single-Stressor Repetition and Multi-Stressor Exposure”). The man’s stress levels apparently stem from his perceived boring job and the type of transport he uses on a daily basis. He should therefore focus on resolving these two issues before thinking about increasing the number of positive stimuli (such as sleep, coffee, etc.).
8. Implications
- The theoretical revision of the Tri-Transactional Theory of Stress (Tri-TTS) and the development of a prototype for a new-generation stress diagnostic tool offer significant benefits. First, the revision of the stress equation will enable future researchers to test the validity of the Tri-TTS on other population groups without the need to use the previously confusing variable, stimulus objective intensity ST.Second, using developed equations, both theorists and practitioners can predict the phenomenon of stress accumulation and its relation to stimuli.Finally, the new-generation stress diagnostic tool, in both of its variations (KTIRI-DSDT, KTIRI-WSDT), derived from the newly revised KTIRI-Stress Accumulation Equation, will enable health professionals, particularly psychologists, to explore the underlining causes of stress experienced by individuals.
9. Conclusions
- The aim of the present theoretical study was to advance the Tri-Transactional theory of stress by refining the KTIRI-Stress equation. I eliminated the confusion caused by the stimulus objective intensity variable (ST), which had previously been used in the empirical study [3] and could led to ambiguity in interpretation in future research. In the revised equation, I introduced the concepts of stimulus perceived intensity (PI) and individual sensitivity (α). As a result, I developed a simplified model of stress accumulation allowing us to enhance our understanding of the phenomenon, with its interpretation aligned with the findings of previous studies. As part of the theory revision, another key concept was introduced, referred to as the Stress power (SP) concept. First, SP enables us to determine the rate at which stimuli are converted into sensations of stress. Second, it allows us to explain certain stress accumulation phenomena that the corresponding equation fails to account for.The refined equation also led to the development of a new-generation stress diagnostic tool based on the KTIRI-Stress and KTIRI-Stress accumulation equations. This tool, called the KTIRI-Stimuli Diagnostic Tool first version (KTIRI-SDT V.1), is presented in two variations: the KTIRI-Daily Stimuli Diagnostic Tool (KTIRI-DSDT) and the KTIRI-Weekly Stimuli Diagnostic Tool (KTIRI-WSDT).The revision the Tri-Transactional theory of stress- through its stress and stress accumulation equations, along with the introduction of new parameters and concepts, is significantly beneficial for future research in the field of stress.