-
Paper Information
- Paper Submission
-
Journal Information
- About This Journal
- Editorial Board
- Current Issue
- Archive
- Author Guidelines
- Contact Us
International Journal of Applied Psychology
p-ISSN: 2168-5010 e-ISSN: 2168-5029
2020; 10(2): 43-64
doi:10.5923/j.ijap.20201002.03
Received: July 25, 2020; Accepted: August 28, 2020; Published: September 15, 2020

The Tri-transactional Theory of Stress - An Empirical Application to Positive and Negative Activities
 Abstract
 Reference
 Full-Text PDF
 Full-text HTML
Ktiri Fouad
Psychology Department, Institute of Nursing Professions and Health Techniques, Rabat, Morocco
Correspondence to: Ktiri Fouad , Psychology Department, Institute of Nursing Professions and Health Techniques, Rabat, Morocco.
| Email: |  |
Copyright © 2020 The Author(s). Published by Scientific & Academic Publishing.
This work is licensed under the Creative Commons Attribution International License (CC BY).
http://creativecommons.org/licenses/by/4.0/

In this paper we present an empirical application of our tri-transactional theory of stress [1]. According to this mathematical numerical model, the perceived stress intensity generated after encountering a stimulus (positive or negative) depends not only on this latter’s objective perceived intensity (ST), but also on the perceived previous state of stress (PSS) that a person possessed before facing the stimulus. Its resulting value is the combination of PSS and ST, which is described in the model by the formula (S = PSS + ST) [1]. The main objective of the present study is to empirically demonstrate that PSS is obligatory to take into account in the assessment of an individual state of stress. For this, we examined the combination by testing 5 different hypotheses that: 1) the value of S would simultaneously be different than PSS and STA, where STA (ST of an activity) is the objective perceived stress intensity of an activity (set of stimuli), 2) a negative activity would have a negative effect on PSS, 3) a positive activity would have a positive effect on PSS, 4) S would be associated with PSS, 5) the value of S would depend on PSS and STA. Two different activities, relaxation (savasana accompanied with music) and mental arithmetic (serial subtractions test), were used in the experiment that generated positive and negative stimuli respectively. The secondary objectives were to examine the effect of the 2 activities on gender and age and to check out if there were mutual effects between partial stresses that make up the values of PSS, STA and S. From a voluntary non-probability sample of 131 participants we collected 131 measures. Each measure included the values of PSS, STA and S, each one is composed of 3 different partial stresses (emotional, mental and physical). For statistical analyses, we used Wilcoxon signed rank test to compare between S and PSS and between S and STA, Rho Spearman to check the relationships between partial stresses (emotional, mental, and physical), total stresses (TS, TPSS and TSTA) and their positive and negative components (PS, NS). Mann-Whitney and Kruskal-Wallis tests were used to check if the results depended on gender and age respectively. Multiple linear regression was conducted to check the relationship between the dependent variable S and the independent variables PSS and STA. The results have effectively shown that the 5 hypotheses were confirmed in terms of total, positive and negative stresses. The 2 activities, relaxation and mental arithmetic, have positive and negative effects on PSS and its components (partial stresses) respectively. The intensity S is highly significantly different than PSS (p<0,001) and STA (p<0,001) and depended on them. S is also found to be positively associated with PSS (p<0,001) and STA (p<0,001) in terms of total, positive and negative stresses. In addition, we found that PSS and STA have an interaction on each other. We conclude that the dimension PSS, introduced in our tri-transactional theory of stress, has to be taken into account in the assessment of the stress intensity generated by a stimulus or an activity (set of stimuli). The previous stress formula (S =PSS + ST) proposed in our previous study was revised according to new present study outcomes for the two activities. The corresponding model was found highly significant (p<0.001) and explained 83,8 % (mental arithmetic) and 73,10 % (relaxation) of the variance of the stress value S if the predicted variables are total stresses TPSS and TSTA (P<0.001) (TS= Constant + α TPSS + β TSTA). The negative stress (NS) for mental arithmetic (76,9 %) and the positive stress (PS) for relaxation (72,00 %) were well predicted by the independent variables TPSS and TSTA (NS = constant + αTPSS + βTSTA; PS = constant + αTPSS + βTSTA). The observed and predicted values using these equations were found to be strongly correlated with a Spearman coefficient (Rho) that ranges from 0.847 to 0.905 (p<0,001). As for the secondary objectives, the objective perceived stress (STA) values of activities were observed not to depend on age (p>0.05) and gender for the 2 activities, except for gender concerning the mental arithmetic (p<0.05). The variation of stress (TS – TPSS) depended on age (p<0.05) and gender for the 2 activities, except for gender concerning the relaxation activity (P>0.05). Emotional stress seemed to be significantly influenced by other partial stresses for relaxation activity. These empirical results prove the validity of our new model of stress applied to positive and negative activities.
Keywords: Mental arithmetic, Savasana-relaxation, Previous state of stress, Emotional stress, Mental stress, Physical stress, Stress formula
Cite this paper: Ktiri Fouad , The Tri-transactional Theory of Stress - An Empirical Application to Positive and Negative Activities, International Journal of Applied Psychology, Vol. 10 No. 2, 2020, pp. 43-64. doi: 10.5923/j.ijap.20201002.03.
Article Outline
1. Introduction
- With the purpose of understanding the concept of stress and its occurrence in its emotional, mental and physical aspects, and explaining its negative effects on our health, many models and theories were developed. Cannon in his “Fight and Flight” model (1932), considered stress as a body response to the aversive environment [2]. Selye (1936) defined stress as “the nonspecific response of the body to any demand made on it” (p. 32) [3]. In 1956 in his book “The stress of life” he presented another theory called “General Adaptation Syndrome” [3]. For him, our body reacts to the environment demands through 3 steps: Alarm, resistance and exhaustion. According to Rahe and Holmes [4], stress is a stimulus (major life event). In their Social readjustment rating scale developed in 1967, they listed a number of life events ranging from the very stressful event (death) to the moderated one (pregnancy) that could develop an illness. The scale score reflects the degree of stress experienced by an individual.In 1984, Folkman and Lazarus developed another theory (transactional theory of stress) in which they considered stress as an interaction between an individual and his/her environment [5]. He/she evaluates a stressor and uses coping strategies, if they are available, to cope with it. Contrary to previous theories, the individual, in this model, is not passive and the occurrence of stress depends on his/her stressors’ perception and interpretation.In 2016, we developed a new model of stress [1] we called the Tri-transactional theory of stress [6]. It completed the transactional theory of Folkman & Lazarus. In this new approach, we introduced another dimension named "Previous State of Stress" (PSS). This new variable, according to us, is a very crucial parameter to take into account in order to know the true perceived value of the stress state resulted after facing a stimulus (internal or external) by an individual. The new model of stress was proposed and explained on the base of our observations and its demonstration by using mathematics. In the same study we proposed a stress equation [1] (S= PSS + ST), which, according to us, could provide an approximate value of the perceived stress intensity of a person state of stress after facing a stimulus (positive or negative). This formula was used to mathematically demonstrate the positive effect of relaxation [6]. In the present study, we pursuit our research and empirically validate the model to 2 types of stimuli. The new dimension PSS, to our best knowledge, has not been explicitly taken into consideration as a variable in the previous psychological stress theories [1] [6]. It was used, however, in other disciplines like physics, geology, and biology. In geomechanics, for example, one found that the stress state σij depends on the previous state of stress σij0 and is considered as an incremental process (σij = σij0 + Δσij) [7] in which stress (mechanical stress, deformation) means the force (pressure) that acts on a solid surface (rock…). In physiology, it was used for example to show that the modulation of anxiety-like behaviour in rats by the facilitation of their endocannabinoid system neurotransmission depends on their previous stress experience [8]. In the same field, Concannon et al. showed that previously stressed (shocked) animals could learn after administering epinephrine to them [9], which means that the previous stress state variable has also an effect. The main objective of the present study is then to empirically demonstrate that the new dimension PSS has to be taken into account in the assessment of the state of stress (S) of an individual. For this, we check that: S, perceived after performing an activity (set of stimuli), is function of PSS and STA. STA is the objective perceived value of stress of the activity. The first hypothesis to support is then that S would be simultaneously different than PSS and STA.In addition, since STA can refer to a negative or to a positive stressor, the second and third hypotheses are: STA would have a negative (decreasing) and a positive (increasing) effect on PSS respectively. If STA<0 then S would be less than PSS: the person facing the activity would be more stressed out. If STA>0 then S would be greater than PSS: the person facing the activity would be less stressed out.Proving that the resulting stress state value of a person (S) depends on PSS could be also made by checking the fourth hypothesis that S would be associated with it. The presence of a correlation between S and PSS is a strong evidence, since we don’t need in this case to assess STA: the value of this latter could be confused with S by some participants. Proving that S is simultaneously different than PSS and STA and is function of them leads us to check the fifth hypothesis that S (dependent variable) depends on the 2 independent variables PSS and STA.For testing these hypotheses we can use any activity that could increase or decrease stress in an individual who performs it. The stress values of the individual (PSS and S) and the activity (STA) are treated as global variables or in terms of their partial stresses that make them up. The secondary objectives are then to examine the effects of the activities used in the study on gender and age of the participants and to investigate the mutual effects between partial stresses.
2. The Tri-transactional Theory of Stress
- According to our new numerical model of stress [1], the internal state of stress (positive or negative) that a person experiences is the production of the transaction between his/her previous stress state, his/her perceived internal or external environment and the availability of the resource(s) that could fight the threatening stimuli of this environment. In order to assess the stress state (positive, negative, neutral) that an individual feels after been exposed to a stimulus, we proposed a mathematical formula (1) composed of three parameters (PSS, SV, R). This equation was:
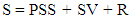 | (1) |
 | (2) |
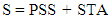 | (3) |
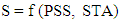 | (4) |
3. Method
3.1. Participants and Sampling
- To make the participants carry out the activities used in the experiment (relaxation and serial subtractions test) (see 3.3 “Procedure”) the criteria of their inclusion are:1- To have a level of education that allows them to do subtractions and know how to communicate by telephone (verbally or in writing) their states of stress and the objective perceived stress intensity of the activities;2- to be adult in order to avoid making minors performing relaxation, which would require the approval of their parents;3- to be of any socio-economic, cultural or racial status, because stress is a phenomenon that can affect everyone.As for the exclusion criteria, the participants should not be under psychotropic drugs, since their medication could have an effect on the perception of a stimulus or their subjective state. Psychotropic medications could alter perception or behaviour, because they have an effect on mind [11]. Despite these restrictions, the original population from which we should draw a representative and probability sample is very large, because the main hypothesis, namely considering the “Previous State of Stress” in the assessment of stress, could be applied to any individual.And, even if we had wanted to test our hypotheses only on a well-defined population (students, teachers, doctors, nurses, etc.), it would have not been possible to obtain a great number of subjects, to make a random choice and therefore to carry out probability sampling. On the other hand, making participants perform activities, especially relaxation (section 3.3 procedure), was not easy. This required a significant effort from us. Volunteers had to be found who would accept the conditions for carrying out the activities.These constraints led us to opt for a voluntary non-probability sample.Regarding the size of the sample, due to the inclusion criteria and the conditions for carrying out the activities, it was difficult to recruit a very large number of participants. Thus the sample obtained was 131 subjects (59,54 % women and 40,46 %) whose age varied between 18 and 65 years.
3.2. Types of Stress Measured and Scoring
- In order to check our cited hypotheses, the variables S, PSS and STA were treated in terms of partial and global stresses (combination of partial stresses).
3.2.1. Partial Stresses
- The word “stress” has in fact not the same meaning for all people. We noticed that, for some individuals, when they say “I am stressed”, they mean “I am nervous” or “I don’t feel well”, whereas for others it means “I am mentally tired” or “I am physically tired”. The word “stressed” could also be used to describe “I feel tense, under pressure or even depressed” [12]. In the Toulousaine stress scale the authors used four manifestations of stress: psychological (“I worry”,…) physical (“I bite my nails”,…), psycho-physiological (“I am tired”,…) and temporal (“I have difficulty organizing what I have to do”,…) [13]. Some people refer to “chronic fatigue”, frustration or “inability to cope” when they use the word stress [14].Physical stress, mental stress and emotional stress refer to physical strain (physical activity), mental fatigue and anxiety (worry, sadness,…) respectively [15].In some studies, researchers have also distinguished between three types of stress: physical, mental and emotional. Murray et al. [16], in their study to investigate the effect of stress on irritable bowel syndrome, have separated between emotional, physical and psychological stresses. The stimuli used to produce these three types of stress were respectively: dichotomous listening, maintaining a body position for a long time and loud music. Blair et al. [17] used suspense and gruelling oral examination to generate emotional stress.In the present study, we also used three types of stress: emotional, mental and physical. Their corresponding stimuli are:- Positive or negative emotional stress (joy, anger, nervousness…): mental arithmetic test, relaxation, music…- Positive or negative mental stress (mental rest, mental fatigue): mental arithmetic test, relaxation, music…- Positive or negative physical stress (physical rest, physical fatigue): relaxation…Distinguishing between the three types of stress in the present study had some pros, namely:- This prevented us to mistakenly assess an aspect of stress instead of another;- This allowed us to check if one aspect had significantly an effect on the other (see heading “5.7 Mutual stress effects between partial stresses”);- In case there were mutual effects between partial stresses, this would show which partial stress is influenced by another;The variables PSS, STA and S of partial stresses (emotional, mental and physical) were measured and compared according to the cited hypotheses.
3.2.2. Combination of Partial Stresses
- In addition to assessing the variables PSS, STA and S of partial stresses, we added other variables to evaluate the global state of stresses of participants. These new variables correspond to either total stresses, global stress states or positive and negative stresses.Total stress A total stress variable is the sum of the 3 partial stresses. TPSS = Emotional PSS + Mental PSS + Physical PSSTSTA = Emotional STA + Mental STA + Physical STATS = Emotional S + Mental S + Physical SIn other studies the concept of “total stress” have been used. In their research [18], Speca et al. used “total stress score” by adding “muscle tension”, “emotional irritability” and other physiological and psychological variables scores. In a study to investigate the association between teachers’ beliefs and stress, the “total stress” was calculated by summing the scores of class stressful situations [19].Global stress state In addition to summing the partial stresses in order to evaluate the total stress of participants, we also created another variable we called the global stress state. It is a concatenation of partial stresses’ scores.Using global stress state variable has the advantage of differentiating between 2 states of stress that can have the same total stress.Example (see heading “3.2.3 Scoring”):Emotional stress: -1Mental stress: +1Physical stress: +1Total stress TS1= (-1) +1 + 1 = +1Global stress state 1 =-111Emotional stress: 1Mental stress: -1Physical stress: 1Total stress TS2= 1 - 1 +1= +1Global stress state 2= “1-11”Total stress TS1 = total stress TS2Global stress state1 ≠ global stress state 2The number of global stress states that correspond to different combinations of partial stresses (from (-3, -3, -3) to (+3, +3, +3)) is 343 triplets.Positive and negative stresses variablesPositive (PPSS, PSTA, PS) and negative (NPSS, NSTA, NS) stress variables are calculated by summing the positive and negative scores of partial stresses (e.g. Figure 1).Example (see heading “3.2.3 Scoring”):Emotional stress: -1Mental stress: +1Physical stress: +1Total stress = (-1) +1 + 1 = +1Positive stress = +2Negative stress = -1Total stress = Positive stress + Negative stressUsing positive and negative stress variables allowed us to know how positive and negative values of stress states could vary after performing an activity, while, in total stresses, positive and negative scores are compensated each other;
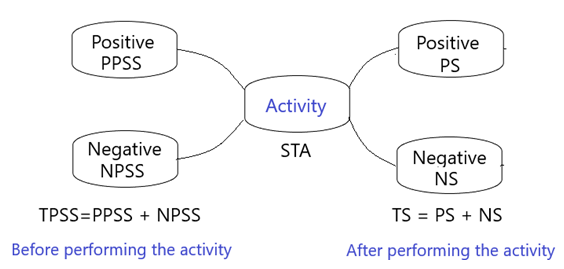 | Figure 1. The decomposition of total stress into positive and negative stresses |
3.2.3. Scoring
- According to the tri-transactional approach of stress [1], a stimulus as well as a state of stress can be positive, neutral or negative. After facing a stimulus, a person can be for example, stressed, not stressed or even happy. The states of stress PSS or S (physical, mental, emotional) of a participant or the objective perceived stress value STA of an activity (physical, mental, emotional) were obtained by using one-item questionnaire. The question asked was “How do you feel” to assess the state of stress (before or after an activity) or “how stressful is an activity” to objectively evaluate the activity. One-item questionnaire was used in a previous study to evaluate the patients’ self-reported health by rating it in 5 categories (from “very bad” to “very good” [20]. In our present study we scored PSS, S or STA by using Likert scale on 7 categories from “very stressed” or “very stressful” to “very happy” or “very entertaining”. The values of PSS and S could be:- Emotionally: very stressed (-3), stressed (-2), little stressed (-1), not stressed (0), little happy (+1), happy (+2), very happy (+3)- Mentally : very tired (-3), tired (-2), little tired (-1), not tired (0), little rested (+1), rested (+2), very rested (+3)- Physically: very tired (-3), tired (-2), little tired (-1), not tired (0), little rested (+1), rested (+2), very rested (+3)The values of STA could be:- Emotionally: very stressful (-3), stressful (-2), little stressful (-1), not stressful (0), little entertaining (+1), entertaining (+2), very entertaining (+3)- Mentally: very tiring (-3), tiring (-2), little tiring (-1), no tiring (0), little restful (+1), restful (+2), very restful (+3)- Physically: very tiring (-3), tiring (-2), little tiring (-1), no tiring (0), little restful (+1), restful (+2), very restful (+3)N.B. the words “tired”, “rested”, “happy”, “entertaining” …were used instead of “stressed”, “not stressed”, “stressful” and “not stressful” only to make the participants understand the difference between the 3 aspects of stress. This type of scoring was also used in other studies. Bernard, in his research “Teachers beliefs and stress” asked teachers to indicate on a five-point scale (1 = ’not stressful’; 2 = ’a little stressful’; 3 = ’moderately stressful’; 4 = ’very stressful’; 5 = ’extremely stressful’) the extent to which they personally viewed their class or administration problems as stressful [19].N.B: if a subject is not stressed (PSS=0), a very stressful activity could generate a “very stressed” state, and an “entertaining” activity could generate a happy state. The use of seven types of scores (“very stressed”…“very happy”…) allowed the participant to have many choices and the possibility to compare between 2 states of PSS, S and STA that seem to be similar like “little tired” and “tired” or “not stressed”, “little stressed”, “little stressful” and “stressful”. This also allowed us to obtain correct evaluations from the participants. The Seven-point categories are preferred on 5-point scale. Likert and others recommend to use as wide scale as possible and it was shown that with 7-categories we reached the upper limits of the scale reliability [21].
3.3. Procedure
- Each participant underwent two different activities: relaxation and mental mathematical task. He/she has to be at home in order to lie on his/her back during relaxation. During the experiment we communicated with him/her by telephone (verbally or in writing). We chose these 2 activities, because they were considered as two different types of stressors (stimulus). The mental mathematical task is a negative stressor and relaxation is a positive stressor.For mental mathematical task, we used a serial subtractions test. This task is used in clinical tests to elicit and detect mental negative stress [22], [23], [24]. It also offers less ethical problems than some other stressors [25].Each participant was asked, during the mental mathematical test performed for 5 MN, to decrement 1022 by 13. He/she was informed, in case of response error, to restart the task from 1022.As for relaxation activity, we used savasana. It is a pose in yoga, known as a corpse pose, in which the subject lies on the ground in a supine position, closes his/her eyes, extend his/her arms and legs and, without moving for a time of period, he/she has to release tension [26]. It was shown that savasana and poses of meditation improved relaxation by reducing plasma catecholamine and blood pressure and minimizing sympathetic activation [27]. In order to improve the effect of savasana-relaxation activity, we used a soft music that a participant had to listen to during the activity. Ogba et al., in their research [28], reported that relaxation had been often used with music therapy and their combination had helped to alter negative thoughts and emotions and elicit relaxation responses. Likewise, this mixture of soft music and relaxation reduce anxiety and stress [29]. Savasana-relaxation was then considered in the present study as a set of positive stimuli and its intensity is, depending on subjects, approximately always positive (STA>0). During this activity we told the participant to lie on his/her back, close his/her eyes, relax his body and not move while listening to an 8 MN soft relaxing music. The same music was used with all participants. This activity was then performed at home for all participants.For each activity, we told the participant to evaluate the 3 aspects of stress (emotional, mental and physical) of his/her state before doing the activity (PSS), after doing the activity (S) and to objectively assess the perceived stress intensity of the activity (STA). In order not to have a confusion between the perception of an activity stress intensity (STA) and the perception of the stress state intensity (S), we told the participant that STA is the evaluation of the activity intensity and not the evaluation of his/her stress state (S).In order to obtain correct evaluations, we told the participant to compare between the responses of PSS and S and re-evaluate them. For example, if a subject evaluated the mental stress of PSS as “little tired” and of S as “little tired” too, he/she had to correct them by comparing his/her states of stress before and after, except if the two states were exactly the same for him/her.
3.3.1. Comparing the Variables S with PSS and STA
- In order to check the first hypothesis, that S would be different than PSS and STA, the comparison between these variables were carried out in terms of partial stresses taken individually or combining them (Global stress state, total stress, positive and negative stresses).
4. Data Analysis
- IBM SPSS (Version 21; IBM Corp, 2012) and Microsoft Excel (Office version 2013) were used to perform statistical analyses and calculate some variables like effect size respectively. Descriptive analyses were conducted for each variable (PSS, STA and S) in terms of partial, total, positive and negative stresses. They included the median, mode, mean ranks for ordinal and nominal values, the mean, standard deviation, the maximum and minimum for interval values.The variables PSS, STA and S were measured for the same participant before, during and after the activity (serial subtractions test and savasana-relaxation). Statistical techniques used for the analysis were: - Paired groups to compare between the measured variables;- Kolmogorov-Smirnov and Shapiro-Wilk tests to check if each of the variables followed the normal distribution;- Dependent t-test to test the difference between the means of total, positive and negative stresses in cases where data were normally distributed;- Wilcoxon signed rank test to test the difference between the median of total, positive and negative stresses in cases where data were not normally distributed.- Independent t-test to compare the results between males and females if data were normally distributed.- The Mann-Whitney test to compare the results between males and females if data were not normally distributed.- The Kruskal-Wallis test to check if the outcomes depended on age in case the results were not normally distributed, otherwise the one-way ANOVA test was used.- The Effect size r to describe how large or small the differences between S and PSS and between S and STA were. The effects are large, medium or small if r=0.5, 0.3 or 0.1 respectively [30].- Pearson or Rho spearman coefficients to study the correlation between the variables in those cases that followed or not normal distribution respectively;- Multiple regression analysis to predict the value of the dependent variables total, positive and negative stresses measured after performing an activity. Its assumptions include linearity of residuals, and homoscedasticity between dependent variable (S) scores and errors of prediction. The independence of observations, using the Durbin-Watson test, multicollinearity between the independent variables PSS and STA and the residuals normality were also tested.- A p-value less than 0.05 (5%) was retained statistically significant.
5. Results
5.1. Descriptive Outcomes
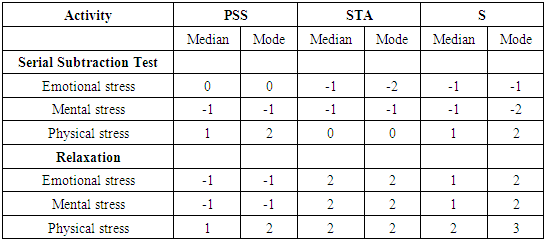
- 131 participants (59,54 % females and 40,46 % males) performed the 2 activities (serial subtractions test and savasana accompanied with music). The mean age of all participants is 31,60 (SD=13,80; Min=18,00; Max=65,00).Table 1 contains the median, mode of the variables PSS, STA and S for partial stresses. The results show that S is less than PSS for emotional and mental stresses concerning serial subtractions test and higher than PSS for relaxation for all partial stresses.
|
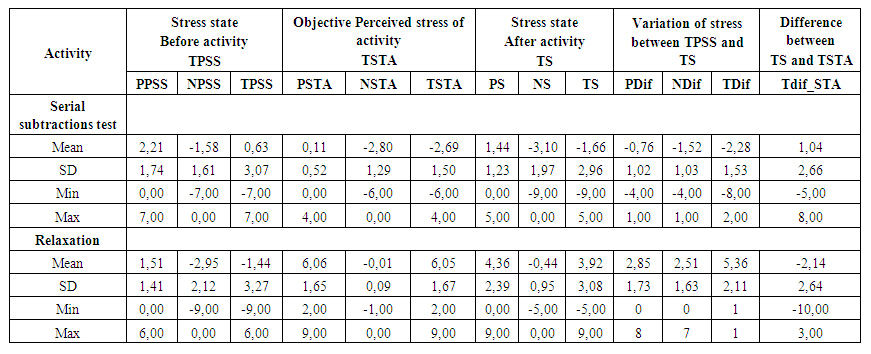 | Table 2. Mean, Standard Deviation, Min and Max of PSS (stress before an activity), STA (objective perceived stress of an activity), S (stress after an activity), Variations of Stress and Differences between S and STA for the 2 activities (N=131) |
5.2. The Objective Perceived Stress of Activities and Their Effects
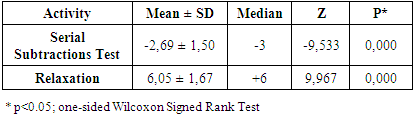
- The outcomes of the comparison of the objective total perceived stress intensity (TSTA) to the hypothetical value TSTA=0 for the 2 activities are presented in Table 3. The results show, for a one sample tailed test, that TSTA is significantly (p<0.001) negative for serial subtractions test and positive for relaxation.
|
|
|
|
5.3. The Subjective Perceived Stress Intensity Variation
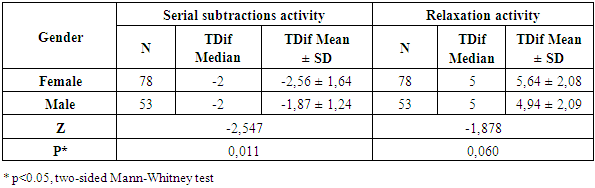
- Table 7 represents data on median, mean and standard deviation of stress variation before and after performing an activity (TDif = TS – TPSS). The non-parametric Mann-Whitney test was used to compare TDif between males and females for the 2 activities.
|
|
5.4. Comparison between Partial Stresses
- Table 9 contains mean rank and sum of ranks of the difference between PSS, STA and S of partial stresses concerning serial subtractions test activity. Using the two-sided Wilcoxon rank test, the outcomes show that S is significantly different than PSS for emotional and mental stresses (p<0.001) with a large effect size and not for physical stress (p>0.05). Their number of ties do not exceed the sum of positive and negative ranks, which means that in most measures S and PSS are not equal for emotional and mental stresses.
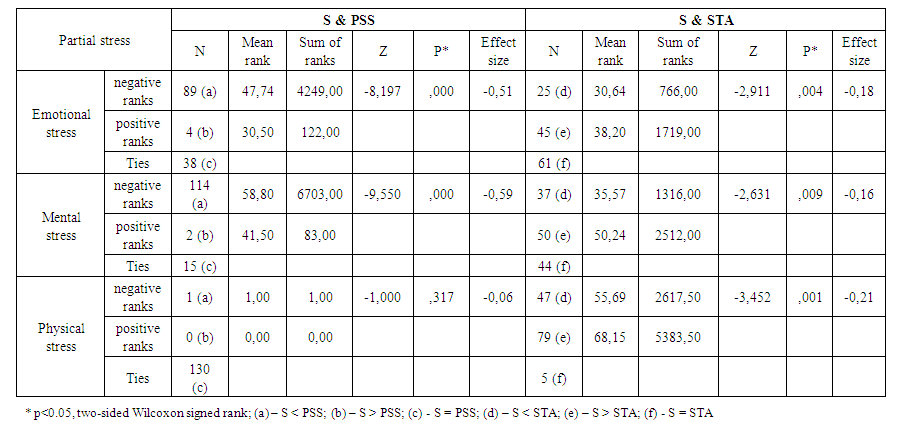 | Table 9. Comparison between PSS (stress before activity), STA (objective perceived stress of an activity) and S (stress after-activity) for Subtractions Test of Partial Stresses (N=131) |
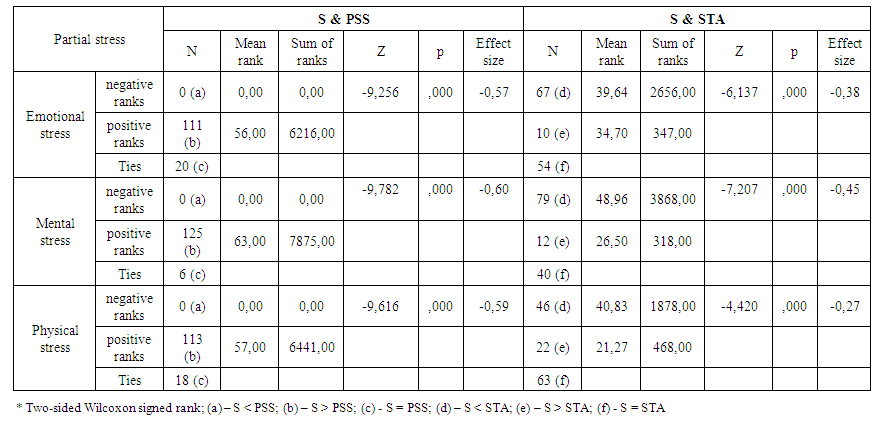 | Table 10. Comparison between PSS (stress before activity), STA (objective perceived stress of an activity) and S (perceived stress after-activity) for Relaxation of Partial Stresses (N=131) |
5.5. Comparison between Global Stresses
5.5.1. Using Total Stresses TPSS, TSTA and TS
- Table 11 shows data outcomes of median, mean and standard deviation of the variables PSS, STA and S for serial subtractions activity. We noted a statistically significant difference (p<0.001; two-sided Wilcoxon signed ranks) between S and PSS and between S and STA in terms of total (TPSS, TSTA and TS), negative (NPSS, NS) and positive stresses (PPSS, PS). In addition, the results show that, in terms of all cited variables, the value of S decreases comparing to PSS.
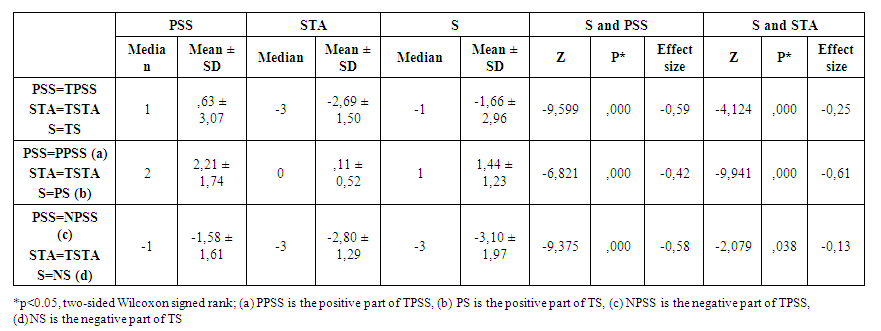 | Table 11. Comparison between PSS (stress before activity), STA (objective perceived stress of an activity) and S (stress after-activity) for Serial Subtractions in terms of Total, Positive and Negative Stresses (N=131) |
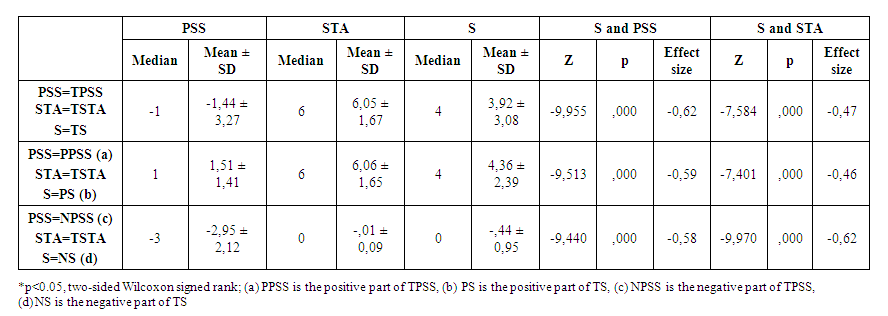 | Table 12. Comparison between PSS (stress before activity), STA (objective perceived stress of an activity) and S (stress after-activity) for relaxation in terms of Total, Positive and Negative Stresses (N=131) |
5.5.2. Using Global States of Stresses PSS_state, STA_state and S_state
- In addition to calculating total stresses (TPSS, TSTA and TS) we also used global state of stresses (PSS_State, STA_State and S_State), which are the concatenation of partial stresses (see heading “3.2.2. Combination of partial stresses”) and defined as nominal variables. The results showing the comparison between global stress states for serial subtractions and relaxation activities are presented in Table 13. As observed, by using two-sided Wilcoxon signed rank test, the variables S_state and PSS_state as well as S_state and STA_state are significantly different (p<0.05) each other for the 2 activities.
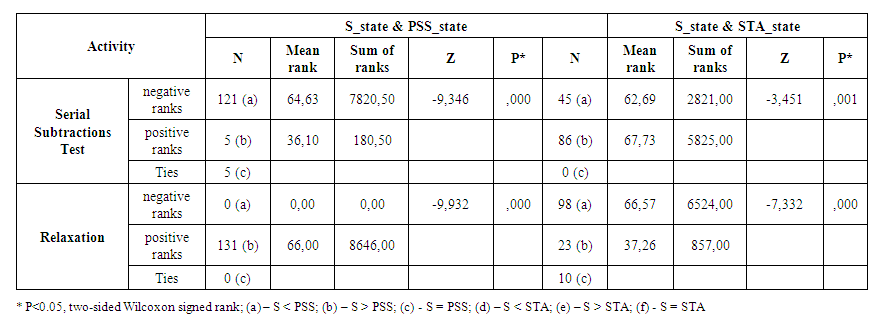 | Table 13. Comparison between Global States of Stress of PSS (stress before activity), STA (objective perceived stress of an activity) and S (stress after-activity) for Serial Subtractions and Relaxation Activities (N=131) |
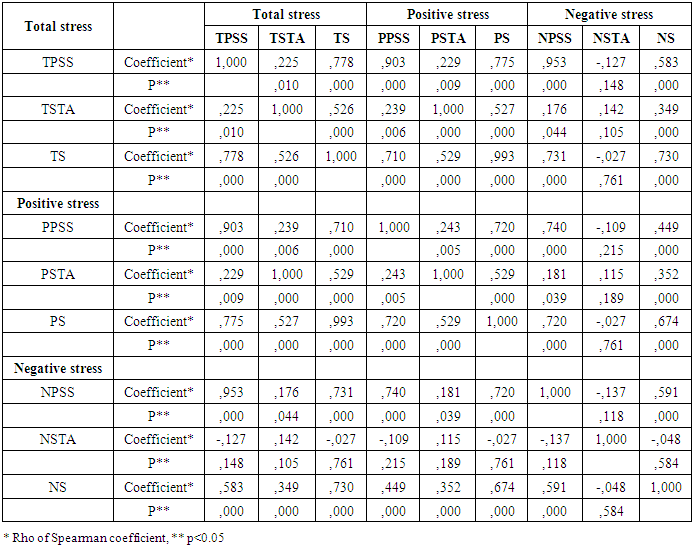
5.6. Correlation between S, PSS and STA
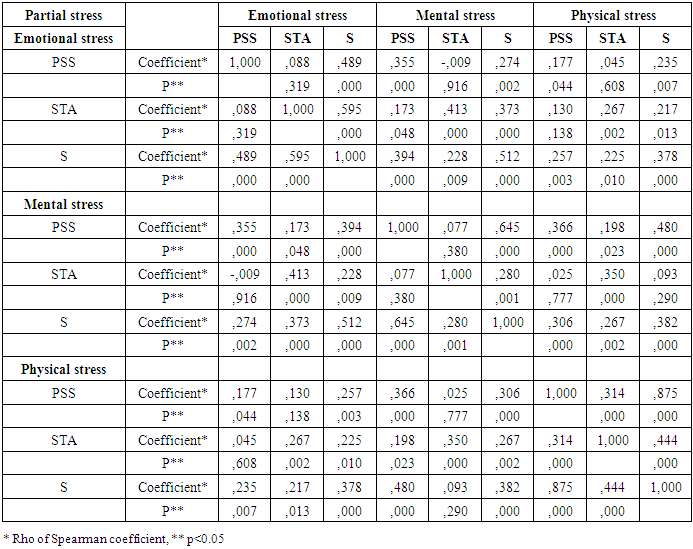
- Table 14 shows the associations between PSS, STA and S in terms of partial stresses for serial abstractions activity. The outcomes show that S is significantly positively correlated with PSS (p<0.001) and with STA (p<0.001), except between S (physical) and STA (physical) (p>0.05).
|
|
|
|
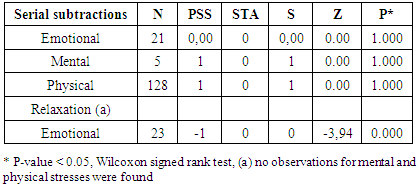
5.7. The Mutual Stress Effects between Partial Stresses
- We noticed from the measures collected from the participants that the intensity of a partial stress (emotional, mental or physical) before performing an activity (PSS) increases even if the perceived activity stress value is null (STA=0). Table 18 shows the medians of PSS and S of partial stresses when STA of one of them is null. No observations concerning mental and physical stresses for relaxation were found that correspond to STA=0. The results indicate that S and PSS of emotional stress (STA=null) of relaxation activity are significantly different. As for serial subtractions test, S and PSS (STA=0) are not statistically significant (p>0.05).
|
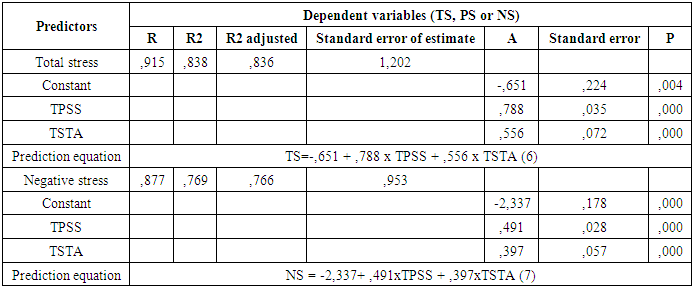
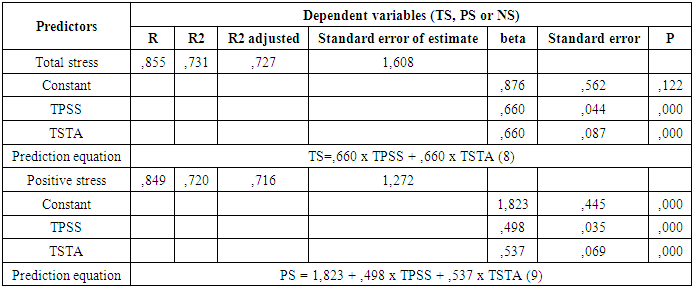
5.8. Multiple Linear Regression and Stress Formula Revision
- In order to estimate the contribution of TPSS and TSTA to the prediction of S (total stress, positive and negative stresses) for the 2 activities (serial subtractions test and relaxation), linear multiple regression analysis was conducted. The relationships between the dependent variables TS, NS or PS and the independent variables TPSS and TSTA are presented in Table 19 (serial subtractions) and Table 20 (relaxation).
|
|
5.8.1. The Comparison between the Observed and Predicted Values of Total, Negative and Positive Stresses
- In order to check for most suitable equations to predict the value of the state of stress after performing the 2 activities, we calculated the correlations coefficients between the observed and predicted values of the dependent variables TS, NS and PS (Table 21) and presented the equations’ corresponding plots (Figures 2 and 3).
|
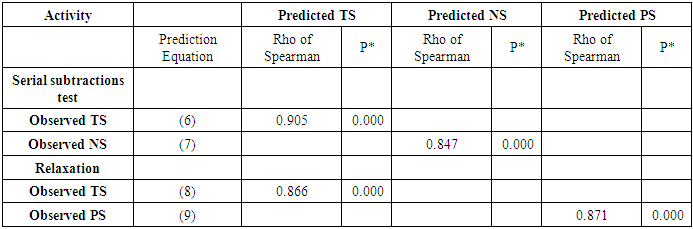
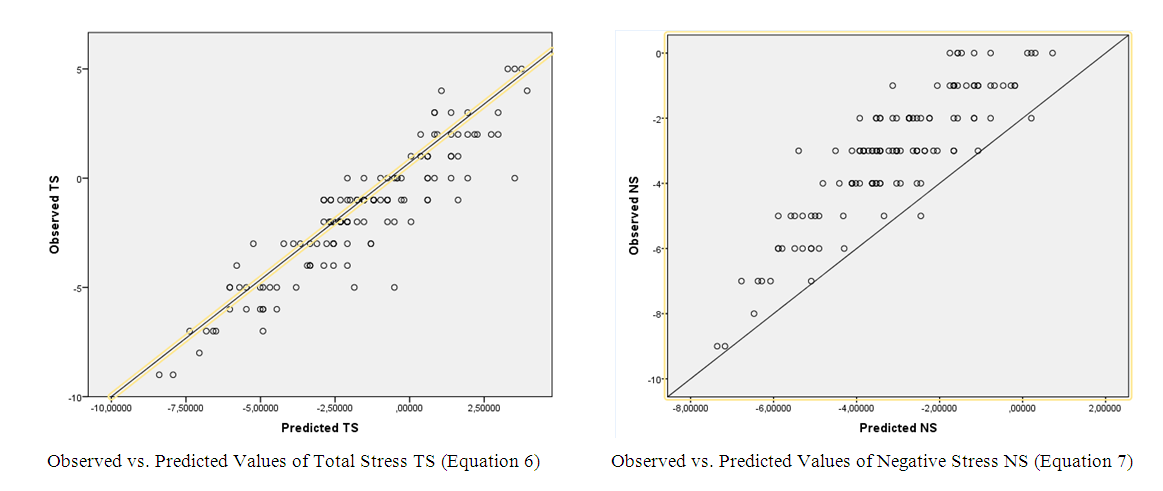 | Figure 2. The relationships between observed and predicted values of total and negative stresses for serial subtractions activity |
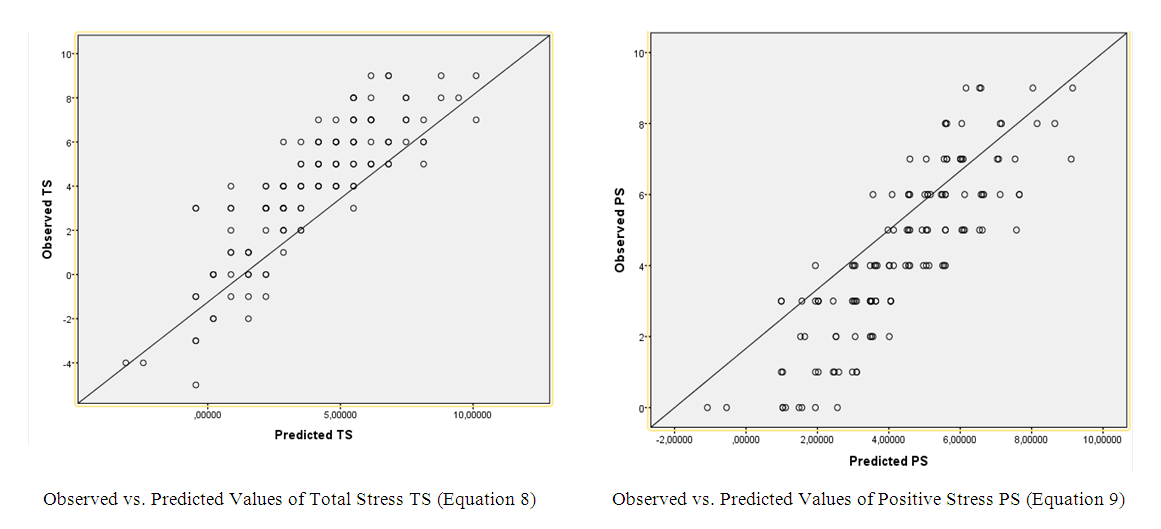 | Figure 3. The relationships between observed and predicted values of total and positive stresses for relaxation activity |
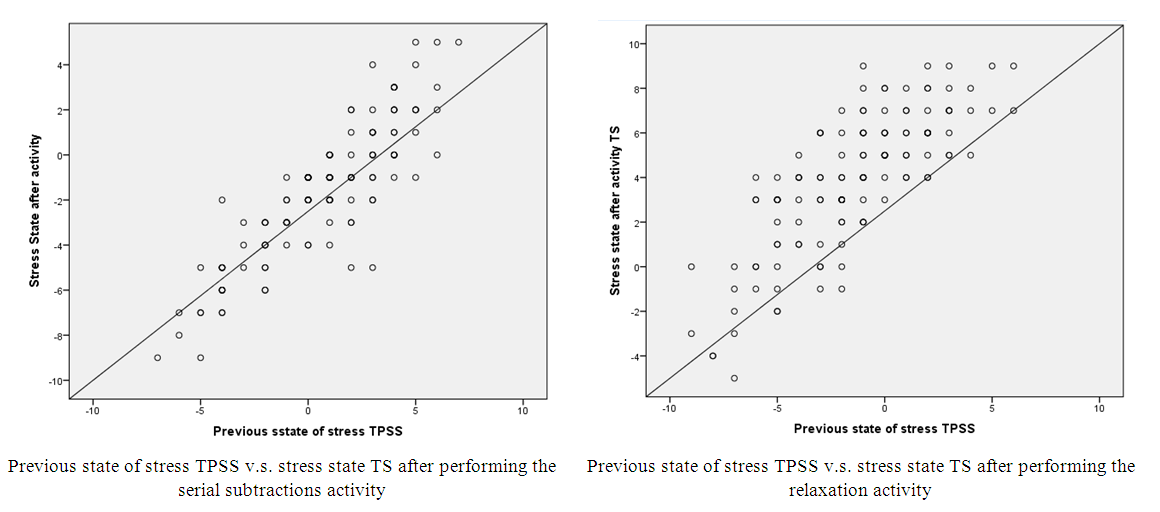 | Figure 4. The relationships between the total previous state of stress (TPSS) and the state of stress (TS) after performing serial subtractions and relaxations activities |
6. Discussion
6.1. The Objective Perceived Stress of Activities and Their Effects
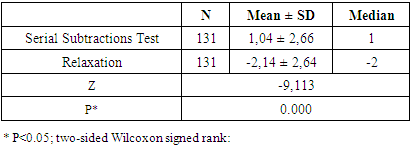
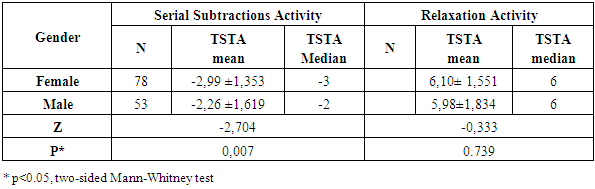
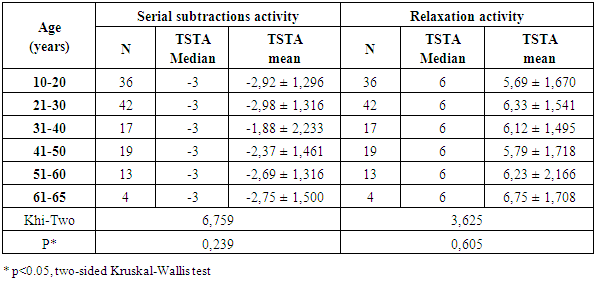
- A – The sign and effect of activitiesThe value -2,69 (Table 2) of the objective total perceived stress intensity TSTA of mental arithmetic activity, with negative and positive components (-2, 80 and +0,11), means that most participants perceived the serial subtractions test as a negative activity. This value is statistically significant (p<0.001: one sample Wilcoxon signed rank test) (Table 3). The effect of this mental activity on subjects was also found to be negatively statistically significant with a large effect size (-0,59): the stress variation is negative (TDif = -2,28: TS < TPSS; p<0,001) (Tables 2 and 11). The serial subtractions test is then a stressful activity that increases the state of stress of individuals. These findings are consistent with previous studies [22], [23], [24]. It was also reported that this type of task had been used hundreds of times to elicit stress in human subjects [31].As for relaxation activity, it was objectively perceived as a positive activity by most participants: TSTA = + 6,05 (N= - 0,01; P= +6,06) (Table 2). This value is statistically significant (p<0.001: one sample Wilcoxon signed rank test) (Table 3). Its impact on subjects is significantly positive with a large effect size (-0,62): the tress variation is positive (TDif = 5,36; TS > TPSS; p<0.001) (Tables 2 and 12). The 8 MN savasana-relaxation accompanied with soft music is then a positive activity, which reduces stress. These results are in line with prior researches. Santaella et al., in their study [32], showed that savasana-(relaxation) could be used as a strategy to treat hypertension, because it has positive effects on cardiac autonomic modulation of patients suffering from hypertension. Thomas also showed that a combination of soft music and relaxation techniques reduced anxiety and stress [29]. The significant differences in terms of absolute value (1,04: serial subtractions test; 2,14: relaxation) between TS and TSTA (TDif_STA) (Tables 2, 11 and 12) for the 2 activities means that an individual could distinguish between objective perception of the activity and the subjective perception of their state of stress generated by one of the 2 this activities. By comparing the 2 activities regarding TDif_STA (Table 4) and the standard deviations of the objective perceived stress TSTA (serial subtractions: -2,69 ± 1,50; Relaxation: 6,05 ± 1,67), we conclude that the objective participants’ perception is better for relaxation than the other activity. This is likely to be due to the fact that the physical aspect of the previous state of stress (PSS) didn’t change after the performance of the serial subtractions test. B – Gender and stress perception of activitiesFrom Table 5 we observe that the objective perception of the stress intensity (TSTA) of the 2 activities is only significantly different between females and males for the subtractions serial test. The objective stress perception of this activity depend then on gender. C – Age and stress perception of activitiesAs observed, the stress perception of the 2 activities is significantly independent on age (p>0.05) (Table 6).As we notice, the objective perceived stress intensity (TSTA) of serial subtractions test depends on gender and not on age, whereas TSTA of relaxation activity does not depend neither on gender nor on age. These findings prove that the stress perception of savasana-relaxation activity is objective and approximately constant among all participants. Objective perception of stimuli has common properties of perceiving stimuli within individuals [33]. This is also confirmed by the facts that: 1) the standard deviations of TSTA of relaxation (1,67) is lower than those of TPSS (3,27) and TS (3,08) (subjective perceptions) (Table 2); 2) the variation interval values (Max, Min) is large for TPSS and TS than for TSTA for relaxation; 3) The positive association between TS and TPSS is higher than that between TS and TSTA (Tables 15 and 17).
6.2. The Subjective Perceived Stress State Variation
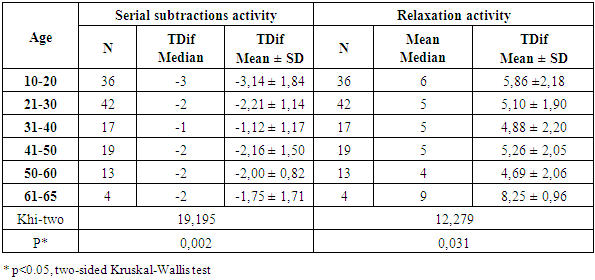
- A – Gender and stress variationFrom Table 7, we note that stress variation (TDif = TS – TPSS) of the mental arithmetic activity depends on gender. Females and males seem to be affected differently by this activity: The serial subtraction test makes women more stressed than men. This is also in accordance with the previous outcomes, in which the objective stress perception of the mental arithmetic is higher for female that men (Table 5). This is consistent with some previous researches. It was shown that women’ scores in chronic stress and minor daily stressors are greater than men’s [34]. In addition, some studies showed that women performance is in verbal ability, and men in mathematic tests [35]. Likewise, according to Girgla et al. (2015) [36], women don’t react as strongly as men during intellectual stress.As for relaxation, females were shown to use mind body therapies more successfully [36].B – Age and stress variationAccording to the results of Table 8, there are significant age differences in stress variation (TDif) for mental arithmetic task and Savanasa-relaxation. The serial subtractions test seems to make subjects aged between 10 and 21 years more stressed than the other groups and subjects aged between 31 and 40 the less stressed. As for the relaxation activity, there is significant differences between ages. The savasana-relaxation activity seems to make the persons aged more than 60 years old more relaxed the other ages. These findings are in contrast with a previous research: Ihle et al. [37] showed that relaxation had no effect on age. If TSTA represents the total objective perceived stress intensity of the activities (mental arithmetic and savasana), the stress variation TDif (TS – TPSS) could be in fact considered as the effect of the activity on subjects. TSTA and TDif are different (Table 2).
6.3. The Comparison between Partial Stresses
- From the outcomes of Tables 1 and 9, we observe that the values S of emotional and mental state stresses measured after carrying out the mental mathematical task are significantly (p<0.001) different from the previous stress state values (PSS) with large effect sizes. We conclude that S depends on PSS for emotional and mental stresses. The serial subtractions task has then a negative effect on emotional and mental aspects of stress. S is also significantly different than STA for all partial stresses, but with a small effect size. As for physical stress, S is not significantly different than PSS (p>0.05), which is evident since the mathematical task had not an effect on the participants’ body aspect of stress. This task was not perceived physically tiring, which leads the participants, after performing the activity, to maintain their body state of stress. As for relaxation activity (Tables 1 and 10), data outcomes showed that the state of stress (S) that the subjects experienced for all partial stresses after been relaxed for 8 MN is significantly different than PSS (before relaxation) and STA (relaxation). S depends then on PSS and STA for relaxation for all partial stresses.Comparing between the 2 activities, S is different than PSS and STA in terms of emotional and mental aspects of stress for relaxation with a large effect size and also for the mental arithmetic activity, but with a small effect size. If this was caused by the confusion in perception between S and STA that some of the participants might have made for serial subtractions test, we also found that the objective participants’ perception was better for relaxation (TDI_STA = 2,14) than the other activity (TD_f_STA = 1,04) (see heading “6.1. The objective perceived stress of activities and its effects”).
6.4. The Comparison between Global Stresses
- The results (Tables 11, 12 and Table 13) corresponding to mental arithmetic test and relaxation activities showed that for global stresses (total stresses, global state stresses, positive stresses and negative stresses) there is a simultaneous relationship between S and PSS (TS and TPSS, PS and PPSS, NS and NPSS, S-state and PSS-state) (p<0.001) and between S and STA (TS and TSTA, PS and TSTA, NS and TSTA, S-state and STA-state) (p<0.05). The first hypothesis is then confirmed in terms of global, positive and negative stresses for the two activities.The negative stressor represented by the serial subtractions activity has a negative effect on the previous state of stress (TPSS) and its positive and negative components (PPSS, NPSS): The values of TPSS and its components have decreased (stress increasing) (e.g. Figure 5) (tables 2 and 11). Thus, the second hypothesis is confirmed for total, positive and negative stresses.
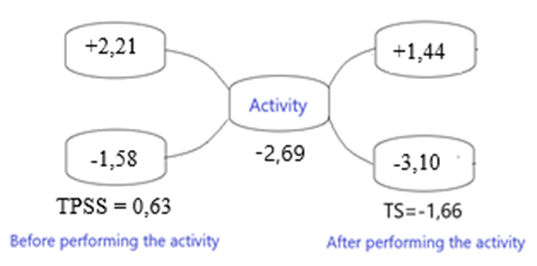 | Figure 5. The Negative Effect of Serial Subtractions Test on Total, Positive and Negative Stresses |
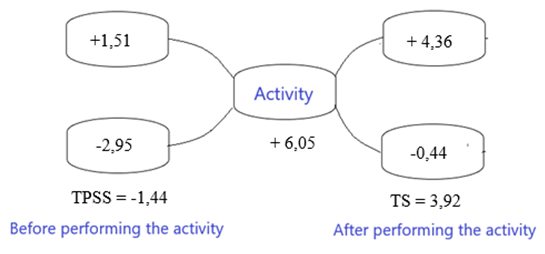 | Figure 6. The Positive Effect of Savasana-Relaxation on Total, Positive and Negative Stresses |
6.5. The Effect of the 2 Activities on Partial Stresses
- After performing the activity of serial subtractions test, the subjects’ previous state of stress value (PSS) declined significantly for emotional and mental stresses (Table 1 and Table 9). This test seems to make the individuals emotionally and mentally stressed. In their study, using serial subtractions test with 2 and 3 digit, Carter et al. suggested that mental arithmetic generated strong negative emotions because of the aversive circumstances [38].As for the relaxation activity, it has positive effects on the 3 aspects of an individual state of stress. It appears that a short savasana-relaxation (8 MN) accompanied by soft music makes individuals mentally, emotionally and physically less stressed. Khan et al. reported in their study [39] that yoga practice helped patients to relax their tensed muscles and to relieve their mental and emotional stresses.
6.6. Association between Partial and between Total Stresses
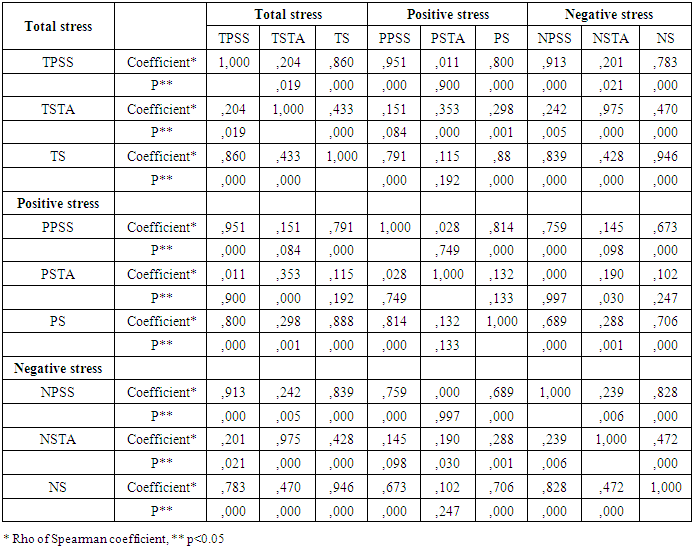
- From the results of the associations between partial stresses (Tables 14 and 16) and between total, positive and negative stresses (Tables 15 and 17) we notice that the stress value S measured after performing an activity (serial subtractions test and relaxation) is positively and significantly associated with the previous state of stress (PSS) with a positive correlation coefficient Rho that ranges from 0.622 to 0.999 for serial subtractions test and from 0.489 to 0.875 for relaxation activities. This suggests that an increase in PSS is related to an increase in S. The value 0.999 represents the correlation coefficient between S and PSS in terms of physical stress, which remains unchanged during the mental arithmetic activity. These findings confirm the hypothesis 4, which represents the strongest empirical evidence of taking PSS into account to predict the resulting stress state (see heading “1. Introduction”). The association between S and PSS is higher than the association between S and STA for the 2 activities. This is consistent with the fact that the objective perceived stress intensity (TSTA) of the activities didn’t vary a lot. Besides, we found that the standard deviation of TSTA is less than the standard deviation of TPSS concerning the 2 activities (activity 1: 1,50 vs 3,07; activity 2: 1.67 vs 3.27) (Table 2). As if the perceived stress values of the 2 activities are the same for all participants. This is consistent with the results of Tdif_STA (TS - TSTA) (see heading “6.1. The objective perceived stress of activities and its effects”) and with the fact that the perception of TSTA is objective and not subjective.
6.7. Mutual Effects between Partial Stresses
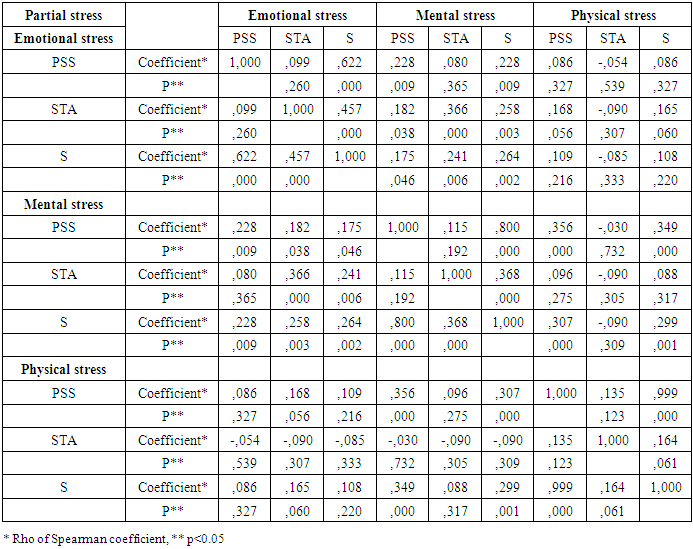
- According to data of Table 18, showing the results of mutual effects of partial stresses, we found that the state of stress intensity of emotional stress increases significantly after performing the activity of relaxation even if its value of STA is null. This result is an evidence that emotional stress is likely to be influenced by positive mental and/or physical stresses. This finding is also corroborated by the significant and positive associations between emotional and other partial stresses in terms of S and STA (S: Rho=0,512 with mental stress and Rho=0,378 with physical stress; STA: Rho=0,413 with mental stress and Rho=0,267 with physical stress). This is also in line with the findings of other researches. Andersson et al. found in their study [15] that there were correlations between different aspects of stress, especially in mental and emotional stress.
6.8. Linear Multiple Regression and Revision of the Previous Stress Formula
- From the results of multiple linear regression corresponding to serial subtractions test (Table 19) and relaxation (Table 20), we noticed that the subjective state of stress engendered after performing an activity (S: dependent variable) could be predicted by the previous state of stress (PSS: independent variable) and the objective perceived intensity of an activity (STA: independent variable) in terms of total, positive and negative stresses.A. Serial subtractions activity A – 1 The prediction of total stress TS Table 19 revealed that the total stress generated after performing the serial subtractions task can be predicted by the combination of the subjective total previous state of stress TPSS and the objective perceived intensity of this activity TSTA with high percentage (83,8 %). The predicted values of TS using the corresponding equation (6) are very close to the observed values (Figure 2). TS depends then on TPSS and TSTA: the fifth hypothesis is then confirmed for serial subtractions test in terms of total stress.By using the equation (6), if we replace TSTA by its mean value (-2,69) (Table 2) we notice that if a subject is not previously emotionally, mentally and physically stressed (TPSS=0), his/her perceived state of stress of the serial subtractions activity would be negative with the value of -2,15. This value is approximately equal to the value of STA mean.A – 2 The prediction negative stresses Instead of predicting the value of the total stress TS, it is also very important to predict its positive (PS) and especially its negative (NS) components. This allowed us to know the variation of positive (PPSS) and negative (NPSS) elements of TPSS under the effect of the 2 activities. The negative part of TPSS is, in fact, the subjective feeling of stress from which suffers a subject.From Table 19, we notice that, using TPSS and TSTA to predict the negative component of TS, the standard error of estimate decreases from 1,202 to 0,953. In addition the value of R-squared (0,838) remained approximately the same (0.769). The corresponding equation is (7). If we compare the equations (6) and (7) and their corresponding plot (Figure 2), we notice that the equation (6) is more suitable. The total stress can be predicted better than if we predict only its negative component NS. Thus, the dependent variable NS depends on TPSS and TSTA. The fifth hypothesis is then confirmed for serial subtractions test in terms of negative stress.B - Relaxation activityB – 1 The prediction of total stress TS Table 20 shows, as in the case of the first activity, that the contribution of the 2 variables TPSS and TSTA explain the variation of TS with a higher R-squared (0.731) and a standard error of estimate (SEE) of 1.608. The corresponding equation is (8).The figure 3 that represents the relationships between the observed and predicted values of TS for relaxation, shows that using the equation (8), the scatter points are more close to the regression line.By using the equation (8), if TSTA is equal to its mean value of 6,05 (Table 2), the state of stress score that a previously not stressed subject (TPSS=0 for all partial stresses) experiences after performing the activity of relaxation, would be 4,00. TS depends then on TPSS and TSTA: the fifth hypothesis is then confirmed for relaxation in terms of total stress.B - 2 The prediction of positive stress Table 20 shows that the positive component of total stress (PS) can be predicted by TPSS and TSTA. The corresponding equation is (9). As in the case of the first activity, we notice that the standard error of estimate decreases (from 1.608 to 1.272) and R2 remains approximately the same (from 0.731 to 0.720).In Figure 3 (observed v.s. predicted values), we observe that the scatter points are also not very dispersed from the regression line when we use the equation (9).Thus, the dependent variable PS depends on TPSS and TSTA. The fifth hypothesis is then confirmed for relaxation in terms of positive stress.C – The comparison between the 2 activitiesThe prediction Equations (6) and (8) corresponding to the 2 activities showed that the contribution (coefficient A) of the objective perceived stress intensity of an activity (TSTA) is higher for relaxation (0,660) than for the first activity (0,556). This was probably due to the fact that the physical aspect of the mental arithmetic activity had no effect: S (physical) and PSS (physical) are not different, p>0.05 (Table 9). There also exist positive associations and mutual effects between partial stresses in relaxation, whereas there is no effect between them in subtractions test (Table 18).We chose to study the prediction of NS for serial subtractions test and PS for savasana-relaxation, because we found that their multiple linear regression assumptions were not violated. As a matter of fact, predicting the positive stress PS for relaxation and the negative stress NS for serial subtractions is more convenient and suitable. This latter activity has a negative effect on individuals and it would be more important to know the resulting negative stress that decreases and represents the great value of TS. As for savasana-relaxation, which has a positive effect on subjects, the positive part of TS (PS) increases and would represent the great value. Thus, it is then more suitable to predict the total stress (TS) for the 2 activities (equations (6) and (8)) and the positive stress (PS) for savasana-relaxation (equation (9) and the negative stress (NS) for serial subtractions task (equation (7)).D - The new structure of the stress formulaAs we noticed, the value S of the stress state experienced by an individual after performing one of the 2 activities, could not be exactly predicted by the equation (S = PSS + STA) we have proposed in the previous research [1] and which was used only for one stimulus and not for an activity (set of stimuli). From the equations resulted from the linear multiple regressions, we could deduce the following:1) If we want to predict the total stress TS by using the total previous state of stress (TPSS) and the total objective perceived stress of one of the 2 activities (TSTA), the new structure of the stress formula is replaced by the equations (10):
 | (10) |
 | (11) |
 | (12) |
6.9. Limitations of the Study
- The limitations of the study are that the sample was a non-probability and its size was not very large. The inclusion and exclusion criteria made the experiment not possible for some types of individuals, which reduced the possibility to make everyone perform the 2 activities.
7. Conclusions
- From this study we conclude the following:1- The assessment of the state of stress has to be made by taking into account its 3 aspects: emotional, mental and physical;2- A 5 MN Serial subtractions test is a stressful activity. It has a negative effect on the previous state of stress and increases stress of individuals;3- An 8 MN savasana-relaxation accompanied with soft music is a positive activity. It has a positive effect on the previous state of stress and reduces stress of individuals;4- The new dimension PSS (subjective previous state of stress) suggested in our Tri-Transactional theory of stress [1] has to be considered in the assessment of the resulting stress state value of an individual who faces a number of stimuli during an activity;5- The objective perceived stress intensity (TSTA) of an activity (serial subtractions test, relaxation) does not depend on the previously subjective perceived state of stress of an individual (PSS); 6- The value of the subjective total state of stress (TS) experienced by an individual after performing one of the 2 activities depends on his/her subjective total perceived state of stress (TPSS) and the objective total perceived value of an activity (TSTA). The value of TS or its positive and negative components could be predicted by the equations cited above, which are the revised version of the stress formula introduced in our previous study (S =PSS +STA) [1]:7- The equations (6) and (8) are more suitable to predict the state of stress experienced after performing the serial subtractions and savasana-relaxation activities respectively;8- The equation (7) is more suitable to predict the negative state of stress experienced after performing the serial subtractions activity;9- The equation (9) is more suitable to predict the positive state of stress experienced after performing the savasana-relaxation activity;Thus, the findings of the present empirical study is an evidence of the validity of the Tri-Transactional stress theory [1] applied to 2 types of activities. However, due to the small sample used we have to be cautioned and further studies using large samples would be very important.In order to check the validity of our new Tri-Transactional theory of stress for other activities, we suggest further studies, in which - We recruit a large sample size of participants (females and males). This will allow us to determine exactly the objective perceived value of the activities.- We use the same activity by varying its duration. Because, we assume that the activity effect depend also on its duration;- We use a great number of different activities. This will allow us to have in the future a list of many activities and their objective coefficients.From the theoretical study [1] and the present empirical research, we suggest the following definition of stress:“Stress is the product of the interaction between the subjective state of a subject, his/her objective evaluation of the environment and the coping strategy used to cope with it”.
ACKNOWLEDGEMENTS
- I would like to thank the administration of the Institute of Nursing Professions and Health Techniques, Rabat, Morocco, its departments, the participants in this research (professors and students of ISPITS, my friends and my family). I would also like to express my deepest appreciation to all those who have provided me with support, scientific knowledge and encouragement.