-
Paper Information
- Paper Submission
-
Journal Information
- About This Journal
- Editorial Board
- Current Issue
- Archive
- Author Guidelines
- Contact Us
International Journal of Applied Psychology
p-ISSN: 2168-5010 e-ISSN: 2168-5029
2019; 9(5): 117-127
doi:10.5923/j.ijap.20190905.01

A Nationwide Study on Subjective Well-being Scale for Chinese Citizens (SWBS-cc)
 Abstract
 Reference
 Full-Text PDF
 Full-text HTML
1Centre for Quality of Life and Public Policy Research, Shandong University, Jinan City, P.R.China
2School of Political Science and Public Administration, Shandong University, Jinan City, P.R.China
Correspondence to: Zhanjun Xing, School of Political Science and Public Administration, Shandong University, Jinan City, P.R.China.
| Email: |  |
Copyright © 2019 The Author(s). Published by Scientific & Academic Publishing.
This work is licensed under the Creative Commons Attribution International License (CC BY).
http://creativecommons.org/licenses/by/4.0/

In previous studies, the subjective well-being scales for Chinese citizens (SWBS-cc) including 54 and 40 items had been developed based on Chinese cultural background. These scales were applied to a sample of Shandong province, and also to another sample of six capital cities in mainland China. A brief scale consists of 20 items was developed to satisfy large-scale interview survey. Sampling from the whole country (the sample size is 5946) through CGSS, the psychometric properties of SWBS-cc20 were examined. The scale shows good reliability and validity. The standard norm sample was expanded on the whole country, and the nationwide norm of SWBS-cc20 was achieved. A more refined scale SWBS-cc including 6 items was developed for telephone survey.
Keywords: Subjective well-being, Psychological testing, Norm, Telephone survey
Cite this paper: Liqing Huang, Zhanjun Xing, A Nationwide Study on Subjective Well-being Scale for Chinese Citizens (SWBS-cc), International Journal of Applied Psychology, Vol. 9 No. 5, 2019, pp. 117-127. doi: 10.5923/j.ijap.20190905.01.
Article Outline
1. Introduction
- The research on subjective well-being measures appeared in the mid-20th century along with the research of quality of life. Researchers from different cultures developed some important instruments to measure subjective well-being (Bradburn and Caplovitz, 1965; Kozma and Stones, 1980; Diener et. al., 1985; Ryff and Singer, 1996; Stones et.al., 1996; Diener et. al., 1996; Cummins, 1996; Luo, 1998; Xing, 2002,). According to Kahneman and Krueger (2006), it is difficult to measure a single, unifying concept that registers all humans’ relevant feelings and experiences. Therefore, it is necessary to investigate people's subjective well-being experience in different cultural backgrounds. In previous studies, a 54 items subjective well-being scale for Chinese citizens (SWBS-cc54) and a brief one including 20 items (SWBS-cc20) for large-scale investigation from Chinese cultural background had been developed (Xing, 2002; Xing, 2003). A revised 40 items SWBS-cc was also developed through a large-scale interview survey research from six capital cities in mainland China (Xing, 2009). The SWBS-cc was developed through the view point of psychological experience. According to this view point, subjective well-being is people’s subjective experience of their objective existence. Those people with higher subjective well-being have positive or greatly satisfying experience in their existence status. Subjective well-being could be used as an index to evaluate whether a person lived normally and at which degree the normal person achieved in matter and spirit. The former indicated people’s psychological experience of physical and mental health, and the later indicated people’s psychological experience of enjoyment and development (Xing, 2009). A number of studies have showed that SWBS-cc had good psychometric properties when applying to Chinese urban and rural residents and also some special groups, such as the aged, the young people, the women, the college students, the post-graduates, the college and middle school teachers, the Christians, the commercial bank employees, and so on (Xing, 2003; Huang, 2004; Zhang and Xing, 2005; Chen and Chen, 2005; Xiao and Ding, 2008; Liao and Xing, 2009; Guo, B. et. al., 2011; Xing and Chu, 2012; Yang, L. et. al., 2015). A meta-analysis study re-analyzed the results of some researches in which the SWBS-cc20 was applied to the college students from 2004 to 2008, and drew some important conclusion (Dong, J. et. al., 2014). The results of SWBS-cc’s being applied to a sample of six capital cities in mainland China had been reported (Xing, 2009), but it was not really a nationwide research. So it is necessary to examine the psychometric properties of SWBS-cc when applied to the whole country, and the national norm of SWBS-cc remains to be established. Moreover, the SWBS-cc20 is still not suitable for telephone survey as the length problem, and this research would also explore to develop a more refined subjective well-being scale for telephone survey research.
2. Method
2.1. Sampling and Procedure
- The investigation was carried out through Chinese General Social Survey (CGSS) in 2012. The CGSS is the best interview survey project in mainland China which was jointly launched by the Renmin University and the Survey Research Center of Hong Kong University of Science and Technology in 2003. Since then, CGSS has come through three different sampling designs and used three sets of sampling frames: 2003-2006, 2008, and 2010-present. The sampling design made in 2010 used 2009 national population data as sampling frame. 2010 sampling frame was a multi-stage stratified design including three sampling stages: the primary sampling unit (PSU) was at county-level, and 2762 PSUs were selected in this stage; the secondary sampling unit (SSU) was at community-level (villages [cun] and neighborhood committees [ju wei hui]); In selected SSU, 25 households (TSUs) were sampled with PPS method; In each selected household, age 18 and above adult were sampled with Kish grid. The total sample size of 2010 designs was 12,000 households (CGSS, 2015). The distribution of 2010 selected PSUs was as figure 1.
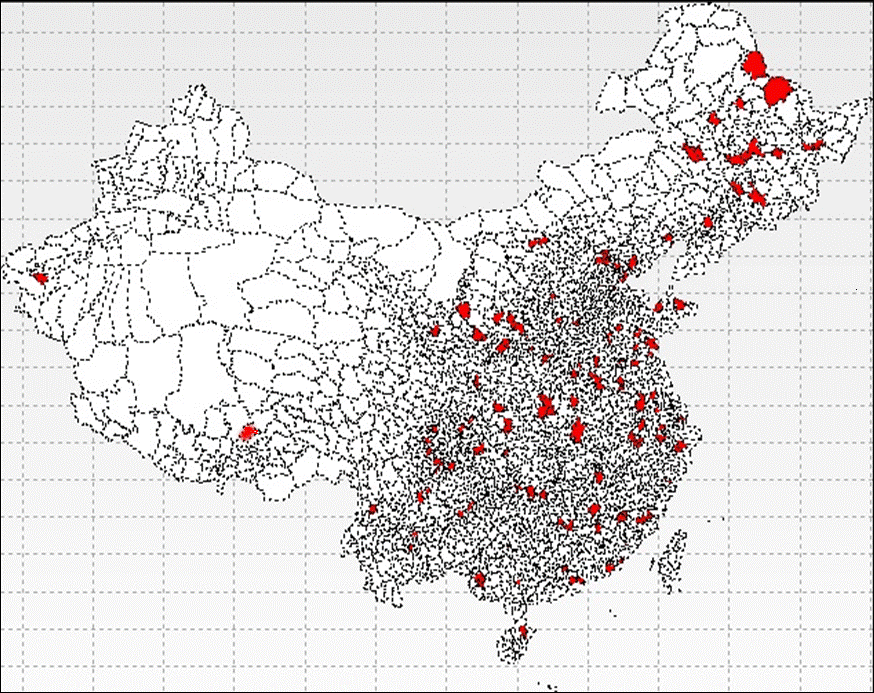 | Figure 1. PSUs of the CGSS since 2010 (quoted in the CGSS website: http://www.chinagss.org/index.php?r=index/sample) |
2.2. Description of the Sample
- According to the sampling procedure, the final sample size of 2012 investigation was 5,946 peoples. The main demographic characteristics of the sample were as follows: Gender: male, 3095 (52.1%); female, 2851 (47.9%). Age: 18-25 years old, 477 (8.0%); 25-35 years old, 874 (14.7%); 35-45 years old, 1234 (20.8%); 45-55 years old, 1203 (20.2%); 55-65 years old, 1188 (20.0%); 65 years old and above, 970 (16.3%). Education: elementary school and below, 2228 (37.5%); junior middle school, 1660 (27.9%); senior higher school, 1125 (18.9%); junior college, 491 (8.3%); undergraduate college and above, 442(7.4%).The sample was randomly divided into two subsamples through SPSS case selecting procedure to develop a refined SWBS-cc for telephone survey. Subsample1 (including 2980 respondents) was used to item selection, and subsample 2 (including 2966 respondents) was used to examine the psychometric properties of the new scale. The main demographic characteristics of subsample1 were as follows: Gender: male, 1554 (52.1%); female, 1426 (47.9%). Age: 18-25 years old, 238 (8.0%); 25-35 years old, 435 (14.6%); 35-45 years old, 604 (20.3%); 45-55 years old, 608 (20.4%); 55-65 years old, 592 (19.9%); 65 years old and above, 503 (16.9%). Education: elementary school and below, 1128 (37.9%); junior middle school, 838 (28.1%); senior higher school, 549 (18.4%); junior college, 241 (8.1%); undergraduate college and above, 224 (7.5%). The main demographic characteristics of subsample 2 were as follows: Gender: male, 1541 (52.0%); female, 1425 (48.0%). Age: 18-25 years old, 239 (8.1%); 25-35 years old, 439 (14.8%); 35-45 years old, 630 (21.2%); 45-55 years old, 595 (20.1%); 55-65 years old, 596 (20.1%); 65 years old and above, 467 (16.7%). Education: elementary school and below, 1100 (37.1%); junior middle school, 822 (27.7%); senior higher school, 576 (19.4%); junior college, 250 (8.4%); undergraduate college and above, 218 (7.3%).
2.3. Instruments
- SWBS-cc20. It contains 20 items in ten dimensions, and the respondents were required to respond to each item with a 6-grade selection (Xing, 2003; Xing, 2009). The ten subscales were as follows: experience of satisfaction and abundance (ESAb), experience of mental health (EMH), experience of confidence towards society (ECS), experience of growth and progress (EGP), experience of goal and personal value (EGPV), experience of self-acceptance (ESAc), experience of physical health (EPH), experience of psychological balance (EPB), experience of adaptation to interpersonal relation (EAIR), experience of family atmosphere (EFA).Singer-item self-report SWB scale (SISRSWBS). The scale contains only one question: “Overall, I am a happy people”. The respondents were required to respond with a 7-grade Likert-style selection.
3. Results
3.1. The Psychometric Properties of SWBS-cc20
3.1.1. Internal Consistency Reliability
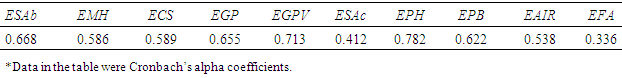
- Using the data onto a nationwide sample of the mainland China, this research examined the internal consistency reliability of SWBS-cc20 and its ten subscales. The results showed that the full scale and most of subscales have favorable reliability. The Cronbach’s alpha coefficient of the full scale was 0.831, and the Cronbach’s alpha coefficients of the subscales were above 0.50 except for subscale 6 and subscale 10 (see Table 1).
|
3.1.2. Criterion Validity
- Pearson correlation coefficients between the scores of the full SWBS-cc20 (including the scores of its subscales) and the scores of SISRSWBS were used as criterion index. The criterion validity of SWBS-cc20 applied to this nationwide sample was 0.473. All of the correlation coefficients between the subscales scores and the SISRSWBS scores were significant at 0.000 levels (see Table 2), which means that the SWBS-cc20 and its subscales showed favorable criterion validity.
|
3.1.3. Structural Validity
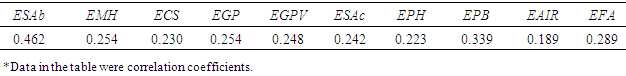
- Based on the former theory hypothesis and empirical exploration, a model of Chinese citizens’ subjective well-being was putting forward. According to the model, the structure of Chinese people’s subjective well-being might be regarded as two basic components (see Figure 2). The first principal component was the experience of mental and psychological health (EMPH) which included EAIR, EMH, EGPV, EPB, and, EPH. The second principle component was the experience of satisfaction and growth (ES & G) which included EFA, ECS, EGP, ESAb and ESAc.
 | Figure 2. The structural model of Chinese people’s subjective well-being |
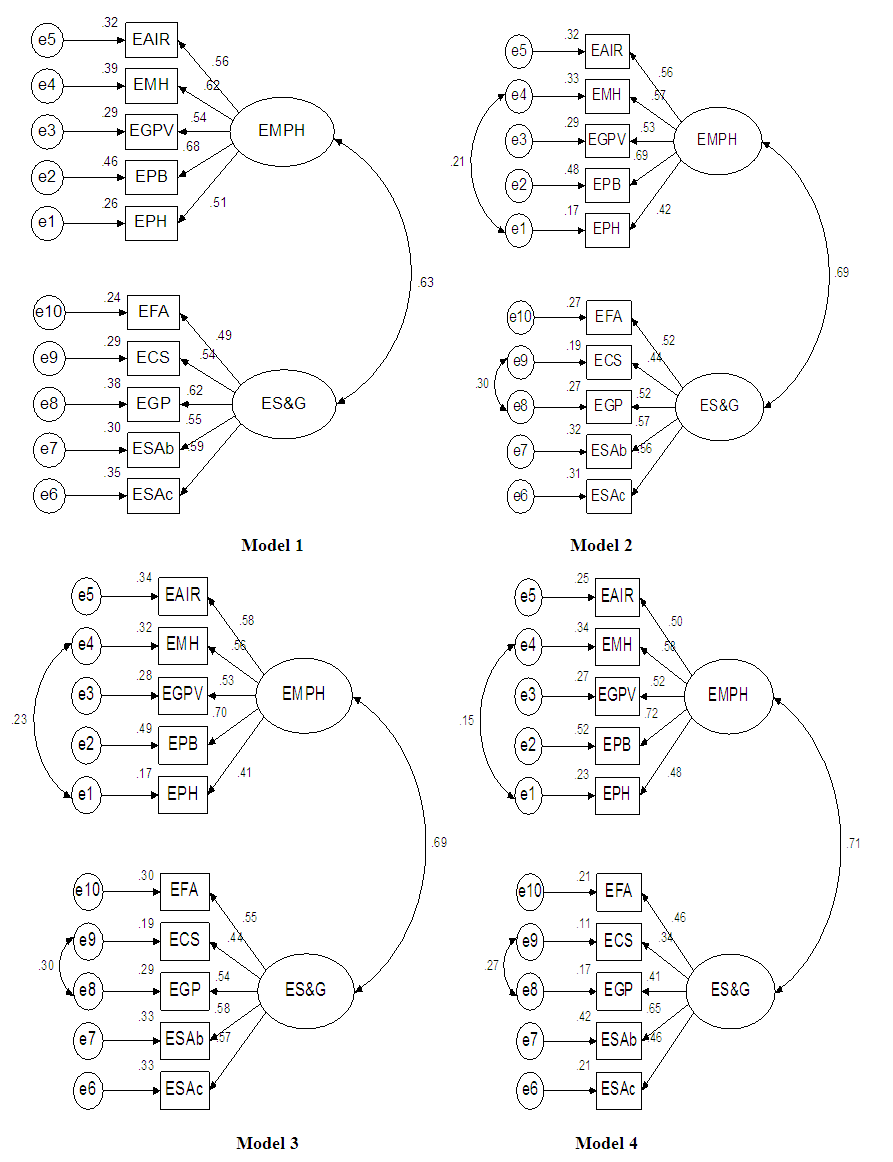 | Figure 3. The Parameters of the four Models |
|
3.2. The Nationwide Norm of SWBS-cc20
3.2.1. The Full Population Norm of SWBS-cc20
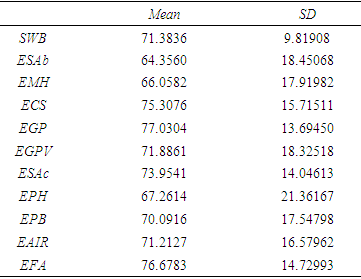
- According to the age distribution of China’s sixth census, and sett the age group of the lowest number as baseline, a nationwide standard norm sample was achieved from the full sample of randomly selection procedure. The sample size of norm sample was 2438 peoples, and the demographic characteristics of the samples were as follows: Gender: male, 1264 (51.8%); female, 1174 (48.2%). Age: 18-25 years old, 390 (16.0%); 25-35 years old, 463 (19.0%); 35-45 years old, 561 (23.0%); 45-55 years old, 415 (17.0%); 55-65 years old, 341 (14.0%); 65 years old and above, 268(11.0%). Education: elementary school and below, 721 (29.6%); junior middle school, 692 (28.4%); senior higher school, 515 (21.4%); junior college, 245 (10.1%); undergraduate college and above, 187 (7.7%). Through the nationwide standard normal sample, the SWBS-cc20’s norm of adult residents in the whole country was obtained. The mean score of the full scale were 71.38 (the total score is 100), and the standard deviation were 9.82. Table 4 showed the descriptive statistics of SWBS-cc’s ten subscales.
|
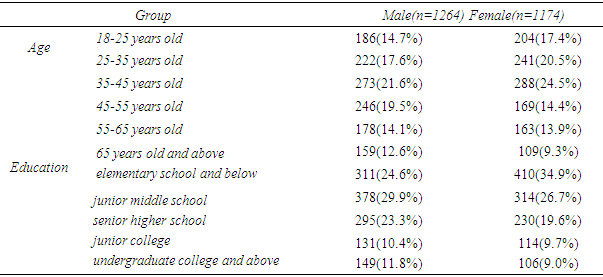
3.2.2. The Gender Norm of SWBS-cc20
- The standard norm sample was divided into two subsamples by gender. The sample size of male norm sample was 1264 peoples, and the sample size of female norm sample was 1174 peoples (table 5). Table 6 showed the gender norm of SWBS-cc20. An independent-samples T tested found there were no difference in the full scale score of the male and the female. The male scored higher than the female in subscale EMH and EPH ( t = 5.600, p = 0.000; t = 4.329, p=0.000), while the female scored higher than the male in subscale ESAb ( t = - 0.330, p = 0.001).
|
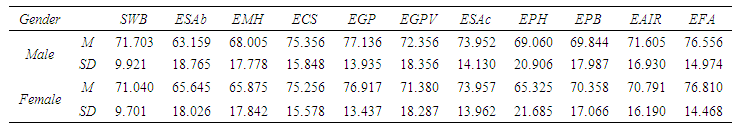 | Table 6. The gender norm of SWBS-cc20 |
3.2.3. The Age Norm of SWBS-cc20
- The standard norm sample was divided into six subsamples by age. The sample size of each age norm sample was 390, 463, 561, 415, 341 and 268 peoples respectively. An independent-samples T test found there were no difference in the full scale score of the male and the female. Table 7 showed the distribution of each age norm sample of gender and education. Table 8 showed the age norm of SWBS-cc20, and figure 4 showed the trends of the mean scores of SWB and its ten subscales with age. From figure 4 we could find that the mean scores of SWB, EGP, EPH and EAIR showed obvious decline with age, whereas the mean scores of ESAb and EMH showed an approximate U-shape across age groups.
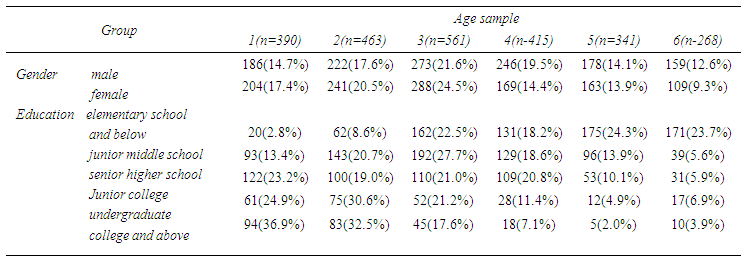 | Table 7. The distribution of age norm sample on gender and education |
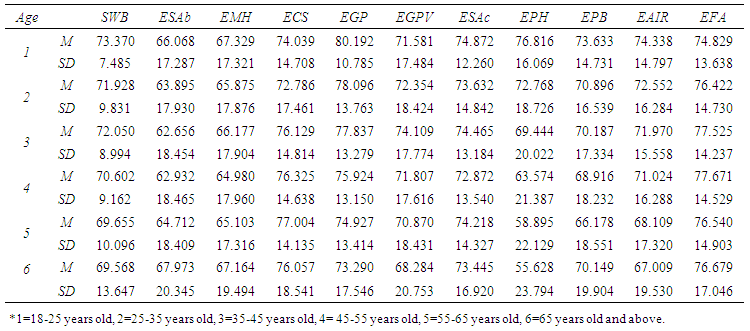 | Table 8. The age norm of SWBS-cc20 |
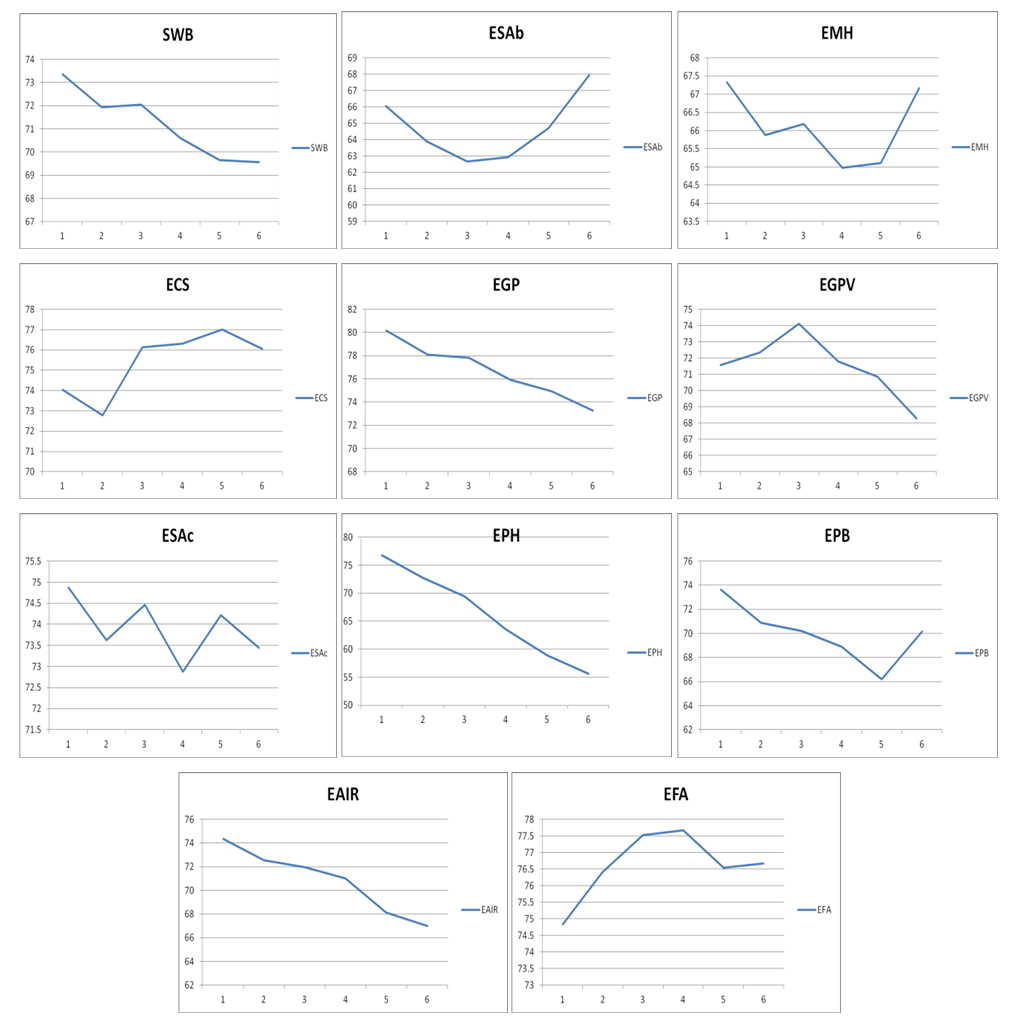 | Figure 4. The distributions of SWB and its ten subscales with age group |
3.3. Development of a Refined SWBS-cc for Telephone Survey
3.3.1. Item Analysis and Development of SWBS-cc6
3.3.1.1. Item Discrimination Analysis
- Item-total correlation coefficients were used to examine the discrimination of each item in SWBS-cc20. The item selection criterion was as follows: (1) Item scores and the full scale score (Ri-SWB) relate significantly;(2) The correlation coefficient between item scores and subordinate dimension score (Ri-EMPH or Ri-ES&G) is above 0.50;(3) The correlation coefficient between item scores and its subordinate dimension score is far higher than the correlation coefficient between item score and the other dimension scores. The absolute value of the difference between the two correlation coefficient (|Ri-EMPH-Ri-ES&G|) are greater than 0.25. Subsample 1 (n = 2980) was used to carry out discrimination analysis. Table 9 showed the information on discrimination analysis. All of the correlation coefficients between item score and the full scale score of the table reached statistically significant (p = 0.000, two-tailed test). But in dimension ES&G, the correlation coefficient between item 20 and its subordinate dimension was only 0.414, and the item was deleted. The |Ri-EMPH-Ri-ES&G|s of item 4 and itme 17 were lower than 0.25, so the two items were deleted. After the above discrimination analysis process, 17 items were reserved.
|

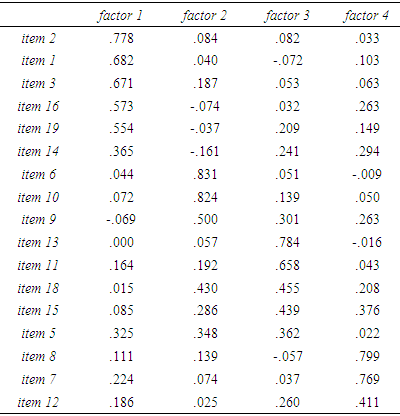
3.3.1.2. Factor Analysis and Logical Analysis
- Exploratory factor analysis (EFA) and logic analysis were used to further item analysis to ensure the refined SWBS had ideal structural validity. Items excluded criterion were as follows:(1) The number of extracted component would be decreased distinctly when the item was deleted;(2) The item whose factor loading was significantly lower than any other items in the same principal component;(3) Although an item influenced a certain principal component, but it was obviously different from other items influencing the same principal component;(4) In different round of EFA, the item belonged to different dimension.(5) Only one item from the same subscale of SWBS-cc20 could be selected.(6) In order to keep balance on the number of items in each dimension, the sub-optimal item would be deleted.In the first round of EFA, the outcomes of data analysis showed that the KMO values were 0.822, Barlett spherical value of chi-square test was at significant level, which indicated that factor analysis was suitable. With the factor analysis (principal component/varimax), four factors whose eigenvalue over 1 were extracted, and these factors could account for 49.510% of the total variance (Table 10).
|
3.3.2. The psychometric properties of SWBS-cc6
3.3.2.1. Internal Consistency Reliability
- Subsample 2 was used to examine the internal consistency reliability of SWBS-cc6 and its two dimensions. The results showed that the full scale and most of subscales have favorable reliability. The Cronbach’s alpha coefficient of the full scale was 0.575, and the Cronbach’s alpha coefficients of the two dimensions (EMPH and ES&G) were 0.501 and above 0.605 respectively.
3.3.2.2. Criterion Validity
- Pearson correlation coefficients between the scores of the full SWBS-cc6 (including the scores of its two dimensions) and the scores of SISRSWBS were used as criterion index. The criterion validity of SWBS-cc6 applied to subsample 2 was 0.414. The correlation coefficients between the scores of the two dimensions (EMPH and ES&G) and the SISRSWBS scores were 0.351 and 0.286 respectively, which means that the SWBS-cc6 and its two dimensions showed favorable criterion validity.
3.3.2.3. Structural Validity
- According to the model of Chinese citizens’ subjective well-being mentioned above, the structure of SWBS-cc6 was constructed. Subsample 2 was used to testify the model. A procedure of confirmatory factor analysis was put into action through Amos 17.0. Figure 5 showed the results of confirmatory factor analysis. All of the goodness-of-fit indicators being examined about the model were satisfactory (see Table 3).
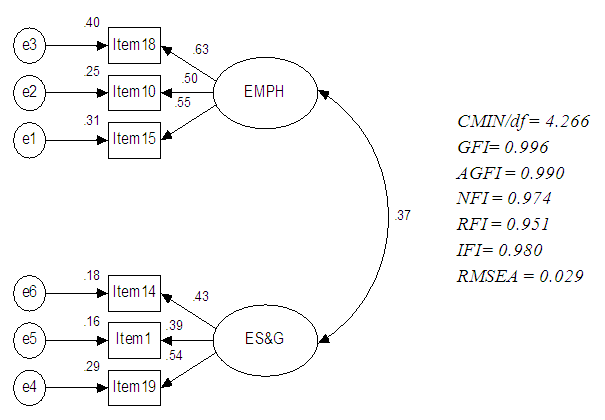 | Figure 5. The parameters of model and its main goodness-of-fit index |
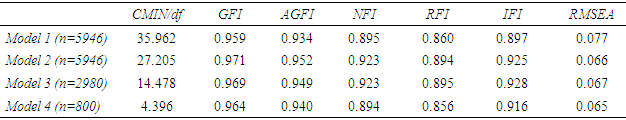
4. Discussion and Conclusions
- Consistent with former studies from mainland China, this research shows that SWBS-cc20 had ideal internal consistency reliability and criterion validity. But for the structural validity, things are different. With the sample size reduction, the value of CMIN/df was greatly reduced. This findings are consist with other researches (Marsh, Balla and McDonald, 1988; Wen, Hau and Marsh, 2004). According to the findings of these researches, When N was larger, CHI test would be considered bad, because CHI would be increased from the increase in N, as a result, any model would be rejected. So we need to examine some other Goodness-of-fit indices less affected by the sample size. In this research, GFI AGFI NFI and IFI were detected to have values above or very close to the cutoff value 0.90, and it could be concluded the model fitting of SWBS-cc20 was good. The SWBS-6 developed in this research was demonstrated to have very good psychometric properties, and it was testified that. the simple model usually had better fitt effect than the sophisticated one (Wen, Hau and Marsh, 2004).Norm is a very important standard measure for comparison. In this research, the nationwide norm of SWBS-cc20 was achieved through a standard norm sample including 2438 respondents from the mainland China. The gender norm and age norm were also established for the convenience of comparison between groups. Although there are many evidences indicate that there are no difference between men and women on subjective well-being (Zweig, 2014), the gender norm was still established in this research. When we developed SWBS-cc, subjective well-being was regarded as a system including some essential elements. These elements were measured by corresponding subscales. In a sense it is more valuable to examine the difference between men and women on these subscales, and so the establishment of gender norm is necessary. While examining the age norm, a different relationship between age and subjective well-being was detected. The total score of subjective well-being declined by age, which was different from our former findings: the total score of subjective well-being follows approximate U-shape across age groups (Xing and Huang, 2014). But the finding of this research is consistent with some previous researches (Larson, 1978; Diener and Suh, 1998; Smith and Baltes, 1993; Ferring and Filipp, 1995) Further analysis showed the approximate same trend on EGP EPH and EAIR, from which we could find the elements lowering the overall trend. As to ESAb and EMH, U-shape across age groups was quite obvious, which was consistent with other researches (Gerlach and Stephan, 1996; Oswald, 1997; Theodossiou, 1998; Helliwell, 2003; Blanchflower and Oswald, 2004; Frijters et al., 2005; Clark and Oswald, 2006; Xing and Huang, 2014; German L. et al., 2016). Why we didn't get the same results when using the same instrument? One reason might be sampling. The sample we used in the former research was from 5 capital cities in mainland China, and its representative was obviously poorer than the sample of this research which was selected from the whole country. In fact, very little old age people were included in the former sample. It should be emphasized that the content of subjective well-being would affect the relationship between age and subjective well-being.