-
Paper Information
- Paper Submission
-
Journal Information
- About This Journal
- Editorial Board
- Current Issue
- Archive
- Author Guidelines
- Contact Us
International Journal of Applied Psychology
p-ISSN: 2168-5010 e-ISSN: 2168-5029
2019; 9(1): 20-28
doi:10.5923/j.ijap.20190901.03

Factorial Structure and Psychometric Properties of the Arabic Version of Eating Disorders Scale for Adults in a Saudi Women’s Sample
 Abstract
 Reference
 Full-Text PDF
 Full-text HTML
Hend Abdulaziz Alsulaiman , Mogeda El Sayed El Keshky
Assistant Professor of Clinical Psychology, Department of Psychology, Faculty of Arts and Humanities, King Abdulaziz University, Jeddah, Saudi Arabia
Copyright © 2019 The Author(s). Published by Scientific & Academic Publishing.
This work is licensed under the Creative Commons Attribution International License (CC BY).
http://creativecommons.org/licenses/by/4.0/

The aim of this study was to analyze the reliability and factor structure of EDI for an adult women's nonclinical sample in Saudi Arabia. The final sample was constituted by 821 participants who completed the EDI-3 and body image. The estimated weight-related subscales for DT (11.34) and BD (11.86) subscales scores higher than that of B (4.38) on EDI-3 in a Saudi women's sample. The psychometric properties of these scales demonstrate high internal consistency reliability, across samples. The convergent (88%) and discriminant validity (76%) of the EDI-3 scale in the sample was demonstrated. This study indicated that the three-factor structure of the EDI-3 was supported in an item-level CFA since an acceptable fit for the data in the women's sample was found. We were able to prove the reliability and validity of the scores on EDI-3 in a Saudi women's normal group and confirm that EDI-3 was a useful tool to explain the psychological attributes of the sample.
Keywords: Eating disorders, Reliability, Saudi women, Factor structure, EDI
Cite this paper: Hend Abdulaziz Alsulaiman , Mogeda El Sayed El Keshky , Factorial Structure and Psychometric Properties of the Arabic Version of Eating Disorders Scale for Adults in a Saudi Women’s Sample, International Journal of Applied Psychology, Vol. 9 No. 1, 2019, pp. 20-28. doi: 10.5923/j.ijap.20190901.03.
Article Outline
1. Introduction
- Eating disorders (ED) are related to psychiatric complications, having the highest mortality rate of any other psychiatric disease [1,2]. Anorexia nervosa (AN) and Bulimia nervosa (BN) are two ED that can be diagnosed according to some characteristic signs [3]. People with AN have a seriously underweight due to a very low food intake although they feel fat. In the case of BN people, who in general are normal weight or overweight, can overeat in a very short time. Then, as they do not want to gain weight they use different methods to avoid it. The most common is to induce vomiting, although they can also give a wrong use of laxatives, do too much exercise or fast for long periods. Since all ED has in common body image´s dissatisfaction, the rest of them that does not fit completely with AN or BN are diagnosed as having Body Dissatisfaction (BD). These disorders can produce damage in the body of a person affecting different physiological functions such as fertility, cardiovascular or digestive metabolism; It may cause anxiety and depression up to suicide [2,4]. Initial recognition of ED may positively impact on efficiency and cost of public health services [5].Before the decade of the 90, the epidemiology of eating disorders was lower in non-Western societies [6]. These cultures acknowledge chubbiness in women as appealing and link it to fertility. However, this traditional belief is being altered because globalization with its mass media has influenced the eating attitudes with the purpose of changing the body shape of a curve figure to a more angular one. Therefore, a feeling of body shape´s dissatisfaction may appear when especially young women from non-western countries have been in contact with western culture. These women comprise a high-risk population for ED in Saudi Arabia as in many of the Arabs countries [7-9]. Therefore, it is imperative to detect young females exposed to ED in this culture. To reach this goal is necessary to have efficient screening tools.
1.1. Eating Disorder Inventory (EDI)
- Several instruments to evaluate the psychological characteristics of ED have been reported [10-14]. They are for the most part survey questionnaires, planned to assess the attitudes, behavior, and beliefs of persons towards eating. Different versions of the Inventory of Interpersonal Problems (IIP) [10] that measures interpersonal distress have been used in the ED field with acceptable to good reliability and validity [15,16]. A Body Image Avoidance Questionnaire (BIAQ) was developed by Rosen et al. [11] with the purpose to explore the influence of society on body appearance and ED. BIAQ has been used to validate or discriminate against other instruments.One of the most broadly used instruments in research as well as in clinical contexts is the Eating Disorder Inventory (EDI) which is a self-report questionnaire. Garner et al [12] developed the first version of the EDI, changing to a second one in 1991 [13] and finally a third version in 2004 [14]. The last version included the original three scales that measure eating disorders symptoms, that is, drive for thinness (DT), bulimia (B) and body dissatisfaction (BD). These are accompanied by other scales associated with general psychological characteristics linked to eating disorders, such as interpersonal distrust, perfectionism, ineffectiveness, interoceptive awareness, and maturity fears. In total, EDI-3 has 91 questions that are able to tell the difference accurately between patients and nonclinical controls and in part this difference could also be appreciated between groups of patients [13,17-20]. Sometimes, the principal three scales are used with nonclinical samples as independent constructs to detect persons with possible eating disorders. Especially the scale DT could look for “weight preoccupation,” according to Garner [13]. EDI-3 combines the three scales to constitute an Eating Disorder Risk Composite (EDRC) score, an index that represents the completed eating syndrome or it evaluates the amount of risk for eating disorders. This can be done in research working with clinical as well as nonclinical samples [21,22]. However, in some studies not all the scales behave as one construct. The DT and BD scales remain together, whereas B split in another factor [20,23]. Since EDI-3 could have an essential role in screening for ED in Saudi Arab population, we investigated the factor structure of the EDI scales in nonclinical Saudi women samples. We did that using a translated version of this questionnaire to assure a better estimation of ED. That is the individuals can easily understand the questions by removing the effect of the difference in language.
1.2. Reliability and Validity of the EDI
- Reliability coefficients depend on the characteristics of the sample which means that it is not a property of the test [24]. To determine reliability of test scores after obtaining a measurement is important because if reliability is low it means that the capacity to measure the expected construct could be limited. Therefore, problems with the validity of the data may arise [25]. Though validity cannot be determined without the reliability of the test scores. These three versions of EDI have been mainly psychometrically examined and validated in samples from clinical and nonclinical subjects that speak English [12-14,26-28]. The instrument not only has been translated into other languages but also adapted to different cultures [29]. The EDI especially version EAT-26 has been broadly used in Arabic countries [8, 30-38], but only a few studies reported on its psychometric characteristics [29,39-41]. Besides, EAT-26 could not be reliable to detect possible cases of anorexia in adolescents from Oman [31].The reliability differences between clinical and nonclinical samples are normally large [42-43]. Therefore, these psychological symptoms must be reliably measurable in nonclinical samples to assess the possible risk of these samples for getting beliefs and behaviors related to eating disorders. That is especially crucial for the effectiveness of any eating disorders prevention program.
1.3. Hypothesis
- Based on the published literature, we hypothesized that the EDI-3 would be reliable and valid for a nonclinical sample of Saudi Arab women.
2. Method
2.1. Participants
- There were 821 women from the Saudi-based population. Background data, on gender, age, education level and other relevant demographic variables were collected. The women were recruited either by a Web-based system that permitted university students to register or because they were friends and relatives of the students. Participation was completely voluntary and informed consent was obtained by all participants. The study was approved by the university’s Bioethics Committee.
2.2. Measures
2.2.1. Demographic Data Form
- The participants completed this form by answering demographic questions related to their: age, average height and weight, body index mass; status related to work, health, marriage, parental education, visiting specialists, having children, education level, order in the family, body appearance, and sports practice. They used a set of scales, in case they had doubts about their weight.
2.2.2. Eating Disorder Inventory (EDI-3)
- The EDI-3 [14] is a 91-item self-report measure of symptoms organized into 12 main scales. Three of these scales, named the ED Risk Scales relate to Drive for Thinness, Bulimia and Body Dissatisfaction. They define some of the principal characteristics of an ED like misconception about weight and body size and the drive to be thin, which increases the risk of having ED. The other nine scales are called Psychological Scales and relate to Low Self-esteem, Personal Alienation, Interpersonal Insecurity, Interpersonal Alienation, Interoceptive Deficits, Emotional Dysregulation, Perfectionism, Asceticism and Maturity Fears. These are related to different psychological aspects of essential notions and problems. In addition, the EDI-3 contains six mixes that are constituted by distinct group arrangements of the subscales. The EDI-3 questions have been added to similar statements as those in the other work, but they are answered by the subjects using the words: Never, Rarely, Sometimes, Often, Usually, Always, which are scored with a 1- to 6-point Likert scale, respectively.
2.2.3. Body Image Avoidance Questionnaire BIAQ
- Body image disturbance has cognitional and behavioral components which are acknowledged to have a central role in the psychopathology of ED [44]. For one of these behavioral components, Body Avoidance, the subject tries to avoid varying situations in relation to physical appearance. The measurement of this component can be used to evaluate a risk factor for ED and therefore is considered a main target for interventions [44]. A Body Image Avoidance Questionnaire (BIAQ) was developed by Rosen et al. [11] and has been used to validate or discriminate against other instruments.A questionnaire of a 19-item behavioral measure of body image was used [11]. It has four factors: clothing, social activities, eating restraint, and grooming and weighing. Items are rated on a 6-point Likert scale (“never” to “always”) and the higher the score indicates a greater body image avoidance.EDI-3 and BIAQ were administered after translation into Arabic. The English versions of the questionnaires were adapted and translated using the back-translation method. After the translation process, final versions were checked once more to establish that they are similar to the original English versions.
2.3. Procedure
- First, the announcement about the study stated that it was related to eating and body image. When women came to their appointment, they obtained specific information in relation to the methodology, analyzed consent forms and received answers to their questions. Then the EDI questionnaires were delivered in a random way to avoid possible disturbances to order distribution. At the end of the study, some additional information concerning the study and its resources were given to the women.
2.4. Data Analysis
- To examine if the theoretical three-factor model of the EDI-3 scales was invariant across the sample of Saudi women, a multiple group confirmatory factor analysis (CFA), was used. CFA considers that items on a scale are related by continuous latent factor(s), which refers to the shared variance among them [45]. The mathematical association between the items and the latent factors is made through factor loadings that indicate the amount of (co)variance in the items produced by the latent factor. However, there is still a variance that represents an error that is also estimated.The EDI items were not normal, therefore they were considered categorical. This has to do with modeling the item thresholds that serve as levels for the latent factor(s). Thus the range of answers is segregated on a specific categorical item [46]. To identify the model, indicator residuals have to be restrained to one. The assessment of power was performed following the recommendations of Bentler and Chou [47] who state that the number of subjects should be greater than 5 for every parameter estimated in the model.Statistical analyses were carried out with Multitrait Scaling Analysis version 24.0 [48]. Missing data were assessed using maximum likelihood, [49]. The variance´s values of the latent factors were fixed to one and the means were fixed to zero to achieve scaling decisions. Theta parameterization was utilized [46]. Mean- and Variance-Adjusted Weighted Least Square estimation was utilized since the data were significantly far from multivariate normality [50]. The overall adjustment was tested using the Comparative Fit Index (CFI), Tucker Lewis Index (TLI), Root Mean Square Error of Approximation (RMSEA), and Standardized Root Mean Square Residual (SRMR). A corrected x2 difference test was used for comparison of relative adjustment in the model.
3. Results
3.1. Demographic Variables
- A total of 821 Saudi women participated in this study, and the distribution according to age was: 18-24 (75.4%), 25-30 (10.2%), 31-36 (5.8%), more than 36 (5.8%) and less than 18 (2.7%) years old. The women’s average height was 158.4 cm (SD = 7.17 cm) while their average weight was 58.4 kg (SD = 14.4 kg) and 23.35 kg m-2 (6.25 m-2) on body index mass.Saudi women had different statuses. For instance, for:1. Work status, 69.8% were university students, 17.7% were unemployed, 7.4% were employees and only 5.1% were in secondary school.2. Health status, 20.3% had excellent health, 34.3% very good, 28.9% good, 13.5% regular and 2.7% poor.3. Visiting specialists, 71.4% of the Saudi women did not, and 28.6% did. For those who did, 12.5% was for obesity, 6.5% for anorexia, 5.6% for thinness and the rest (75,4%) for other reasons.4. Marital status, 72.8% never married; 24.1% were married and only 2.2% and 0.9% were divorced and widowed, respectively.5. Having children, 79.7% had no children, 10.4% had 2 to 4 children, 7.8% had 1 child, 2.6% had 5 to 7 children and only 0.1% had more than 7 children;6. Parental education status, their fathers (f) and mothers (m) had variable education levels ranging from a college degree (43.5% f and 21.2% m), to high school (26.8% f and 21.6% m), to middle school (14.9% f and 14.5% m), to elementary school (10.2% f and 19.0% m) and to the uneducated (4.6% f and 13.8% m).7. Their position in the order of their siblings, 62.5% were in the middle, 20.8% were first and 16.7% were last.An evaluation of the women’s expectations about their body appearance showed different beliefs that went from excellent (32.5%), very good (35.6%), good (18.4%), regular (11.2%) and poor (2.3%). With respect to sports practice they had different attitudes: they practiced less than once or not at all (42.9%), 3 to 4 times a week (17.1%), 1 to 3 times a month (16.9%), once a week (13.0%) and almost every day (10.1%).
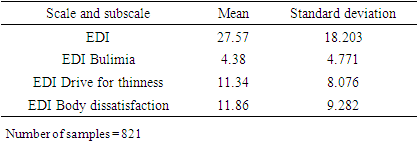
3.2. Eating Disorder Scale Descriptions
- The descriptive statistics for Eating Disorder Scale (EDI) and its subscales EDI-Bulimia, EDI- rive for thinness, and EDI-Body dissatisfaction is presented in Table 1.
|
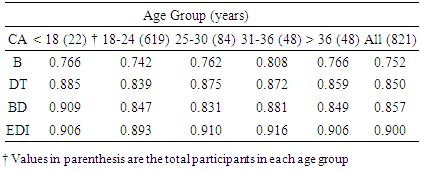
3.3. Reliability Statistics
- This study applied the reliability assessed by internal consistency following Pallant [51] and Hair et al. [52]. Table 2 shows Cronbach’s alpha for the reliability of the test scores of the EDI and its subscales [53]. Cronbach’s alpha values were 0.752, 0.850, 0.857 and 0.900 for the full scale and subscales B, DT and BD, respectively. In each age group and all-age groups, B subscale scores had a lower reliability than the other two subscales (DT and BD) which had similar Cronbach’s alpha scores. However, the values of Cronbach’s alpha were always higher than 0.7 and according to George and Mallery [54], EDI and its subscales scores varied from acceptable to excellent reliability.
|
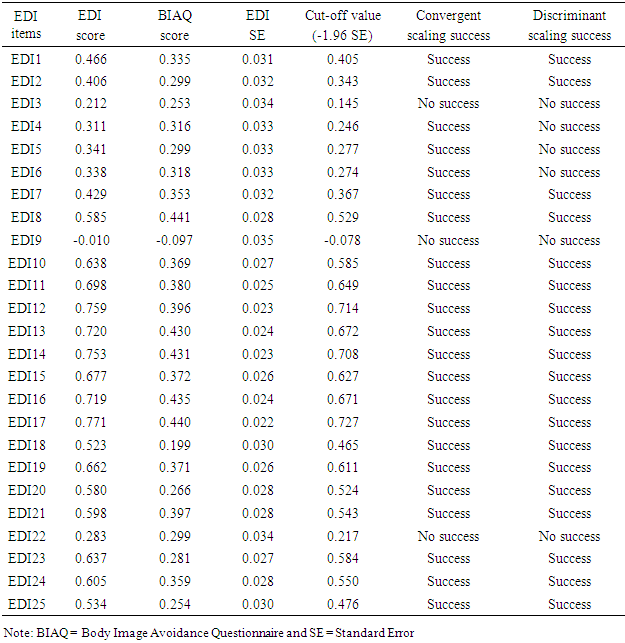
3.4. Convergent and Discriminant Validities
- Convergent and discriminant validities are both considered subcategories or subtypes of construct validity that have to work together to establish constructive validity. Multitrait scaling analysis was conducted using the SPSS version 24.0 according to Methods. Item-scale correlations were analysed, and item-convergent and item-discriminant validity were assessed. In evaluating item-convergent validity, a stringent criterion of correlation of 0.30 or greater between an item and its own scale (EDI) was considered a success. Items which correlated significantly higher (more than 1.96 standard errors) with its own scale (EDI) than with the other scale (BIAQ) were considered as scaling successes in determining item-discriminant validity.In this study the convergent validity was verified (22/25 = 88%) and discriminant (19/25 = 76%) validity also was confirmed (Table 3).
|
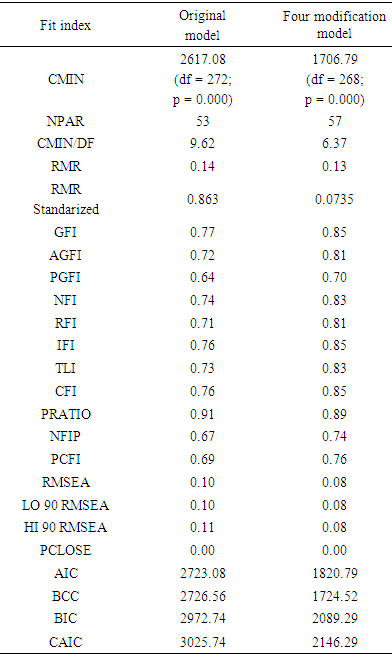
3.5. CFA for Eating Disorder Inventory
- A CFA for EDI was carried out for the whole sample. Table 4 shows the original three factor model for EDI and the same model with four modification indexes. Analysis of the model with modifications indicated that the value of X2 (CMIN or minimum discrepancy) was 1706.79 and it was significant (p ≤ 0.001) with 268 degrees of freedom, while the number of distinctive parameters that were estimated (NPAR) was 57 and the X2/gl ratio was 6.37. According to the literature [55] values above 5 indicate that the model does not fill the data. Another parameter studied was the RMR that is considered acceptable with values between 0.05 and 0.08. We found the value of 0.13 which means that the model does not adjust according to this index. However, because these residuals are relative to the sizes of variances and observed covariances, they are difficult to interpret; therefore, the standardized RMR (SRMR) that represents the average value over all standardized residuals and ranges from 0 to 1.00, was also determined. Values of SRMR between 0.05 and 0.08 are considered acceptable [56,57]. The SRMR value obtained was 0.0735 thus the model fit well accordingly with this parameter. The parameters GFI and AGFI had values of 0.85 and 0.81, respectively, which are close to the acceptable value of 0.90 (Table 4). The PGFI (parsimony goodness-of-fit index), which is a modification of the GFI that takes into account the degrees of freedom available to evaluate the model, was also determined. A non-significant X2 statistic and goodness of fit indexes in the 90s, accompanied by parsimony indexes in the 50s are expected. So the value of PGFI obtained in this study (0.70) is higher than 0.50. Therefore, the model is acceptable according to these parameters of GFI, AGFI and PGFI.
|
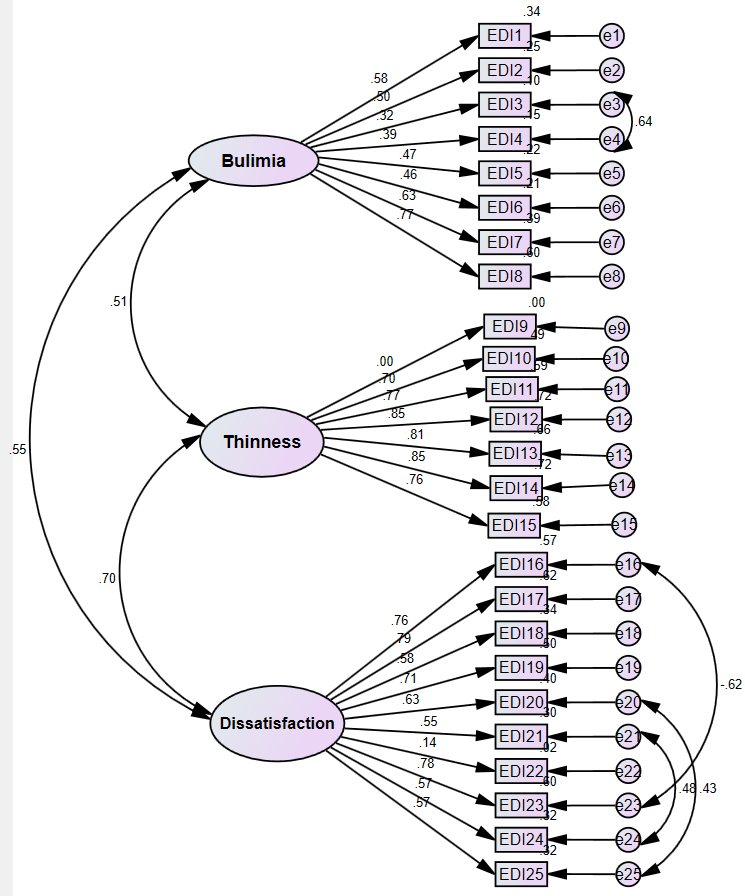 | Figure 1. Factor structure of the Eating Disorder Inventory displays the theoretical three factor structure. It includes the parameter estimates for the factor loadings and factor correlations from the confirmatory factor analysis in the overall sample (N = 821) |
4. Discussion
- The aim of the present study was to investigate the psychometric of EDI-3 regarding reliability and structural validity, for an adult women's community sample in Saudi Arabia. The EDI-3 represents an expansion and improvement of the earlier versions of the EDI because it facilitates a more consistent measure [14]. Besides EDI-3 improves the psychometric properties with non-clinical populations and is highly suitable for screening purposes [14].Firstly, the description of the eating disorder scale was determined. We found that the estimated weight-related subscales for DT (11.34) and BD (11.86) scored higher than that of B (4.38) on EDI-3 in a Saudi women's sample. A possible explanation for this difference is that B participants commonly have normal body weight, that they do not see themselves as battling to be slimmer. Therefore, they could believe that they are near to their objectives. On the contrary, participants with DT and BD express dislike with their body and may fight more to be thinner.We evaluated the internal consistency reliability of the scores on EDI-3 for the Saudi women's sample, and the data provided evidence for the reliability of the three scales of the EDI-3 (above 0.70). The psychometric properties of these scales demonstrated high internal consistency reliability, across samples. DT and BD appeared to have strong reliability (alpha range of 0.831 to 0.909). The B also had a good value although somewhat lower (alpha range of 0.742 to 0.808). This could be in agreement with the beliefs of this group of subjects of being perfectly normal and not at risk.For treatment planning and monitoring, outcomes are also important in demonstrating the convergent and discriminatory validity of the measurements. We present evidence of the convergent validity of the EDI-3 scales since a high correlation (88%) with analogous measures was found. In relation to discriminant validity, it showed that the relationship between the EDI-3 and the BIAQ scales sufficiently differentiated (76%) between participants with dissimilar psychological disorders.This study indicates that the three-factor structure of the Arabic version of EDI-3 was supported in an item-level CFA since an acceptable fit to the data in the women's sample was found. According to the indices, the model provided a very well fit (CFI, TLI, NFI, RFI, IFI, SRMR & RMSEA) an acceptable fit (PRATIO, PNFI & PCFI) and a lack of fit (RMSEA).This last result may be due to the inclusion of model constraints in the analyses that may produce minor inconsistencies in the model. Therefore, the factor structure of EDI-3 is trusted to be a reliable and valid tool that would help investigators to explore different kinds of eating disturbances among women in Saudi Arabia. In general, our results go along with the 3-factor structure of EDI-3 described by Garner [14].Similar findings have also been documented in a recent study, using a sample of 90% Caucasian college students, to evaluate the test-retest reliability of common ED measures, among them ED-3, in women [28]. Other works indicate that the original factor structure of EDI-3 is supported for women samples from European American and some adjustments are required for African American [61] and Latinas [62]. However, other researchers claim that the theoretical three-factor structure of the EDI was supported among different ethnic groups [18,21]. To our knowledge, this is the first report of using EDI-3 to measure eating disorder risk in a women's sample from an Arab country. EAT-26 had been used in Saudi Arab [32-36, 40], Jordan [37], Sudan [30] and EAT-40 has been used in United Arab Emirates [63], Oman [31] and Saudi Arab [64]. In addition, we found here that eating disorders in Saudi women were not related to age that is similar to other reports [65-66].Arabs are traditional people with particular eating and dressing manners and cultural rules that consider a fuller figure representation of an attractive and desirable woman. This is a completely different image of the beauty in Western countries. However, the different point of view of the Arab society did not modify the original factor structure of EDI-3. Therefore, the Arabic version of EDI-3 is able to detect persons with eating disorders very much alike to that of the version in English.
5. Limitations and Future Research
- The principal limitation of our study is its restriction to nonclinical samples, therefore it cannot be generalized to patients suffering from eating disorders. Another limitation is that only women participated in the study, though we cannot use our results to make any assumptions regarding men. Finally, the different numbers of participants in each group are one limitation because when the number is low, decrease the statistical power.Future research could focus on using EDI-3 to differentiate an eating disorder patient group from a control group in the Saudi women's population. This could help recognize more easily behavior problems and particular psychopathology on clinical and nonclinical subjects. It is also worth to mention that different data has been obtained by EDI-3's application in different countries. Comparison of the behavior of Saudi women with women from different regions will give light on the cultural differences among these populations.
ACKNOWLEDGEMENTS
- This project was funded by the Deanship of Scientific Research (DSR), at King Abdulaziz University, Jeddah, under grant no. (J-12-246-39). The author, therefore, acknowledge with thanks to DSR for their technical and financial support.