-
Paper Information
- Next Paper
- Paper Submission
-
Journal Information
- About This Journal
- Editorial Board
- Current Issue
- Archive
- Author Guidelines
- Contact Us
International Journal of Applied Psychology
p-ISSN: 2168-5010 e-ISSN: 2168-5029
2017; 7(5): 101-109
doi:10.5923/j.ijap.20170705.01

An Analysis of Prevalence Rates of Saudi’s Students with Emotional and Behavior Problems and Its Effects of Gender and Age
 Abstract
 Reference
 Full-Text PDF
 Full-text HTML
Mogeda El Sayed El Keshky1, Nsreen A. Alahmadi2
1Associate Professor of Clinical Psychology, Department of Psychology, Faculty of Arts and Humanities, King Abdulaziz University, Jeddah & Department of Psychology, Faculty of Arts, Assiut University, Egypt
2Associate Professor of Special Education, Department of Special Education, King Abdulaziz University, Instate of Higher Educational Studies, Kingdom of Saudi Arabia
Correspondence to: Mogeda El Sayed El Keshky, Associate Professor of Clinical Psychology, Department of Psychology, Faculty of Arts and Humanities, King Abdulaziz University, Jeddah & Department of Psychology, Faculty of Arts, Assiut University, Egypt.
| Email: |  |
Copyright © 2017 Scientific & Academic Publishing. All Rights Reserved.
This work is licensed under the Creative Commons Attribution International License (CC BY).
http://creativecommons.org/licenses/by/4.0/

Emotional and Behavioral Problems (EBPs) have an adverse impact on a child’s education performance. EBPs have been considerably addressed in the Europe and North America nonetheless in Middle East, North Africa and most parts of Asia including Saudi Arabia, they have not been adequately addressed. This study sought to establish the prevalence rates of EBPs, examine the EBP differences between non-clinical students and students with learning disabilities; determine the gender and age differences in terms of EBPs and lastly to establish interactional effects of age and gender on EBPs. The current study adopted a descriptive survey with a sample of 1121 participants; 798 non-clinical students and 323 students referred for learning disabilities. The teacher informant version of the Strengths and Difficulties Questionnaire was used as a research instrument. Students with learning disabilities and younger students (age<12) had higher EBP rates (with p-values below 0.05). Females had higher EBP rates for emotional symptoms and pro-social behavior, and males for conduct problems. Finally, there were gender-age interactional effects on: emotional symptoms, conduct problems, hyperactivity and total difficulty score (p-values<0.05). Generally, there were differences between students with learning disabilities and those referred to as non-clinical; male and female; as well as younger and older, in terms of EBP rates. There were gender-age interactional effects on EBPs. The study suggested that educators should develop mechanisms like guidance and counselling to ensure that differences in EBPs are adequately addressed.
Keywords: Emotional and behavioral difficulties, Gender and age differences, Middle school, Saudi Arabia
Cite this paper: Mogeda El Sayed El Keshky, Nsreen A. Alahmadi, An Analysis of Prevalence Rates of Saudi’s Students with Emotional and Behavior Problems and Its Effects of Gender and Age, International Journal of Applied Psychology, Vol. 7 No. 5, 2017, pp. 101-109. doi: 10.5923/j.ijap.20170705.01.
Article Outline
1. Introduction
- Emotional and Behavioral Problems (EBPs) have greatly challenged the instructional process, especially in middle schools, and as a result cause long-term effects that adversely impact a child’s education achievement [1]. Emotional and behavior problems have been considerably addressed in most countries in Europe and North America. Most studies show that the dimensions of EBPs that have received global considerations include emotional symptoms, conduct problems, peer problems and hyperactivity [2]. However, it is noted that educators do realize that emotional disorders, misbehavior and indiscipline in schools range from mild disturbances such as mischief, interruptions and screaming to severe disturbances like violence and physical harm [3].The Individuals with Disabilities Education Act in the US [4], states the factors that determine EBPs as: intellectual, sensory and health disorders; poor mutual relationships with peers and their educators; exhibition of abnormal and queer behavior; and tendencies to experience physical fear associated with personal and school issues. Even though there has been global awareness of EBPs, Emam and Kazem [5] say that most countries in Middle East, North Africa and parts of Asia including Saudi Arabia have not adequately addressed the factors attributed to EBPs.Abdel-Fattah [6] and Heward [7] have also noted that there is a larger proportion of students in schools in Arab countries who have immense psychological problems like screaming, emotional disturbance, rampant misconduct, being a social misfit and having some hyperactivity which affect both their intellectual and social development. Abaoud and Almalki [3] also assert that it is difficult to accurately estimate the proportion of children with acute EBPs in Arab countries including Saudi Arabia, but the World Health Organization [8] estimates that about 29% of children aged between 10 and 19 years suffer from EBPs.Emam and Kazem [5] investigated the relationship between prevalence rates and gender differences for EBP rates among middle school students in Oman and found that EBP rates of emotional disturbance, depression, anxiety, hyperactivity, aggression and peer problems were influenced by gender differences. Whereas Al-Zoubi [9] found that males were more likely to exhibit externalized disorders such as conduct problems and hyperactivity, and that females were more likely to exhibit internalized problems such as emotional difficulties.Similar research done by Whitcomb and Merrell [10] showed that most prevalence estimates indicate that internalized difficulties like depression occur more frequently in girls than in boys. That same research also showed that the prevalence rates of internalized difficulties like anxiety and emotional disturbance are similar in both adolescents and adults with an estimation of 5-7% for females and 3-5% for males. Emam and Kazem [5] cite empirically that girls portrayed enhanced susceptibility for a number of internalized disorders.Epidemiological statistics on the Arab region researches have suggested that a substantial proportion of adolescents suffer mental and behavioral symptoms. The United Nations Population Fund [11] project estimated that behavioral and mental problems account for 23% of global health problems among those aged 10-14 and 24% among those aged 15-19 in Arab countries. These findings were also echoed by Obermeyer [12]. The UNFPA [11] report also showed that the main behavioral and mental health problems were depression, anxiety and emotional problems. These assertions were also shared by Abdel-Fattah [6], who in his research on emotional and behavioral problems among male school children and adolescents in Saudi Arabia observed that 8.3% of adolescents in Saudi Arabia were disturbed by EBPs as compared to 23% adolescents in the United Arab Emirates.Another study, carried out in Taif Governorate of Saudi Arabia by Obermeyer [12], observed that the most crucial problems associated with EBPs were anxiety at 13.5%, somatic disorders at 12.2%, obsession at 10.8%, aggression at 8.1% and delinquency and depression at 4.1%.The introduction to the study has provided background information that emotional and behavioral problems have a greater influence on students’ psycho-social ability to perform well in their education. The literature has also identified that very little research has been done to address the EBP prevalence rates and the gender differences in students with EBPs in Saudi Arabia. Additionally, the literature has shown that very little, if any, research has focused on the analysis of prevalence rates on emotional and behavioral problems between non-clinical students and students referred for learning disabilities, the effect of age and gender differences on EBP rates and the effect of the age-gender interaction on the EBPs of school students in Saudi Arabia.
2. Current Study
- Educational performance and quality academic achievement are important attributes in a child’s growth and millstone cycle. This in-turn also fosters a nation’s social and economic development [13]. Therefore, a crisis arises when learning managers (administrators), educators, health workers as well as parents realize that a student has an EBP that will impede his/her successful transition from childhood to adulthood and eventual attainment of occupational and economic success [14]. The government of Saudi Arabia, as in other Middle East countries, has been reforming its curriculum but little concerning students with emotional and behavioral disorders and their academic achievement has been addressed in this education re-structure [6]. Scholars have addressed various aspects of EBPs including the effects of EBPs on educational achievement, the dimensions of EBPs, the causes of EBPs, the rates of EBP prevalent on various dimensions but very little has been investigated on the differences between genders or ages with respect to EBPs and their impact on educational performance. It is in this regard that the current study seeks to analyze the emotional and behavior problems of the different genders and ages for both non-clinical students and students referred for learning disabilities for primary and intermediate school students in Saudi Arabia. The study developed the following research objectives to address the research problem.1. Establish the prevalence rates of emotional and behavioral problems among students in Saudi Arabia.2. Determine the difference between non-clinical students and students referred for learning disabilities in terms of their EPBs in Saudi Arabia.3. Determine the difference between male and female students in terms of their EPBs in Saudi Arabia.4. Examine the differences between age groups of students in terms of their EPBs in Saudi Arabia.5. Establish the interactional effect of age and gender on EPBs among students in Saudi Arabia.
3. Methodology
3.1. Participants
- The study adopted a sample size of 1121 primary and intermediate school students including 335 non-clinical male students, 463 non-clinical female students, 116 male students referred for learning disabilities and 207 female students referred for learning disabilities. Since this sample size was representative and probabilistic in nature, potentially it will offer significant analysis and conclusions about the target population [15]. Similarly, Krueger [16] indicates that demographic characteristics like age and sex are evenly and randomly captured through probabilistic sampling procedures. Therefore, the sample size included respondents aged from 6-16 years with a mean age of 9.35 and standard deviation of 1.660. The 451 male students in the study had a mean age of 9.18 and standard deviation of 1.886, while the 670 female students in the study had a mean age of 9.45 and standard deviation of 1.516. The sample also had 798 non-clinical students with mean age of 10.44 and standard deviation of 2.091, and 323 students referred for learning disabilities with a mean age of 9.35 and standard deviation of 1.660. The sample size was drawn through simple random sampling from different schools in Saudi Arabia. The sampled students were rated by their teachers using the Strengths and Difficulties Questionnaire (SDQ).
3.2. Tools
- The study used the teachers’ version of the Strengths and Difficulties Questionnaire (SDQ) as the most appropriate and suitable tool for collecting data concerning with emotional and behavioral difficulties in primary and intermediate schools. The teachers SDQ version, which had been translated into more than 60 languages including Arabic [5, 17], was helpful since the Arabic version could be easily administered in Saudi Arabia. The teachers’ SDQ had five subscales. Each subscale had an individual score and then the five subscale scores were added to determine the total difficulty score. The five subscales of EBPs concerned emotional symptoms, conduct problems, hyperactivity, peer problems, and pro-social behavior. According to Haynes et al. [18] the SDQ is the appropriate research tool to be used for screening psychometric issues like EBPs.
3.3. Procedure
- Logistical and ethical considerations were put in place before carrying out the research, especially for data collection. Approval was obtained from the University Research Board (URB) before beginning the data collection procedure, and concurrently, permission was granted from the Ministry of Education to conduct research in the sampled schools. Approval was also sought from institution administrators and from the teachers whose students formed part of the research study. The teachers were informed that participation in the research was free, voluntary and that anonymity was guaranteed. The researcher also confirmed confidentiality of the data obtained from the study and that it would be discarded after the study results were disseminated. Teachers were selected on the basis that they had worked with the pupil(s) to be rated. Teachers were given enough time to fill in the SDQ so that the study did not interfere with their daily schedule. The authors themselves approached the teachers and explained the aim and instructions for filling the SDQ.
3.4. Validity and Reliability
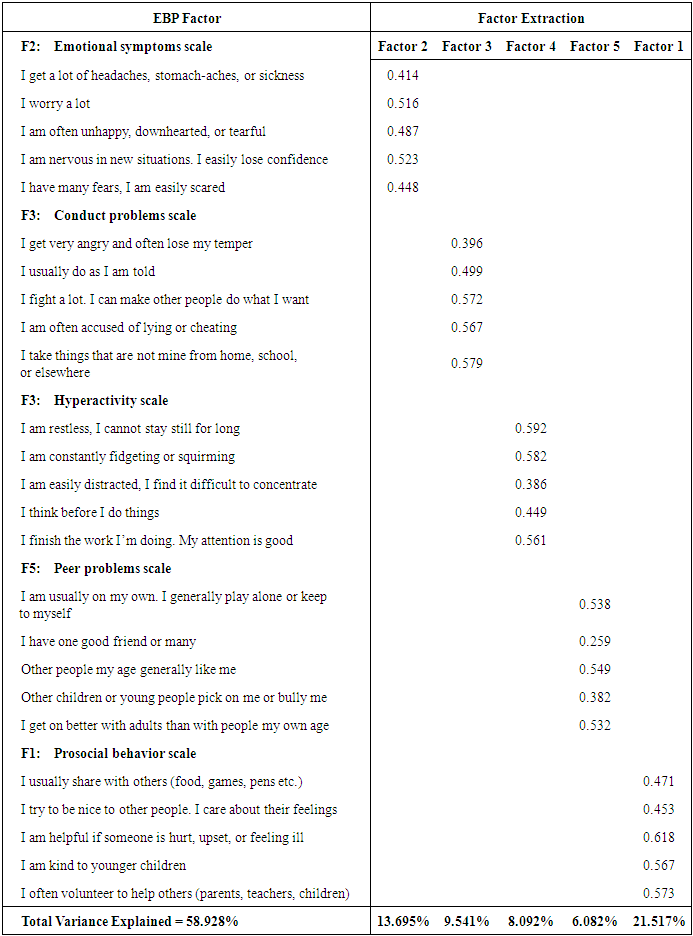
- The students answered the SDQ by responding to the 25 questions in the instrument, and then the results were analyzed using factor analysis to check whether the SDQ instrument had validity. Factor analysis was fit for checking of validity, since it provided the explained data variability as well as factor loadings that show the correlations between each of the factors investigated [15]. Kothari [15] also notes that when the factor loading is equal or greater than 0.5 this portrays correlation, hence validity. Mugenda & Mugenda [19] however say that when a factor loading is about 0.4, this indicates only a moderate correlation, thus moderate validity and weak correlation, when a factor loading is below 0.3. This indicates no validity.
3.5. Analysis
|
|
4. Results
4.1. Prevalence Rates of EBPs
|
4.2. Group Differences between Non-clinical Students and Students Referred for Learning Disabilities
|
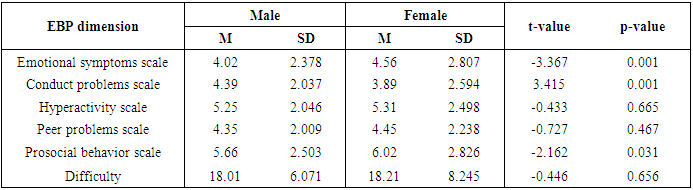
4.3. Gender Differences
|
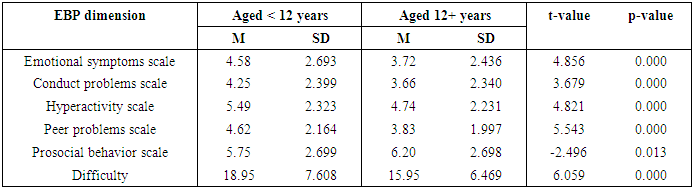
4.4. Age Differences in Terms of EBPs
- The results in Table 6 below show that there is significant difference in EBP rates between students aged 6-11 years and those aged 12-16 years. According to the results, the EBP rates show significant differences for Emotional symptoms (t-value=4.856, p-value=0.000), Conduct problems (t-value=3.679, p-value=0.000), Hyperactivity (t-value=4.821, p-value=0.000), Peer problems (t-value =5.543, p-value=0.000), and Prosocial behavior (t-value=-2.496, p-value=0.013). The Total difficulty score also portrayed a significant difference between the two groups (t-value =6.059, p-value=0.000).
|
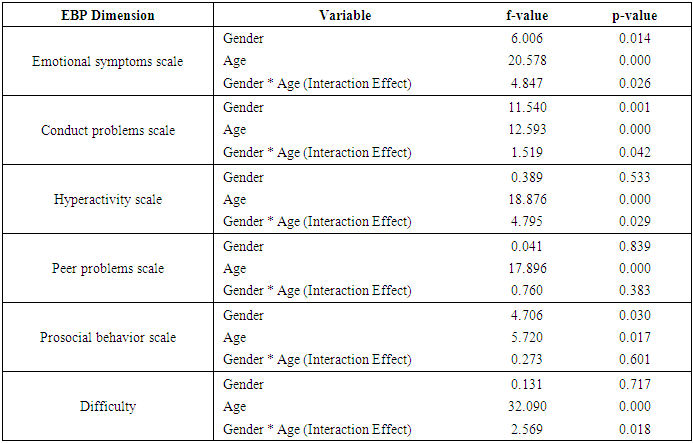
4.5. Gender and Age Interaction Effects
- The Analysis of Covariance (i.e. ANCOVA) tests in Table 7 above show that there are significant interaction effects between gender and age in: Emotional symptoms (F-value=4.847, p-value=0.026), Conduct problems (F-value=1.519, p-value=0.042), Hyperactivity (F-value=4.795, p-value=0.029) and the Total difficulty score (F-value=2.569, p-value=0.018). However, other EBP dimensions do not portray significant interaction effects.
|
5. Discussion of Results
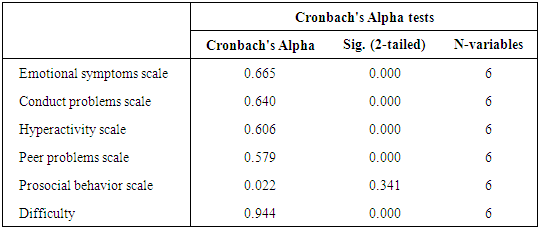
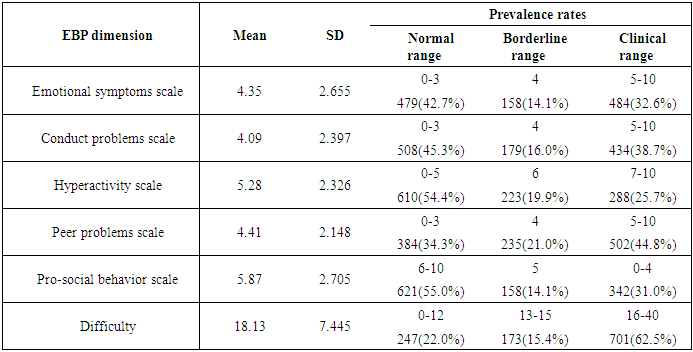
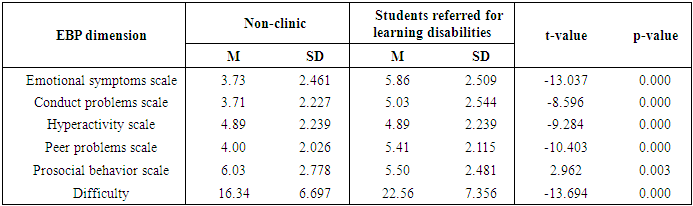
- The results on validity indicated that almost all factors in the Prosocial behavior scale, Emotional symptoms scale, Conduct problems scale and Hyperactivity scale show validity since their factor loadings were approximately equal to 0.5. It was also found that the Peer problem scale concerned with whether one had one good friend or many, had a factor loading was 0.259; hence, there was no validity in its measure. The factor analysis also displayed 58.928% of total variance explained by the five EBP scales and the total difficulty score. Therefore, the research found that the SDQ and its respective results portray validity. The validity results in this study concur with results in the study by Yao et al. [20] in which the SDQ was found to be a valid instrument for measuring the internalization and externalization of problems as well as the Prosocial subscale.The reliability results were significant and at the recommendable range due to the purpose of the study [21]. The Cronbach’s alpha showed that Emotional symptoms, Conduct problems, Hyperactivity, Peer problems were reliable but not Prosocial behavior. The Total difficulty score also showed reliability. Therefore, the SDQ and its respective results had reliability as also noted by Van Widenfelt et al. [22].On the assessment of the prevalence of EBPs, all five sub-scales showed different prevalence rates among the three ranges of EBP scales. In the clinical range, Peer problems had the highest prevalence rate, followed by Conduct problems, then Emotional symptoms and Prosocial behavior. These EBPs within the clinical range had prevalence rates above 30%, while Hyperactivity was below a 30% prevalence rate. It was also noted that the Total difficulty score had a prevalence rate of 62.5% for the clinical range. Worth noting were results on Hyperactivity and Prosocial behavior that had more than half of students within the normal range of EBPs. Concurrently, Rose and Rudolph [23] found that on average, all EBPs dimensions were prevalent in most middle school students. The mean and standard deviation results also portrayed similar results to those of Kauffman [24], in which there were uniform variability and averagely borderline EBP prevalence rates.The results of group differences between non-clinical students and students referred for learning disabilities showed that the students referred for learning disabilities had significantly higher EBP rates for Emotional symptoms, Conduct problems, Hyperactivity, Peer problems and the Total difficulty score than non-clinical students. On the other hand, non-clinical students had significantly higher EBP rates for Prosocial behavior than students referred for learning disabilities. Generally, this study found that students referred for learning disabilities had higher EBP scores than non-clinical students. This assertion is similar to that of Nayak [25], who in her cross-sectional analysis of psychological aspects of adolescents, found that students with learning disabilities had higher emotional and behavioral difficulties than normal students.On gender differences, it was found that there were significant differences in the mean between male and female students. For instance, female students had significant higher EBP rates for Emotional symptoms and Prosocial behavior than male students, while for Conduct problems male students had significantly higher EBP rates. These findings were almost similar to those realized by Leadbeater et al. [26], in which girls reported more internalization problems like emotional symptoms and prosocial behavior, whereas boys reported more externalization problems like conduct and aggression. According to age differences, this study found that younger students (aged 6-11 years) had significantly higher EBP rates in Emotional symptoms, Conduct problems, Hyperactivity and Peer problems compared to older students (aged 12-16 years). On the other hand, the older students had significantly higher EBP rates in Prosocial behavior than younger students. These findings were in agreement with Malloy [27], who found that younger children were more greatly affected by emotional disorders than adolescents.Emam & Kazem [5] cited the age-gender interaction effect as a limitation for determining the influence of age and gender on the prevalence rates of EBPs. With the usage of Analysis of Covariance (ANCOVA), the tests in this study between subject interaction effects showed significant interaction effects between gender and age for Emotional symptoms, Conduct problems, Hyperactivity and the Total difficulty score. The other EBP dimensions do not show any significant interaction effects. Therefore, Emotional symptoms and Conduct problems are the only EBPs scales that are affected by both gender and age as independent variables as well as by the gender-age interaction effect.
6. Limitations of the Study
- The study had objectives of investigating the differences between groups (non-clinical students and students referred for learning disabilities), genders and ages as well as the interaction effect of age-gender on EBP rates. Even though these objectives were achieved, it was noted however that the research study did not adequately address the effects of demographic multi-diversity and multi-cultural effects on the prevalence of EBPs in Saudi Arabia. Therefore, the research proposes that future studies should focus on addressing the population’s diversity, geographical and cultural effects on the prevalence rates of EBPs.
7. Conclusions and Implications of the Study
- The research findings and conclusions have great significance for research, policy, and practice. This study concluded that:• The SDQ instrument of research is valid in collecting data concerning EBP rates, and factor analysis can be used to test its validity by the use of factor loadings and total variance explained by the factor values.• The SDQ instrument of research is consistently reliable, and its reliability can be tested using Cronbach’s alpha tests.• The students referred for learning disabilities have higher EBP prevalence rates in Emotional symptoms, Conduct problems, Hyperactivity, Peer problems as well as the Total difficulty, while non-clinical students had higher Prosocial behavior rates.• There are differences between males and females in EBPs (Emotional symptoms, Conduct problems and Prosocial behavior). Female students have higher Emotional symptoms and Prosocial behavior, while male students have higher Conduct problems.• Younger students (aged 6-11 years) have higher EBP rates for Emotional symptom, Conduct problems, Hyperactivity and Peer problems compared to older students (aged 12-16 years), while the older students have higher EBP rates for Prosocial behavior.• There are interaction effects between gender and age concerning: Emotional symptoms, Conduct problems, Hyperactivity and the Total difficulty score. Other EBP dimensions do not show any significant interaction effects.With regard to the above conclusions, the study realized the following implications for academia and research as well as for policy practices: • First, for the differences between groups (non-clinical students and students referred for learning disabilities) and genders (males and females) in terms of EBPs like Emotional symptoms, Conduct problems and Prosocial behavior, educators in schools should develop mechanisms for ensuring that groups and gender differences are adequately attended to by psychological programs like guidance and counseling.• Guidance and counseling should also be in place to check on Emotional symptoms, Conduct problems, Peer problems and Hyperactivity to alleviate the significant variations associated with age.• There is a need to carry further research so as to address the demographic diversity, geographical and cultural effects on the prevalence rates of EBPs.• Lastly there is also need for the government of Saudi Arabia to consider this report, especially the study conclusions and recommendations to foster suitable provisions for the education of its citizenry.
ACKNOWLEDGEMENTS
- This project was funded by the Deanship of Scientific Research (DSR), at King Abdulaziz University, Jeddah, under grant no. (G- 300 / 246/38). The authors, therefore, acknowledge with thanks to DSR for their technical and financial support.