-
Paper Information
- Previous Paper
- Paper Submission
-
Journal Information
- About This Journal
- Editorial Board
- Current Issue
- Archive
- Author Guidelines
- Contact Us
International Journal of Applied Psychology
p-ISSN: 2168-5010 e-ISSN: 2168-5029
2015; 5(6): 165-172
doi:10.5923/j.ijap.20150506.04

Analyses of Quality of Work Life in Bangladesh: A Comparative Study on Software Firms
 Abstract
 Reference
 Full-Text PDF
 Full-text HTML
Saugata Bose
Department of Computer Science and Engineering, University of Liberal Arts Bangladesh, Dhaka, Bangladesh
Correspondence to: Saugata Bose, Department of Computer Science and Engineering, University of Liberal Arts Bangladesh, Dhaka, Bangladesh.
| Email: |  |
Copyright © 2015 Scientific & Academic Publishing. All Rights Reserved.
This work is licensed under the Creative Commons Attribution International License (CC BY).
http://creativecommons.org/licenses/by/4.0/

The research inclines to investigate the impact of “designation”, “experience” and “age” factors among software firm employees in Bangladesh on existing and expected quality of work life (QWL). A total number of 150 employees were selected from five (5) Software Firms on a stratified random sampling basis. For the purpose of this study nine determinants of QWL were selected on the basis of available literature. A structured questionnaire was framed to collect data from the respondents which embrace all the determinants of QWL and 150 employees were surveyed. Percentage analysis, Mean and standard deviation scores on all nine determinants of QWL and Z-test are used to analyze the collected data. A five point Likert scale was used to analyze the perception and expectations of the software firm employees about the quality of work life regarding their designation, experiences and age in the selected five software firms. The result indicates that the designation, experience and age of Software Firms employees in Bangladesh do not alter their rating of the existing and expected quality of work life (QWL). According to the study few suggestions were proposed to improve the present QWL environments of Bangladeshi software firms.
Keywords: Age, Designation, Job Experience, Likert Scale
Cite this paper: Saugata Bose, Analyses of Quality of Work Life in Bangladesh: A Comparative Study on Software Firms, International Journal of Applied Psychology, Vol. 5 No. 6, 2015, pp. 165-172. doi: 10.5923/j.ijap.20150506.04.
Article Outline
1. Introduction
- The fulfilment of personal needs, values and expectations define the quality of work life [1]. Work experiences and outcomes can affect a person’s general quality of life and they can affect QWL and family life [2]. To design a successful QWL policy, we need to make conscious actions on educational status of employees, living standard of employees, socio-economic condition of Bangladesh and satisfaction of employees. In our research, we have considered these issues to investigate QWL of software firm employees in Bangladesh. Software industry of Bangladesh is suffering from many problems: lack of well management, lack of well environment and resources, improper salary [3] constitutes poor quality of work life. This present study inspects the impact of designation, experience and age of software firm employees on existing and expected quality of work life (QWL). To complete this quantitative analysis, five software firms have been chosen. These firms are: “nazdaq Technologies Inc”, “M & H Informatics (BD) Ltd.”, “IBCS-Primax Software Bangladesh Ltd.”, “Southtech Limited” and “Enosis Solutions”. Earlier researchers investigate the impact of QWL in manufacturing industries. However, there was no study on impact of QWL in software industry of Bangladesh which accounts 2% of her GDP growth [4]. Earlier report stated that earning from outsourcing IT jobs has increased by 56% in 2013. In the 2011-12 fiscal years, the earning was USD 70.6 million, while it was USD 46.35 million in the 2010-11 fiscal years, referring to the ‘Digital World 2015’ report by Bangladesh Association of Software and Information Services (BASIS). According to BASIS officials, at present there are more than 500 software companies in the country [5]. This ongoing large size industry demands a study to analyze the employees’ psychology which will ultimately help its growth.The rest of the paper is organized as follows: in Section 2 objectives of the research are indicated; in Section 3 previous works are presented. Following this in Section 4, we discuss the methodologies implemented to prove our hypothesis and in Section 5 we analyse our findings and compare the analysis with our hypothesis. Finally, we draw our conclusion and propose few recommendations in Section 6.
2. Objectives
- The quality of organization depends on the quality of work. Employees’ perception of QWL affects his or her responses in work situation. QWL knowledge helps any manager to design policies to satisfy his or her employees. Additionally, QWL knowledge assists to analyze work place problems. Studies on QWL have been conducted in manufacturing organizations in many countries but studies on QWL in IT industry in Bangladesh have not found yet. This paper has the following objectives:A) To examine the impact of designation, experience and age on the QWL, which currently perceive by employees of the software firms.B) To inspect the impact of designation, experience and age on the QWL, which employees expect from their software firms.
3. Previous Works on Expected Quality of Working Life
3.1. Job Experiences, Designation
- Earlier it is identified that rewards positively relate to professionalism and job satisfaction [6], [7]. Besides, a difference between work values and job rewards has been spotted also [6]. Kalleberg states that “work values refer to general attitudes regarding the meaning that an individual attaches to the work role” [8]. He also argued that job satisfaction is affected by job rewards and job values. But he pointed that, if rewards can be provided as “financial reward”, employees receive more job satisfaction. And job satisfaction creates job values in turn. Likewise, many researchers have pointed out that, irrespective of gender, if job rewards are provided, job satisfaction is created successively. One of the research findings indicates a hard truth of present world where women receive lesser job rewards than their male counterpart [9]. Kalleberg had figured out earlier that each employee does not receive same job rewards. And it depends not only on how successfully he or she can finish his job but also the “class difference”, “occupation difference” plays its own role in decision making [10]. Ravinder pointed out another classical strategy: any manager can enhance the job satisfaction within his/her lower level employees section by giving them more decision making ability- “the autonomy” [11]. Another interesting research finding indicate that “job reward” strategy does not go with employees who are in higher level and in turn job satisfaction in higher level structure is significantly low [12]. So, if any manager plans to involve those higher level employees more in jobs, the findings of Sekaran will give them a second thought. Sekaran stated that, job satisfaction has no direct relation with job involvement [13]. But it increases with the importance of the job.
3.2. Age Differences
- Some researchers point out that “demographic differences” among employees positively relates to job satisfaction within aged workers [14]. They have figured out that job rewards of any type have no connection to job satisfaction. An interesting statement has made by Kalleberg that aged workers are more satisfied in their jobs rather than their younger counterpart [8]. And following this, Kalleberg and Loscocco had concluded that as employees spent more years in their jobs, they get more experience and job satisfaction increases in this line [9]. They also concluded that up to age 40, employees are more interested in receiving intrinsic awards like “Committing to a meaningful purpose”, “Choosing the best way of fulfilling that purpose”, “Making sure that one is performing work activities competently” and “Making sure that one is making progress to achieving the purpose” and this phase arrives again after age 61. Between ages 41-60, they have found no extreme relationship between age and intrinsic awards [9]. We have found only a single research on QWL in Bangladesh where Wadud stated that young and highly experienced employees are more aware of QWL rather than the aged and less skilled employees [15].
4. Research Methodologies Adopted
- To achieve the objectives, the following hypothesis has been formulated and tested:H0 = “The ratings of existing and expected quality of work life in software industry of Bangladesh depends on whatever designation, experience and age the employees have.” To disprove this null hypothesis, a questionnaire method has been chosen which is free from bias of the interviewer and large sample can be made use of and thus the result can be more dependable and reliable.
4.1. Sample
- For this present study, the sample size was 150 employees working in the selected five leading software firms in Bangladesh (“nazdaqTechnologies Inc”, “M & H Informatics (BD) Ltd.”, “IBCS-Primax Software Bangladesh Ltd.”, “Southtech Limited” and “Enosis Solutions”). For selecting the sample stratified random sampling techniques were used. Using proportional allocation method, the sample size of different selected software firms has been shown in Figure 1 and the demographic variables of the respondents have been shown in Figure 2.
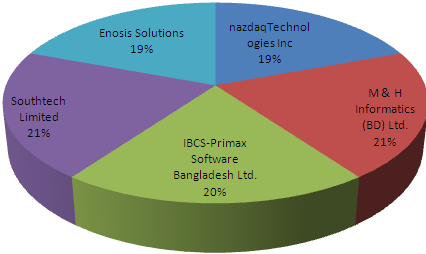 | Figure 1. Firm wise distribution of sample employees |
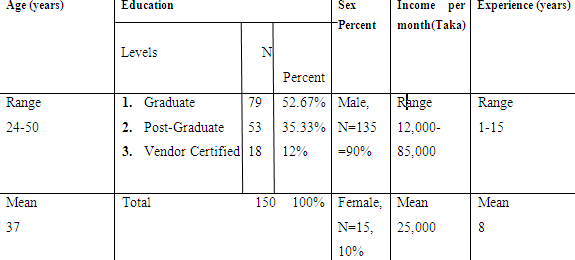 | Figure 2. Demographic variables of the sample employees (N=150) |
4.2. Measuring Instrument
- Earlier security, autonomy, equity of pay, rewards, satisfaction, involvement and stress were identified as the factors to measure QWL [16]; we have chosen 9 QWL features based on this observation to develop our questionnaire. Those selected features are: a) Decision making Ability, b) Career Prospect in that firm, c) How safe and secure his/her job is there, d) Achievement, e) Compensation, f) Communication among colleagues, g) Recognition and praise, h) Pay and allowance and i) Working condition. The employees of those selected firms were requested to rate the questions based on a five point scale (where lowest score is 1 and highest score is 5). It was decided that if the mean score arrives less than 3, it will signify as low score [17].The questionnaire has 2 parts: Section 1: 9 questions were developed to identify existing quality of the working life of the employee.Section 2: Similarly 9 questions were developed here to find out employee’s expectation of working environment.
4.3. Analysis and Interpretation
- Few statistical tools have been chosen to analyze the data: Percentage Analysis, Mean and standard deviation scores and Z-test.
5. Data Analysis
- A five point Likert scale has been used to analyze the existing and expected QWL of the software firm employees based on their designation, experiences and age. For analysing purpose, sample (employees) were divided into groups based on designation (Software Engineer, Senior Software Engineer, Software Analyst and Software Architect), experience (up to 4 years, 5-10 years and more than 10 years) and age (up to 30 years, 31- 40years and above 40 years).
5.1. Findings
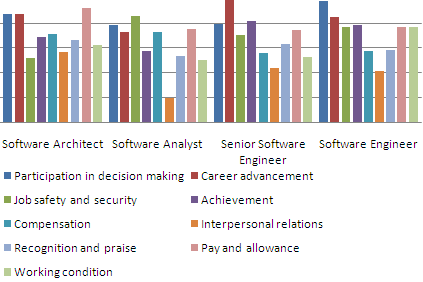
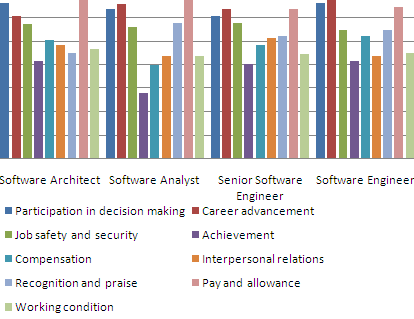
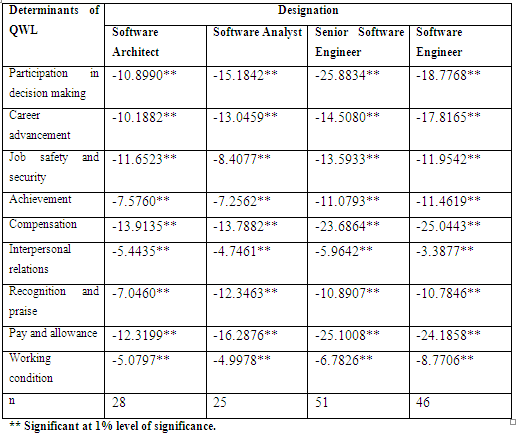
- Figure 3 to Figure 7 has displayed the mean scores, standard deviation scores and z test scores of the responses across designation. Figure 3 and Figure 4 presents the mean and standard deviation scores of the software firm employees across designation for existing QWL.Following this, Figure 5 and Figure 6 shows the mean and standard deviation scores across designation for all the determinants of expected QWL.After analysing the data using mean and standard deviation, Z-test has implemented on these scores and the results have been summarized in Figure 7. Here up to 1% level of significance was considered.
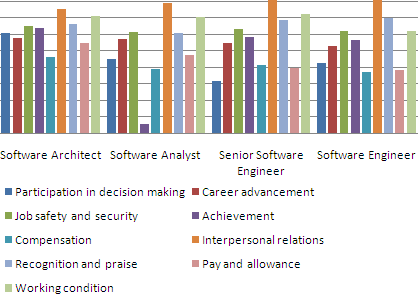 | Figure 3. Mean scores of the existing QWL instruments across designation |
 | Figure 4. Standard Deviation scores of the existing QWL instruments across designation |
 | Figure 5. Mean scores of the expected QWL instruments across designation |
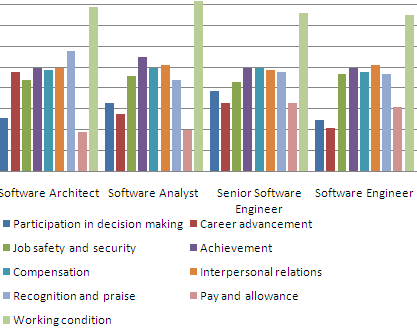 | Figure 6. Standard Deviation scores of the expected QWL instruments across designation |
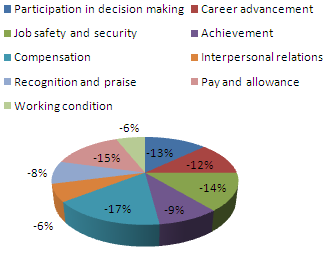 | Figure 7. Z-values across designation of existing and expected QWL determinants gap |
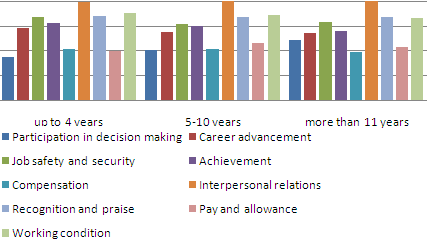 | Figure 8. Mean scores of the existing QWL instruments across experience |
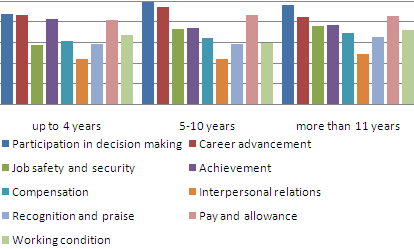 | Figure 9. Standard Deviation scores of the existing QWL instruments across experience |
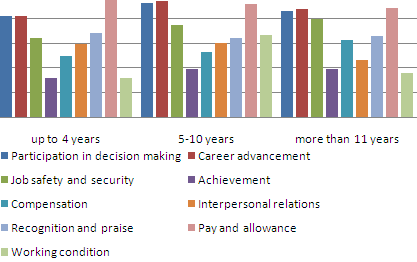 | Figure 10. Mean scores of the expected QWL instruments across experience. |
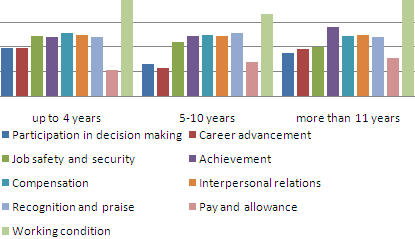 | Figure 11. Standard Deviation scores of the expected QWL instruments across experience. |
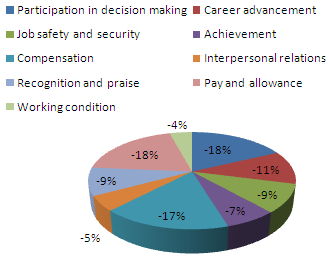 | Figure 12. Z-values across experience of existing and expected QWL determinants gap |
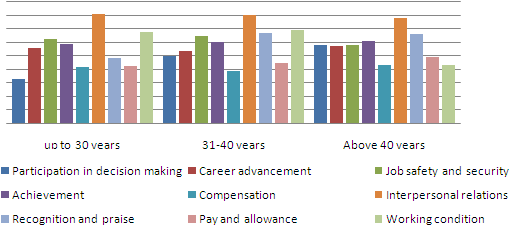 | Figure 13. Mean scores of the existing QWL instruments across age |
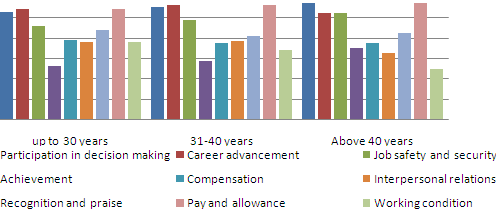
 | Figure 14. Standard Deviation scores of the existing QWL instruments across age |
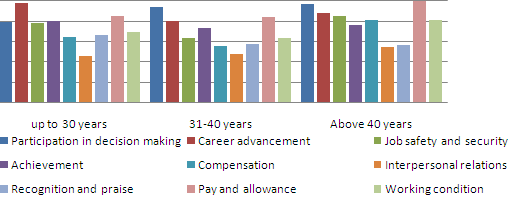
 | Figure 15. Mean scores of the expected QWL instruments across age |
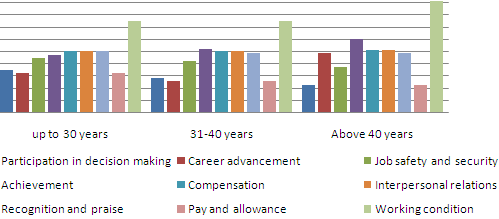 | Figure 16. Standard Deviation scores of the expected QWL instruments across age |
 | Figure 17. Z-values across age of existing and expected QWL determinants gap |
5.2. Interpretation of Findings
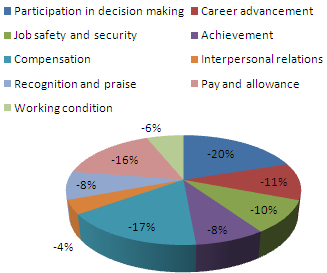
- The analyses of the existing and expected scores are following:∆ Figure 3 and Figure 4 expresses that employees describe existing QWL of their firm is not up to the mark regardless of their designation. Here, we have found that, the ratings given by employees’ on each measuring instrument depict “low score. Yet the scores for “Interpersonal relations” instrument in Senior Software Engineer (Mean score is 4.08) and Software Engineer rank (Mean Score is 4.15) depict high among others. Besides, “Job Safety and Security” instrument rated as second highest. Though ‘Achievement’ instrument depict low mean for Software Analyst (Mean Score is 0.300). And for both Software Analyst and for Software Engineer rank, deviation score depicts low value (0.20 and 0.42). It indicates that IT professionals care ‘Interpersonal Relation’ more at present.∆ From Figure 5, it is found that expected mean scores are very high (all scores are above 4) for all 9 features in each and every designation. In Figure 6, the standard deviation scores of ‘Working Condition’ is very high referring that, the perception varies on employees. »» The Z –test ((raw data - mean) / standard deviation) values displayed in pi chart at Figure 7 reveal that employees’ perception on QWL varies insignificantly regardless of their designations as because of all the Z values are displaying negative values which are less than their mean values which were illustrated in Figure 18.∆ If we carefully examine Figure 8 and Figure 9, it is clearly stated that, employees’ perception on existing QWL of their firms is not fluctuated enough: rather the graph resembles more or less identical shape. Here, employees’ have given lowest ratings to “Participation in decision making”, “Pay and allowance”, “Compensation” and “Career advancement” features. Again, ‘Interpersonal Relation’ (Mean Scores are 4.00, 4.03 and 4.02) and ‘Job Security and Safety’ marked as highest rated (Mean values are 3.36, 3.08 and 3.16) instrument by the employers across experience. Besides, Figure 9 depicts that standard deviation scores of ‘Interpersonal Relation’ varies less (0.44, 0.44 and 0.49) comparing the other instruments. Rather currently, employees perception on present condition in decision making scenario in their office varies greatly (0.88, 1.00 and 0.97) across the experience.∆ Figure 10 has shown us that employees prioritize mostly ‘Career Advancement’ (Mean Scores are here 4.82, 4.92 and 4.88) and ‘Achievement’ (Mean values are here 4.32, 4.39 and 4.39) issues when they have already over 5 years experience in IT arena. And Figure 11 has shown that these 2 instruments varies insignificantly as their standard deviation scores are less (0.48, 0.49 and 0.56 for ‘Achievement’ and 0.39, 0.23 and 0.38 for ‘Career Advancement’) than other’s scores. Across experience, it was found that, perception differ greatly for ‘Working Condition’ instrument in IT sector (0.78, 0.67 and 0.84).»» The result appears in Pi chart of Figure 12 has illustrated that, employees’ perception on their present QWL and their expected QWL are varying insignificantly regardless of their experience level as Z values display negative scores.∆ If we analyze Figure 13 and Figure 14 on the basis of age of the employees’, we have found that the scores are more or less same for each 9 features. Nevertheless, employees who have less than 31 years age rate “low score” on “Participation in Decision Making” and employees across each age sections rate low on “Compensation” feature.∆ Similarly, as other cases, the high value appears in Figure 15 and Figure 16 for expected QWL in each and every age sections.»» From Figure 17 in Pi chart of the Z-test scores it is clear that employees perception on QWL does not vary much regardless of their age.
 | Figure 18. Z-values across designation |
5.3. Comparison with the Hypothesis
- The findings disagree the hypothesis we set earlier during our research period and the finding is likewise, Hoque and Rahman’s statement on QWL that it differs insignificantly regardless of age, education, experience and income of the workers [18]. However it differs with Ghosh and Kalra ’s finding which is age, income, qualification, experience, etc. affects QWL [19] and with Kumar and Shanubhogue ’s verdict that the QWL was affected by designation [20].
6. Conclusions and Recommendations
- The analysis of the employees’ responses on existing and expected QWL states thatΦ The perception of QWL has no relation with designation, age and experience of employees in software industry. This conclusion was derived from the findings that, the Z scores are producing negative values. Thus it was concluded that the ratings are not following the mean scores which ultimately points that, QWL perception of software firm employees does not depend on their age, designation and experience. Φ The analysis shows that, employees feel software industry lacks few features such as Participation in decision making, Pay and allowance, Compensation and Career advancement in Bangladesh at present as they rated high against those instruments.The research has its own limitations. It is very difficult to come to a conclusion where employees are divided into geographical boundaries (they are from various corners of Bangladesh), religious beliefs (they have different beliefs), socioeconomic boundaries. But a sincere effort was given to reduce these constraints by interviewing every employee personally. Therefore, we can be assured that the findings of our research are not affected by the presumed limitations.