Galvin Alaan Galeon
University of San Jose-Recoletos, Cebu City, Philippines
Correspondence to: Galvin Alaan Galeon, University of San Jose-Recoletos, Cebu City, Philippines.
| Email: |  |
Copyright © 2015 Scientific & Academic Publishing. All Rights Reserved.
Abstract
This research basically investigates the factors that influenced the results of the students’ evaluations of the teaching performance of the college faculty members. Utilizing a multivariate analysis, this study determines factors in the profile of the students’ classes and the profile of the college teachers that affect the evaluations on the college faculty performance. Results revealed that the student evaluations of the teaching performance of the college faculty are partly related to the profile of the college faculty and the profile of the students’ classes. These findings suggest that generalization about the evaluations of the teaching performance of faculty member should be viewed cautiously especially when they are used for administrative purposes such as permanency, tenure, promotions and other rewards.
Keywords:
College faculty, Filipino teachers, Teaching performance, Student evaluations
Cite this paper: Galvin Alaan Galeon, Correlates of the Teaching Performance of the College Faculty Members, International Journal of Applied Psychology, Vol. 5 No. 3, 2015, pp. 64-72. doi: 10.5923/j.ijap.20150503.02.
1. Introduction
Evaluation of the employees’ performance is considered essential in most organization. This can be used to determine how the individual employee contributes to attaining the goals of the organization. Feedback of these evaluation results may lead the employees to increase their productivity, improve their morale and motivation and allow collaboration to ensure the realization of the organization’s goals and objectives [2]. Educational institutions are organizations with its vision, mission, goals and objectives. Hence, it is not surprising that like any other organizations, it constantly evaluate its employees’ performance especially the teachers who are considered to be the backbone of the educational institution. By evaluating the teachers’ performance, the teachers’ strengths, and weaknesses may be identified.Castetter, [4] contended that teacher performance appraisal can be an effective mean to identify the teachers’ developmental needs. Information from evaluation process and inventory of needs are important inputs to the faculty development process and improvement of the teaching-learning situation. If the teachers’ strengths and weaknesses are identified, they could be the bases for planning an appropriate faculty development program that would ensure the attainment of the school’s vision, mission, goals and objectives.However, [1] also contended that performance reviews seem to be a lightning rod for disappointment, dread and even wrath on the part of the employees who have to be reviewed. According to his research, it is hard to find people who expressed satisfaction with the review process. He further argued that it is not an understatement to say that, by and large, almost everyone hates it and mostly for very good reasons.In many educational institutions, students’ evaluations of the teacher’s performance are given importance. Student ratings are one of the several methods used by educational institutions to evaluate a faculty member’s teaching performance. This is a practice continued in the University of San Jose-Recoletos (USJ-R). Every semester, a faculty member is evaluated by his/her students. Through the students’ evaluations, his/her strengths and weaknesses are identified. But results of these evaluations from students may be a source of anxieties and disappointments among faculty members. They may wonder what really influence the evaluations of their teaching performance. Could it be the students’ grades, gender dominance in the classroom or the class size? Moreover, they may also ask whether there are factors in their profile that may have influence on the students’ evaluations of their teaching performance. And if so, what are those factors?This study therefore explore the questions postulated above by determining factors in the profile of the students and the faculty members that may influence the results of the students’ evaluations on the faculty’s teaching performance.
2. Materials and Methods
The participants of this study were eighty (80) out of the one hundred thirty-three (133) permanent full-time college faculty members of the different colleges of the university whose teaching performances have been evaluated by their respective students during the second semester of the school year 2006-2007. These faculty members were selected through cluster and random sampling methods. The teacher’s grade sheets and the copies of feedbacks on the student evaluations of the teacher’s performance were the main instruments of this study. A descriptive-correlation method of investigation utilizing a multivariate analysis was used to determine which factor/s in the profile of the students’ classes and the profile of the college faculty member affect the student evaluations of the college faculty performance. Specifically, Pearson-Product-Moment Coefficient of Correlation and Chi-Square were performed using SPSS (Statistical Program for Social Sciences) to determine their relationships.
3. Findings and Discussions
Profile of the College Faculty MembersSexChart 1 presents that majority of the college faculty members of the university are female. Females composed 61 percent of the total population. Only 39 percent are males.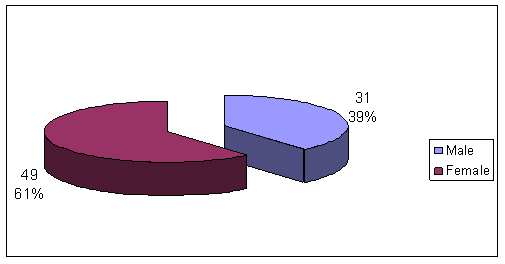 | Chart 1. Distribution of the College Faculty Members In Terms of Sex |
It is not surprising to notice that majority of the college faculty members are women since traditionally teaching has been reserved to women. Teaching, especially in primary education belongs to range of career choices among women. Bocco [3] highlighted that while women’s liberation did much to fight job stereotypes, some jobs are still predominantly female. These jobs include teaching, clerical work, childcare, and nursing.Civil StatusChart 2 shows that the college faculty members of the university are predominantly married. Only 25 percent of the college faculty members are single while 75 percent of them are married. The ratio then between single and married faculty member is 1: 3.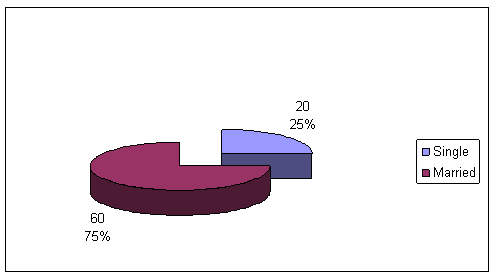 | Chart 2. Distribution of the College Faculty Members In Terms of Civil Status |
It should be noted that most of the college faculty members of USJ-R are middle adults. Hoyer & Roodin [10] wrote that during adulthood the vast majority of individuals enter what they consider to be the most intense and important relationship which is marriage.Virola [14] also found out that among the Filipinos, about four in ten brides got married when they were between 20-24 years old, while most grooms decided to “tie the knot” at ages 25-29. These ages coincide with their young adulthood years.AgeThe ages of the college faculty of the university range between 26 years to 60 years old. Their mean age is 42.45 which indicated that most of them are middle adults. Chart 3 shows that many of the faculty members (19%) are between the ages of 31-40 years of age. Nevertheless, there is only a slight difference in the percentage distribution of the faculty members according to their age brackets. Their ages therefore, are widely distributed throughout the different brackets. In fact, it has a standard deviation of 8.77 which denotes that the population is widely dispersed.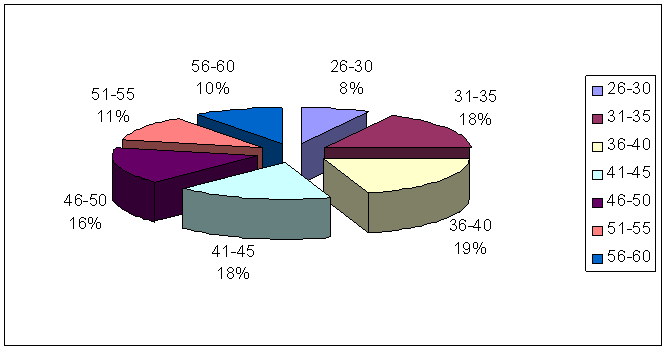 | Chart 3. Distribution of the College Faculty MembersIn Terms of Age |
Donald Super in [9], theorizes considerable stability in vocational choice happens during young adulthood (22-40 years old). He contended that at this stage of life there will be little movement away from the specific career they have selected. Some young adults may try to move up their career ladder by changing positions within a company or by moving to a different company. However, it is usually in midlife that an adult may become serious about a completely new vocation.Hence, at these age brackets, presented above, these faculty members may have already developed considerable attachment toward their profession and made some advancement in their career.Years of TeachingThe years of teaching experiences of the college faculty members of the university ranges between 3 to 36 years (M = 15.41). It should be noted that the researchers only include the full-time permanent faculty members in their study. And it took three continuous years before a full-time college faculty could become a permanent employee [12]. Hence, the lowest teaching experience is three years.However, Chart 4 shows that the majority of the college faculty members of the university are well-experienced in their teaching career. Most Josenian teachers (32%) have rendered 8-12 years in their profession. They are followed by teachers who teach for 13-17 years (26%). Some 8 percent are in the teaching career for 33-37 long years.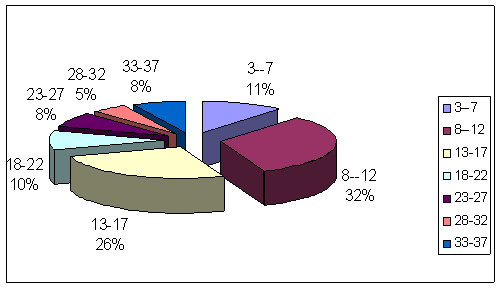 | Chart 4. Distribution of College Faculty Members In Terms of Years of Teaching |
Educational AttainmentChart 5 shows that almost half of the college faculty members (46%) of the university finished a master’s degree. They are followed by faculty members who have doctoral degrees (19%). Some faculty members (18%) who had already their master’s degrees are also pursuing doctoral degrees or have taken up some doctoral units.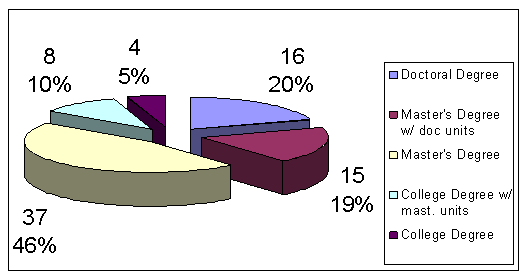 | Chart 5. Distribution of the College Faculty Members In Terms of Educational Attainment |
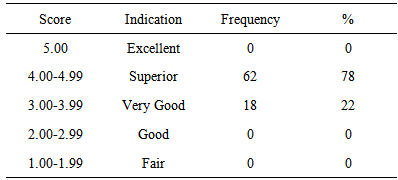
Only 5 percent of the college faculty members of the university have the minimum required degree (college degree). They may be given permanency because of the number of years that they had rendered to the university.Performance RatingsThe performance rating of the college faculty members of the university as given by their students ranges between 3.41 (good) to 4.83 (very good). Their mean is 4.21 (very good) with a standard deviation of .32 which means that generally that performance ratings of these teachers converged to the mean. Hence, in general, they are rated as “very good”.Table 1. Distribution of the College Faculty Members In Terms of Their Performance Ratings
 |
| |
|
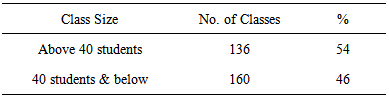
Table 1 shows that 78 percent of the college faculty members of the university were rated “very good” in their teaching performances by the students. Some 22 percent were rated “good”. Nobody was rated “excellent” but neither was also rated “fair” nor “poor” respectively.Profile of the Students’ ClassesClasses SizeThe number of students in classes that evaluated the college faculty members ranges from 3 to 54 students. Its mean is 36 with a standard deviation of 9.4 denoting wide dispersion of the number of students in a class. Table 2 shows that 54 percent of the classes were composed of 40 students and below while 46 percent were composed of more than 40 students. It should be remembered that the PAASCU accreditors recommended that classes are ideally composed only of 40 students or below.Table 2. Profile of the College Students in Terms of the Class Size
 |
| |
|
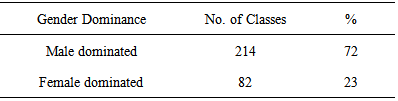
Gender DominanceTable 3 shows that classes which gave evaluations to the college faculty members of the university were female dominated. They composed 72 percent of the total classes considered in the research. Only 23 percent of the classes were male dominated.Table 3. Profile of the College Students In Terms of Gender Dominance
 |
| |
|
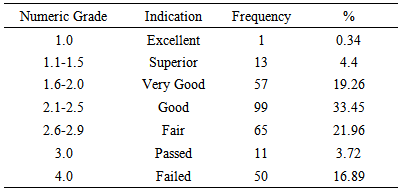
Midterm GradesThe class’s midterm grades were obtained by taking the average of the midterm grades received by every student in the class. After all computations, it was found out that their class’s midterm grades range from 1.04 to 3.89. The mean of those grades is 2.46 which suggest that basically the students are doing “good” in their classes. It has a standard deviation of .59 indicating that the midterm grades of the classes that evaluated the performances of the college faculty members were near to the mean. Table 4 shows the distribution of the midterm grades of the classes that were involved in this study.Table 4. Distribution of the Student’s Classes In Terms of Their Midterm Grades
 |
| |
|
Majority of the classes (33.45 percent) got a midterm grade that ranges between 2.1 – 2.5 (good). Some classes (21.96 percent) got midterm grades between 2.6 – 2.9 (fair). There were also classes (19.26) that got 1.6 – 2.0 (very good) for their midterm grades. Moreover, some other classes (4.4 percent) got midterms grades between 1.1 – 1.5 (superior). On the other hand, there were 50 classes (16.89 percent) that got failing grades (4.0) during the midterm period.Interestingly, it was found out that those classes that have above 40 students (M=2.34, SD=.54) received better midterm grades than those classes that have only 40 students or below (M=2.56, SD=.61).Relationships between the Profile of the College Faculty Members and the Student Evaluations of the Teacher’s PerformanceThe Sex and the Performance Ratings of the College Faculty MembersGraph 1 shows that male college faculty members (M=4.23) of USJ-R received a slightly higher performance rating from their students than the female college faculty member (M=4.2). Nevertheless, both of them were rated “very good” by their students as indicated in the interpretation of those scores. It showed that generally students were satisfied with their teaching performance.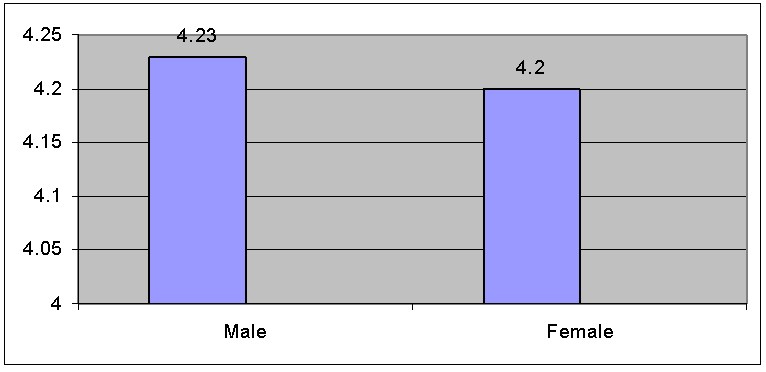 | Graph 1. The Sex and Performance Ratings of the College Faculty Members |
To a certain degree, this finding supported previous studies which found out students to perceive male instructors as more competent and female than female instructors (Lombardo & Tocci, 1979 as cited in [7], [11]. Nevetheless, the found out difference is too small that it is not statistically significant (χ2 = 0.278, p > 0.05). Therefore, there is no significant relationship between the student evaluations of the teaching performance and the faculty members’ sex.The Civil Status and the Performance Ratings of the College Faculty MembersGraph 2 illustrates that married college faculty members (M=4.23) of USJ-R were viewed by their students to have better performance compared to college faculty who are single (M=4.15). The difference (0.08) however is very small. The statistical treatment found no significant relationship (χ2 = 0.278, p > 0.05) between the civil status and the performance ratings of the college faculty members.Being single or married is therefore not a factor that affects the student evaluations of the teaching performance of the college faculty members of USJ-R.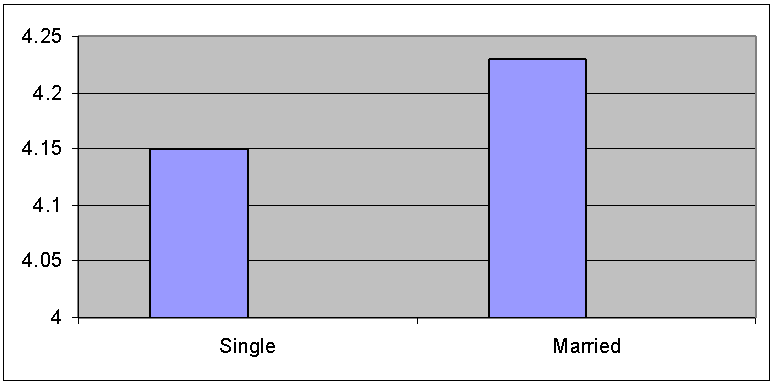 | Graph 2. The Civil Status and the Performance Ratings of the College Faculty Members |
The Ages and the Performance Ratings of the College Faculty MembersChart 6 shows that among the age brackets, those college faculty members of USJ-R who are between 36-40 years (M=4.31) were rated the highest by the students. Those who are between 26-30 years (M=4.27), 31-35 years (M=4.26) and 41-45 (M=4.27) were relatively given the same rate. The students gave lower performance ratings to college faculty who are between the ages of 46-55 (M=4.17). Drastically, the ratings fall down among college faculty members who are between 56-60 years of age (M=3.88).It is shown that the age of the faculty members is significantly related to their student evaluations of their teaching performance. There is a negative relationship (r = - 0.302, p < 0.05) between the age of the faculty and the performance ratings given to them by their students. Hence, as the age of the faculty member increases, his/her performance rating decreases.This result contradicts [9] who found out that age is unrelated to the overall teaching evaluations by their students. So, what may explain this phenomenon? Linda Creighton [6] wrote that with many universities and colleges instituting post-tenure review and tying merit pay raises and awards to periodical evaluations of teaching performance, it is becoming even more important for senior faculty to keep their teaching skills sharp. And in this regard, administrators say that experienced faculty members are often the first to identify the problem.Why? George Pearson (cited by [6]) observed that most of older faculty members are so set in their ways that they are not interested in changing anything. In addition, the workload of senior faculty can often be more demanding than that of younger colleagues, with the never-ending duties of teaching, faculty committee work, and student advisory responsibilities. Moreover, time and intellectual energy of maintaining research could add up to the abovementioned workloads of the faculty member.Similar workloads mentioned above may have also affected the teaching performance of the faculty and thus the performance ratings given by the students to the aging college faculty members of USJ-RThe Years of Teaching and the Performance Ratings of the College Faculty MembersChart 7 shows that the college faculty members of USJ-R who had 3-7 years of teaching experience (M=4.31) received the highest ratings from their respective students. Slightly, the ratings fall down among those who had 8-12 years of teaching experience (M=4.21). The ratings increase and remain constant for those who are teaching for 13-22 years (M=4.29). But again, ratings fall down among college faculty members who served for 23-27 years (M=4.12) and among those who served for 28-32 years (M=3.9) and 33-37 years (M=3.94) respectively.There is a significant negative relationship (r = 0.280, p < 0.05) between the years of teaching of the faculty member and the student evaluations of their teaching performance. Thus, the longer the number of years of teaching of the faculty member, the lower is his/her performance rating by the students.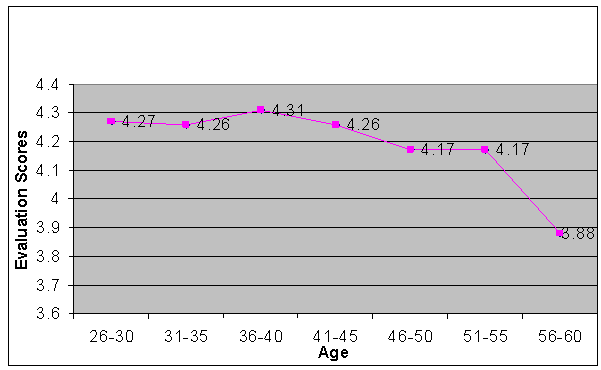 | Chart 6. Distribution of the College Faculty MembersIn Terms of Age and Performance Ratings |
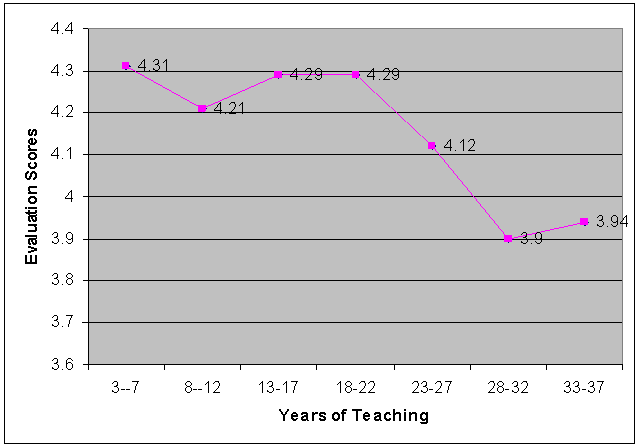 | Chart 7. Distribution of the College Faculty MembersIn Terms of Years of Teaching and Performance Ratings |
Of course, years of teaching come with age. Hence, the writing of [6] on improving teaching with age may as well explain the occurrence of this phenomenon. In this article, she wrote her concern for older faculty in order for them to stay sharp and productive as a teacher despite their age. This is so, because as per observation, older teachers have become uninteresting to students in the classrooms. So, she suggested that university administrators has to find ways to balance the benefits of experience, knowledge, and wisdom provided by older faculty members with the occasional need to help faculty remain innovative, creative, and exciting in their classrooms particularly in undergraduate teaching.The Educational Attainment and the Performance Ratings of the College Faculty MembersGraph 3 shows that college faculty members of USJ-R who have doctoral degrees (M=4.37) got the highest ratings from their students. They are followed by college faculty members with masteral degrees and doctoral units (M=4.19), with masteral degrees (M=4.18) respectively. College faculty members with only a college degree (M=3.93) got the lowest rating from the students. These differences however, are not statistically significant (χ2 = 0.198, p > 0.05). Hence, there is no significant relationship between the educational attainment of the faculty member and the student evaluations of the teaching performance. | Graph 3. Distribution of the College Faculty Members In Terms of Educational Attainment and Performance Ratings |
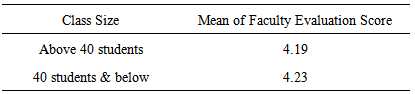
Relationships between the Profile of the Students’ Classes and the Student Evaluations of the Teacher’s Performance.The Students’ Class Size and the Performance Ratings of the College Faculty MembersTable 5 below shows the difference in the means of the college faculty members’ teaching performance ratings as given by their students.Table 5. Distribution of the Students’ Classes In Terms of Class Size and Their Evaluation of Faculty Performance
 |
| |
|
Among the students from classes with above 40 students, the college faculty members received performance ratings that range between 2.94 (fair) to 4.94 (very good). The mean of their performance ratings is 4.19 (very good) with a standard deviation of 0.37 which means that their performance ratings in these classes converged to the mean.On the other hand, classes with 40 students and below gave the performance of their teachers a rating that ranges between 3.12 (good) to 4.85 (very good). Their ratings’ mean is 4.23 (very good) with a standard deviation of 0.34 indicating that the performance ratings of these teachers fall nearest to the mean. But statistically, there is no significant relationship (χ2 = 0.222, p > 0.05) between the class size and the student evaluations of the teaching performance.However, when the class sizes are categorized as shown in chart 8, the differences between the means of the student evaluations of teaching performance of the faculty become more elaborated. College faculty received higher evaluation scores among classes with lesser number of students.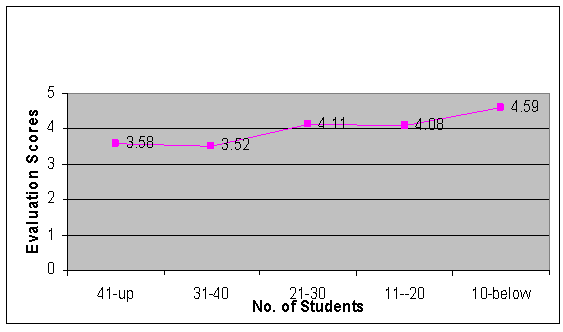 | Chart 8. The Class Size and the Performance Ratings Of the College Faculty Members |
This finding is in line with the study of [11] who found that as class size goes up the performance ratings of teachers from their students become lower. It also supported [14] who observed that large classes seem to be less satisfactory to the students than classes of less than forty. Again, it should be noted that there is a substantial research linking student satisfaction to effective teaching. This could be because students learn more in small classes than they do in large classes. As [5] said, small classes allow for more personal attention that leads to increased learning. Hence as the number of students in the classroom increases, there is a great tendency that the student evaluation of the teacher’s performance decreases.The Gender Dominance in the Class and the Performance Ratings of the College Faculty MembersGenerally, female dominated classes (M=4.21, SD=0.37) gave higher performance ratings to the college faculty members than the male dominated classes (M=4.19, SD=0.32).Male college faculty members also received higher evaluation scores from female dominated classes (M=4.28, SD=0.30) compared to male dominated classes (M=4.20, SD=0.28). However, female college faculty members received almost equal evaluation scores from both male dominated classes (M=4.19, SD=0.36) and female dominated classes (M=4.18, SD=0.40).There is a significant relationship (χ2 = 0.825, p < 0.05) between the gender dominance in a class and the student evaluations of the teaching performance, with female dominated classes giving higher performance ratings to the faculty members than the male dominated classes. This is regardless of the sex of the faculty member.The finding of this study added a new variation in the influence of the student evaluations of the teacher’s performance. It should be remembered that Basow & Distenfeld, 1985; Basow & Howe, 1987; Bennet, 1982; Elmore & LaPointe, 1974; Harris, 1975; and Kaschak, 1981 as cited by [5] found no or extremely small differences between the evaluations of female and male instructors on the basis of the student’s gender alone.The Midterm Grades of the Class and the Performance Ratings of the College Faculty MembersChart 9 presents the spread of the midterm grades of the classes and the evaluation scores received by the college faculty members of USJ-R from their students.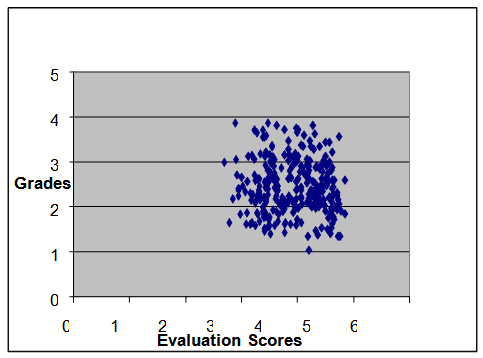 | Chart 9. The Class Midterm Grades and the Performance Ratings of the College Faculty Members |
When treated statistically, it was found out that there is a significant positive relation (r =0.268, p < 0.05) between the midterm grades of the students and the performance ratings of the college faculty members given to them by their students. It was shown that as the midterm grades of the students increase, the performance ratings given by the students to their teachers also increase.Although the correlation is typically small, it still clearly supports the leniency hypothesis of Wachel (1998) as cited by [8]. Thus, there might be a grain of truth in the contention that instructors can “buy” better evaluations by giving out higher grades to their students. It could be true that instructors with more lenient grading standards receive more favorable ratings from their students.
4. Conclusions
This study found out that student evaluations of the teaching performance of the college faculty of USJ-R are partly affected by the profile of the college faculty and the profile of the students’ classes that evaluated the teacher.As the age of the college faculty increases, his/her performance rating by the students decreases. It also shows that as the number of years of teaching of the college faculty increases, his/her performance rating by the students decreases. And lastly, when grades of the students in the class increase, their performance ratings of the college faculty also increase.The above-mentioned findings suggest that generalization about the evaluations of the teaching performance of the college faculty member should be viewed cautiously especially when they are used for administrative purposes such as permanency, tenure, promotions and other rewards.
References
| [1] | Bacal, R. (2004). Manager’s Guide to Performance Reviews. U.S.A.: McGraw –Hill. |
| [2] | Bacal, R. (1999). Performance Management. U.S.A.: McGraw –Hill. |
| [3] | Bocco, D. What is a Pink Collar Job? Wise Geek, Conjecture Corporation. 2003. [WiseGeek]. |
| [4] | Castetter, W. B. (1981). The Personnel Function in Educational Administration. New York: McMillan Company. |
| [5] | Centra, J. A. & Gaubatz, N. (2000). Is there gender bias in student evaluations of teaching? The Journal of Higher Education (Columbus, Ohio) 71 no. 1, 17-33. |
| [6] | Creighton, L. Teaching Toolbox – Improving With Age. Asee Prism. 2001[Asee Prism Online]. |
| [7] | Fandt, P. M., & Stevens, G. E. (1991). Evaluation bias in the business classroom: Evidence relating to the effects of previous experiences. The Journal of Psychology, 125, 469-477. |
| [8] | Grump, S. E. (2007). Student evalautions of teaching effectiveness and the leniency hypothesis: A literature review. Educational Research Quarterly. 30 no. 3, 55-69. |
| [9] | Heckert, T. M., Latier, A., Ringwald, A., & Silvey, B. (2006). Relation of course instructor, and student characteristics to dimensions of student ratings of teaching effectiveness. College Student Journal. 40 no. 1, 195-204. |
| [10] | Hoyer, W. J. & Roodin, P.A. (2003). Adult Development and Aging. 5th edition. New York: McGraw – Hill. |
| [11] | Smith, S.W., Yoo, J. H., Farr, C. A., Salmon, C. T., and Vernon, D. Miller (2007). The influence of student sex and instructor sex on student ratings of instructors: Result from a college of communication. Women’s Studies in Communication. 30 no. 1, 64-78. |
| [12] | USJR (2004). Faculty Manual. 2004 edition. Cebu City, Phil: University of San Jose-Recoletos. |
| [13] | Virola, R. A. (2008). Are Marriage Patterns of Pinoys Changing? National Statistical Coordination Board. 2008. [PSA-NSCB]. |
| [14] | Wilson, W. R. (1999). Students rating teachers. The Journal of Higher Education (Columbus, Ohio) 70 no.5, 562-71. |
 Abstract
 Reference
 Full-Text PDF
 Full-text HTML