-
Paper Information
- Previous Paper
- Paper Submission
-
Journal Information
- About This Journal
- Editorial Board
- Current Issue
- Archive
- Author Guidelines
- Contact Us
International Journal of Applied Psychology
p-ISSN: 2168-5010 e-ISSN: 2168-5029
2015; 5(2): 33-44
doi:10.5923/j.ijap.20150502.03
The Effect of Removing Examinees with Low Motivation on Item Response Data Calibration
 Abstract
 Reference
 Full-Text PDF
 Full-text HTML
Carlos Zerpa1, Christina van Barneveld2
1Faculty of Health and Behavioural Sciences, School of Kinesiology, Lakehead University, Thunder Bay, Ontario, Canada
2Faculty of Education, Lakehead University, Thunder Bay, Ontario, Canada
Correspondence to: Carlos Zerpa, Faculty of Health and Behavioural Sciences, School of Kinesiology, Lakehead University, Thunder Bay, Ontario, Canada.
| Email: |  |
Copyright © 2015 Scientific & Academic Publishing. All Rights Reserved.
The purpose of this study was to evaluate the effect of removing examinees with low motivation on the estimates of test-item parameters when using an item response model (IRM) for large-scale assessment (LSA) data. This study was conducted using a Grade-9 LSA of mathematics. Current IRMs do not flag or filter the effect of low motivation on the estimates of test item parameters data calibrations used to assess examinee abilities and design exams for LSA. The effect of low motivation may pose a threat to the validity of test data interpretations. Motivation, as defined by expectancy-value and self-efficacy theory, was identified from self report data using a principal component analysis (PCA). The PCA scores were used to create two groups of examinees with high and low motivation to examine the effect of removing examinees with low motivation on the estimates of test item parameters when comparing a standard 3-parameter logistic (3PL) IRM to a 3PL low motivation filter IRM. The results suggested that test item parameters seemed to be overestimated under the 3PL IRM when examinees with low motivation were not removed from the test data calibration. The outcome of this study supports the literature and may provide an avenue to flag the effect of low motivation on LSA data analyses.
Keywords: Low motivation, Item response model, Validity
Cite this paper: Carlos Zerpa, Christina van Barneveld, The Effect of Removing Examinees with Low Motivation on Item Response Data Calibration, International Journal of Applied Psychology, Vol. 5 No. 2, 2015, pp. 33-44. doi: 10.5923/j.ijap.20150502.03.
Article Outline
1. Introduction
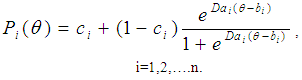
- Item response theory (IRT) models have been used in conjunction with large-scale assessments (LSA) to examine the interactions between examinee abilities and test items. Both professionals and researchers use IRT models to design tests, assess educational programs, evaluate examinees’ achievement and performance, and predict examinees’ responses [4, 10, 34, 45, 46, 76]. In some situations, however, the item response theory models used to estimate examinee abilities and performance do not account for test taking behaviours such as guessing, omitting questions on the test that manifest as a result of low motivation, especially in situation when the test has no consequences to student academic grades [39, 40]. That is, if students know that the test does not count toward their academic grade, they may not put forth the best effort in providing the correct response to the test questions [9]. As a result, these test taking behaviours pose a threat to the validity of large-scale assessment data interpretations [9, 41].There are several IRT models which are considered appropriate for dichotomous item response data (e.g., true and false questions or multiple choice questions) to assess student academic performance in large-scale assessments and make informed decisions in the educational system [4, 24, 27, 35]. Unfortunately, none of these models account for the effect of low motivation when estimating student abilities and designing exams. For our study, the focus was on examining the extent to what low motivation affected the parameter estimates of a three parameter logistic model (3PL IRM), which is usually used in LSA to estimate student academic abilities and design exams. The 3PL IRM as depicted in Equation 1 was used because it was found to be the best fit for our data after conducting statistical curve fitting techniques (i.e., Chi-square goodness of fit test, likelihood ratios).
 | (1) |
 : is the probability that a randomly chosen examinee with ability answers item i correctly.bi: is the item level of difficulty.n: is the number of items in a test.e: is a numerical constant whose value is 2.718.ai: is the discrimination parameter, which is proportional to the slope of the item. ci: is the pseudo-chance parameter fixed at 0.20 for all items for the current study.D: is a scaling factor to make the logistic function as close as possible to the ogive function. The value of D is 1.702.Some properties of the 3PL IRT models are important for the current study- specifically, local independence and invariance. Local independence means that when examinees’ “abilities influencing test performance are held constant, examinees’ responses to any pair of items are statistically independent” (p.11) [24, 36]. That is, the relationship among the questions on the test is based on examinee ability, which is assumed not to change throughout the test. Invariance means that the parameter estimates should be the same regardless of the distribution of ability in the groups of examinees used to estimate the item parameters [24]. Said differently, if invariance holds, the parameters estimates of the model should be the same regardless of the ability distribution sample selected from the data.As previously stated, traditional IRT models used to validate and estimate test item parameters and student abilities do not filter the effect of low motivation on large scale assessment data calibrations. Student low motivation is a potential source of construct-irrelevant variance that can affect the pattern of examinee responses described by an IRT model posing a threat to the validity of the inferences made from test scores interpretations [9, 23, 26, 30, 39, 40, 41, 57, 81, 83]. Construct-irrelevant variance occurs when the assessment used to measure an educational or psychological construct includes measures that are not relevant to the intended construct, and cause scores to be different from what they should be [44, 69]. As a source of construct irrelevant variance, low motivation may cause test item parameters to be overestimated when using standard IRT modeling techniques to calibrate the large-scale assessment data [9, 76, 80]. The test item parameters as previously stated in Equation 1 include: 1) a-parameter or slope, which is used to discriminate low and high ability examinees 2) b-parameter or threshold, which used to indicate the level of difficulty of each question on the test 3) c-parameter, which is a fixed value and represents the probability of examinees with low ability providing a correct response to a question [24]. The overestimation of item parameters can affect the decision making process in relation to curriculum changes, allocation of funding, and the implementation of policies in the educational system.Some researchers, however, have included effort as a parameter estimate in the item-response model to account for the effect of low motivation on the estimates of test item parameters from large-scale assessment data [33, 81, 85]. For instance, Wise and DeMars [81] created an effort-moderated item response theory model to account for student low motivation as depicted in Equation 2. According to Wise and DeMars, when encountering an item, the examinee will engage in either solution or rapid guessing behaviour. If the examinee engages in solution behaviour, the probability of giving the correct response to an item increases based on examinee proficiency and this probability can be effectively modeled under a traditional item response model. On the contrary, if the examinee engages in rapid guessing behaviour, the probability of a correct response to an item remains near the level expected by chance, which is a constant probability regardless of examinee proficiency. In Wise and DeMars’ model as stated in Equation 2, the solution behaviour model is represented by a three parameter logistic model and guessing behaviour is represented by a constant probability. This constant probability is computed based on the reciprocal of the number of response options provided on the test.
 | (2) |
 : is the probability that a randomly chosen examinee with ability
  answers item i correctly.
 : examinee effort on the item.SBM: solution behaviour model.GBM: guessing behaviour model.Wise and DeMars compared the effort-moderated model as stated in Equation 2 to a standard IRT model as stated in Equation 1 to examine the IRT psychometric characteristics of the effort-moderated item response model. These comparisons included model fit, item parameter estimation, test information and convergent validity. The researchers selected 524 mid-year sophomores from a medium-sized southern US university and administered a low stake 60 items computer-based literacy test. During the test administration, the researchers collected response time for each examinee encounter with an item. The researchers dichotomized the response time into solution behaviour and rapid guessing behaviour by using a threshold value. A dichotomized value of 1 represented solution behaviour and a value of 0 represented rapid guessing behaviour, similar to the approach of Wise and Kong [82]. The researchers found that the item parameters from the effort-moderated model provided a better fit to examinees’ response patterns than the item parameters from the standard model. In terms of item parameter estimation, the two models differed in item discrimination parameters with the standard model yielding higher discrimination parameter estimates. The models also differed in item level difficulty. The mean difficulty was substantially higher under the standard model for easy items, but there were no substantial differences between the two models for the more difficult items. While Wise and DeMars’ modeling technique [81] is promising in including motivation as a parameter estimate in the item-response model by relating effort to motivation, a computer is required to measure examinee response time per item. Many large-scale assessments, however, are still conducted using pencil and paper. Another approach to examine the effect of low motivation in test item parameter calibrations would be to administer self-report measures of motivation questionnaires along with LSA as an avenue to implement motivation filtering when using IRT models [73, 79]. Self-report questionnaires have been used by other researchers in the past to measure student motivation in large-scale assessments. For instance, the Motivated Strategies Learning Questionnaire (MSLQ) [59] and the Student Opinion Survey [38, 72, 83] have been used to measure motivational beliefs and values of students ranging in age from late elementary to university. Marsh, Koller, Trautwein, Ludtke, and Baumert [37] developed a learning survey to measure: how much students look forward to learning mathematics; how important mathematics is to them; the importance of being a good mathematician; and the enjoyment of learning mathematics, by drawing on the expectancy-value theory of motivation. O’Neil, Abedi, Miyoshi, and Mastergeorge [47] used an adaptation of the State Thinking Questionnaire [48] to measure motivation in their study by using monetary incentives as a way to increase student effort and performance. Roderick and Engel [65] used the Reynolds Adolescent Depression Scale [63] to cross check interview data of student descriptions of their motivation. Swerdzewski, Harmes, and Finney [74] conducted a study to examine the interrelationships of self-report data based on the Student Opinion Scale questionnaire (SOS) and computerized testing based on response time measures to identify low motivated examinees in a low-stake assessment context. Swerdzewski et al. [74] found that the two methods (self-report questionnaire and computerized based testing) were consistent in the degree to which they identified examinees with low and high motivation in low stake situations.Using an item-response model in combination with measures of motivation obtained from student self-report questionnaires to conduct low motivation filtering from test data, may help provide better estimates of test item parameters on current large-scale assessments administered via pencil and paper. The motivation parameter to be included in the item response model can be obtained by identifying items from the self-report data that can be grounded on expectancy-value theory and self-efficacy theory of motivation. Expectancy-value theory links achievement performance, persistence, and choice directly to individuals’ expectancy-related and task-value beliefs [1, 13, 15, 55, 56, 58, 78]. Self-efficacy refers to individual’s perceived capabilities for learning or performing actions in relation to a task [2, 3, 42, 62, 66, 68, 77]. For this research study, the 3PL IRT model was used in combination with self-report measures of motivation to filter and examine the effect of low motivation on test item parameter calibrations of the model. The approach to estimate the parameter of the 3PL IRT model as a low motivation filter was similar to a traditional 3PL IRT item response model except that examinees with low motivation were not included in the estimation of the test item parameters. The measures of motivation included two constructs (math-values and interest). Math-values relate to student beliefs, importance and interest to engage in mathematics tasks [6, 20]. Interest relates to the extent to what an individual engages in a learning task based on the interactions of the individual with the activities and context he or she experiences [14, 42, 62, 68, 77]. These components were interpreted by drawing from expectancy- value theory and self-efficacy theory to address the effect of low motivation on the estimates of test item parameters from the large-scale assessment data. This study supports the work conducted by Steedle and Austin, [73]; Swerdzewski, Harmes and, Finney [74]; Wise and DeMars [79]; Wise and Kong [82]; Wolf and Smith [84]; and Wise, Wise, and Bhola [79].
1.1. Context of the Research Study
- EQAO large-scale assessments in the province of Ontario, Canada are administered in Grades 3, 6, 9, and 10 every year [16, 17]. The focus of this research study is the Grade-9 assessment of mathematics. This assessment is administered twice (winter and spring semesters) during the year to students in applied and academic programs [17]. Students in academic programs are those who develop knowledge and skills through the study of theory and abstract problems. They also learn about practical applications where appropriate. Students in applied programs are those who develop knowledge and skills through practical applications and concrete examples [75].EQAO Grade-9 assessments of mathematics administered to students included: a) an exam that was composed of 24 multiple choice questions and 7 open response questions. Both multiple choice and open response questions were related to the four mathematics strands (Number Sense and Algebra, Linear Relations, Analytic Geometry “academic program only”, and Measurement and Geometry); b) a student self-report questionnaire , which was composed of 20 questions that were administered to both applied and academic students separately. This questionnaire gathered information about students’ backgrounds, attitudes toward mathematics, activities outside school, and expectations about their future.EQAO’s Grade 9 large-scale assessments of mathematics do not take into account the effect of motivation on students’ test performance and academic achievement. If students do not value mathematics [11, 12, 64, 68] or if students know that test results do not count, it is possible that they may not place much importance and effort on a successful performance on the test [ 5, 9, 11, 12, 15, 19]. Students may randomly guess or omit questions that may pose a threat to the validity of the interpretation of the data in relation to their test performance and academic achievement [7, 15, 61].
2. Method
- The purpose of this study was to examine the effect of removing examinees with low motivation on test-item parameters estimates when using an item response theory model. The following research questions guided the research study:1. Can some items on the Student Questionnaire (SQ) for EQAO’s Grade-9 Assessment of Mathematics, 2010, be used as a measure of student motivation?2. What is the magnitude of bias and root mean square error (RMSE) in item parameter estimates as a result of student low motivation on a Grade-9 large-scale assessment of mathematics when using multiple choice questions?To answer the research questions, quantitative methods based on item response theory and classical statistics were used. Secondary data from the Ontario’s Education Quality and Accountability Office (EQAO) Grade-9 assessments of mathematics, 2010 spring administration for applied and academic programs were used. The data included self-reported questionnaires and test item response data files for English students in the academic and applied programs.
2.1. Participants
- Data from 43,308 English students in the academic program and 20,475 English students in the applied program were used. These samples resulted from the merge of student self-report questionnaire data with the multiple choice test item response data from the 2010 spring administration of the EQAO test. The data were merged by student record ID using a one to one relational database script via a statistics package for social science (SPSS).
2.2. Instruments
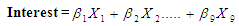
- Self-report questionnaires and multiple-choice mathematics questions for Grade-9 English students in the academic and applied programs were used from the spring 2010 administration of the EQAO test. The self-report questionnaire was composed of 20 questions to provide information about student attitudes toward mathematics. Only student self-report questions related to math-values and interest as stated in Equations 4 and 5 were used to address the first question of the study. The 24 multiple choice questions EQAO exam was also used to assess student math abilities and address the second question of this study. The EQAO exam included questions related to number sense and algebra, linear relations, analytical geometry, and measurement and geometry.
2.3. Procedures
- Questions from the student self-report questionnaires related to student motivation were selected to address the first research question based on research work by Wigfield and Cambria [77], expert opinion, expectancy-value theory and self-efficacy theory. These items are listed in Equations 4 and 5. For example, self-report items such as: “I like math” was identified as intrinsic or interest value because it related to students’ enjoyment from learning mathematics on the emotional side [77, p.4]; “The math I learn now is very useful for everyday life” and “I need to keep taking math for the kind of job I want after school” were identified as utility values because these items reflected the importance of mathematics learning for student future plans [77, p.4]; “I understand most of the mathematics I am taught"; “I am good in math” and “Mathematics is an easy subject” were identified as measures of self-efficacy because these items related to student perceived capabilities for learning mathematics [3]. Finally, items such as: “How much time do you usually spend in math homework?,” “How often have you been absent from your Grade 9 mathematics class this year?” and “How often have you been late for your Grade nine mathematics class this year?” were identified as student interest to engage in mathematics learning [77, p.9] because academic tasks such as doing homework and regular attendance are documented in the literature to reflect student interest based on their engagement and motivation [68, p.324].
2.3.1. Assessing the Component Structure of the Selected Items
- Similar to work done by Wolf, Smith and Birnbaum [83], the component structures of the selected items from the student self-report questionnaire (SQ) were assessed by conducting a principal component analysis (PCA) with varimax rotation [28] for both academic and applied programs separately. Two components (math-values and interest) were identified via the PCA. The components were labelled as math-values and interest based on experts’ opinion and the literature, which states that mathematics values are based on student beliefs, importance and interest to engage in mathematics tasks [6, 20].
 | (4) |
 | (5) |
 are the coefficients for the variables in the math-values component.
 are the coefficients for the variables in the student interest component.
2.3.2. Recoding Item Responses and Treatment of Missing Data
- The EQAO multiple choice math questions responses were assigned a code. A value of 1 was allocated to items with a correct score. A value of 0 was allocated to items with an incorrect score. A value of 9 was assigned to the items with missing values in both academic and applied samples respectively. The missing data were treated as incorrect responses [43]. Both samples (student academic and applied) were analyzed separately.
2.3.3. Model Fit
- Before estimating the parameter coefficients of the model to be used for the study, the 24 multiple choice math questions were used via a software package called BILOG-MG [87] to select the item response model that was a best fit for the data. There are three item response models which are considered appropriate for dichotomous data. These models are the one, two and three parameter logistic IRT models [24]. These three IRT models were compared to determine which one was a better fit to the test items based on the chi-square values obtained from the BILOG-MG software. Similarly to Kozlow [31], it was found that the 3PL IRM with the c-parameter fixed at a value of 0.20 was a better fit for the data (academic and applied programs). The c-parameter coefficient of the model represented the probability of those students with low ability guessing the correct response to a question. A similar approach as Kozlow [31] and Wise and DeMars [81] was used to compute the c-parameter based on 1/ (k+1) ratio, where k represented the number of response options.
2.3.4. Selecting Equal Proportions of Examinees with High and Low Motivation
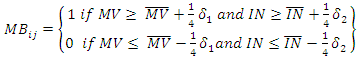
- From the merged data file (student self-report and the 24 math questions), equal proportions of examinees with high and low motivation were selected by using the principal component analysis scores related to math-values and interest, which were obtained from Equations 4 and 5. Each sample of data (academic and applied) was analyzed separately. Since both principal components (math-values and interest) were continuous variables normally distributed with a mean = 0 and SD = 1, it was possible to dichotomize the component scores into examinees with high and low motivation as stated in Equation 6. Examinees with high motivation were defined as having a math-value score > 0.25 and interest score > 0.25 standard deviations above the mean respectively. Both, the math-value and interest conditions had to be met to be able to select an examinee with high motivation. Examinees with low motivation were defined as having a math-value score < -0.25 and interest score < -0.25 below the mean respectively. Both, the math-value and interest conditions had to be met to be able to select an examinee with low motivation. This criterion or rationale was used based on the research of Wise and DeMars [81], which stated that “motivated examinees tend to outperform their less motivated peers by 0.58 standard deviations” (p.19). When both the math-value and interest conditions were satisfied, a sample of 9,123 examinees with high motivation and 9,123 examinees with low motivation were obtained from a total sample of 43,308 examinees from the academic data. Similarly, a sample of 3,912 examinees with high motivation and 3,912 examinees with low motivation were obtained from a total sample of 20,475 examinees from the applied program data.
 | (6) |
 = Motivation Behavior Parameter = Math-Values Component
 = Student Interest Component
 = Mean Math-Values
 = Mean Student Interest
 = Standard Deviation for Math-Values Component
 = Standard Deviation for Student Interest Component
2.3.5. Item Calibration Using Two Models to Determine Parameter Estimates
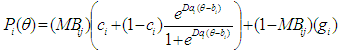
- Via the BILOG-scripts, the data were calibrated twice; once using a traditional 3PL item-response model including examinees with low and high motivation as stated in Equation 1 and once using examinees with high motivation only using an IRT low motivation filter model stated in Equation 7. This model includes a motivation parameter that can be used to filter those examinees with low motivation. The motivation parameter was obtained from Equation 6.
 | (7) |
2.3.6. Scaling
- After the student item response data were calibrated with each item-response model, the two models (Standard and low motivation filter model) data calibration were put on the same scale. According to the literature, there are two possible ways of fixing the scale between two models or groups: (a) scaling the item difficulty values between the two models so that abilities estimates can be compared and (b) scaling the ability values between the two models so that item parameter estimates can be compared [32, 24, 25]. In the current study, the interest was to compare item parameter estimates between the two models. Similar to Wise and DeMars [81], the test item parameters were compared between the two models by scaling the ability values between the two models using the empirical option in BILOG-MG so that the mean ability estimate was set to zero and standard deviation to 1 for each model calibration [24].
2.3.7. Analysis
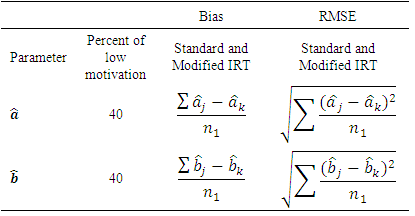
- The scaled data from the model calibrations were analyzed by computing the bias and root mean square error (RMSE) of item parameters estimates, to examine the effect that examinees with low motivation had on the estimates of test item parameters when comparing the two models (standard and low motivation filter model) for applied and academic programs separately. In the current study, bias is defined as the average difference of item parameter estimates between the low motivation 3PL IRT filter model and 3PL standard IRT model. RMSE is defined as the standard deviation of item parameters estimates of the 3PL IRT standard model in reference to estimates of item parameters of the 3PL IRT filter model [80]. Parameter estimates were examined for low, middle, and high ranges between the two models. The bias and RMSE for
 parameters were computed using the equations stated in Table 1.
|
 is the discriminant parameter estimate based on the standard IRM.
 is the discriminant parameter estimate based on the modified IRM.
 is the student difficulty parameter estimate based on the standard IRM.
 is the student difficulty parameter estimate based on the modified IRM.
 is the number of test items.
  is the number of examinees.
3. Results
- The results for each of the research questions are summarized by means of tables. The results include principal component analysis, bias and root mean square error.
3.1. Evidence of Validity for Self-Report data
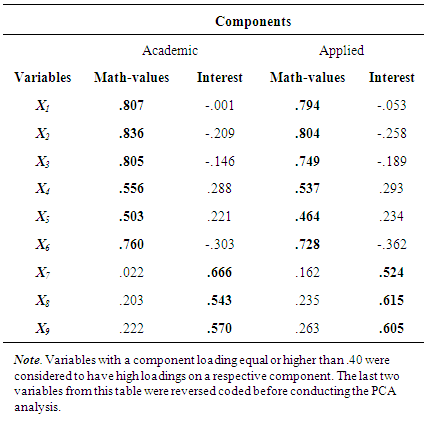
- The results of the principal component analysis as depicted in Table 2 for students in the academic and applied program suggested that the students’ self-reported EQAO questionnaire variables clustered into two components. These two components were interpreted as math-values and interest that related to measures of student motivation as defined by expectancy-value theory and self-efficacy theory using Bandura [3], Boaler [6], Kane [29], Wigfield and Cambria [77], and experts’ opinion who had research expertise on expectancy-value theory and educational measurements. For the academic program as shown in Table 2, the math-values component accounted for 54.60% and the interest component accounted for 22.84% of the total variance. For the applied program as shown in Table 2, the math-values component accounted for 59.50% and the interest component accounted for 27.49% of the total variance. Since varimax rotation was implemented, the two components (math-values and interest) were orthogonal [28]. The outcome of the PCA analysis as depicted in Table 2 in combination with experts’ opinion and the literature provided some content-related evidence of validity for the use of selected items from student self-report questionnaire, as measures of motivation for the academic and applied program data. See Table 2 for more detailed information on the loading of the items for each principal component analysis for academic and applied program data.
|
3.2. Bias and RMSE for Item Parameter Estimates between the Two Models (3PL IRT Standard Model and 3PL IRT Filter Model) for Academic and Applied Programs
- The results in Table 3 contain the computations of the bias and RMSE between the 3PL IRT standard model and 3PL IRT low motivation filter model parameter estimates for the academic and applied program data when using the equations stated in Table 1. The a-parameter also known as the slope indicates how similar or dissimilar the models are in discriminating between low and high ability students. The b-parameter also known as threshold indicates how similar or dissimilar the models are in computing the level of difficulty of each question.
|
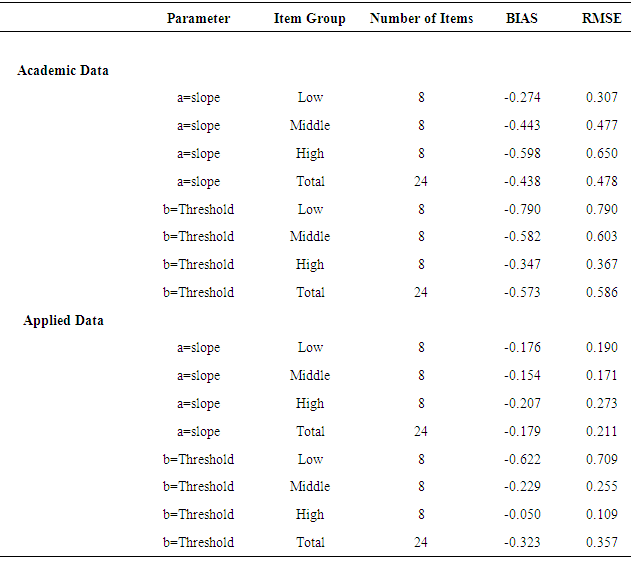
- When interpreting the data, the results in Table 3 revealed that for the academic and applied program, the magnitude of bias and RMSE for the discriminant (slope) and item level difficulty (threshold) parameters were negatively biased toward the 3PL IRT standard model, meaning that the items appeared more difficult and more discriminating under the 3PL IRT standard model when compared to the 3PL IRT low motivation filter model. When comparing the models in terms of low, middle and high discriminant items, the results in Table 3 revealed that the two models were more in agreement for low discriminant items. For high discriminant items, however, the magnitude of bias and RMSE increased and the items appeared more discriminating under the 3PL IRT standard model. When comparing the models in terms of low, middle and high item level difficulty (threshold), the magnitude of bias and RMSE increased between the two models for the easy items, implying that the item level difficulty parameter appeared to be overestimated for easy items by the standard model when compared to the IRT low motivation filter model. There was more agreement, however, between the two models for the more difficult items. Said differently, the discriminant (slope) and item level difficulty (threshold) parameters seemed to be overestimated under the standard model for easy and more discriminating items.
4. Discussion
- The results from the experts’ opinion, the principal component analysis as depicted in Table 2, and the literature provided some content-related evidence of validity that it is possible to measure student motivation using the EQAO student self-report questionnaire data [3, 6, 7, 15, 60, 61, 77]. Content validity relates to the extent to which an expert’s opinion and statistical evidence evaluates the questions used to address a measure [29]. While the literature shows that one of the challenges when using self-report questionnaires is to select a questionnaire that has strong evidence of validity measures [7, 15, 26, 60, 77], the outcome of this study showed some content-related evidence of validity when using math-values and interest components as measures of student motivation from a large-scale assessment. Ideally, a researcher would validate the principal components and motivation behaviour scores by administering the nine self-report items used in this study as measures of motivation in conjunction with an established motivation scale such as the student opinion survey (SOS) [70, 71] immediately after the test administration to provide concurrent-related evidence of validity. Concurrent validity relates to the extent to which a test measure correlates to a measure that has been validated [29]. This approach was not possible with the current study because the analysis was based on secondary data and the existing nine self-report items were not specifically designed as motivation measures. In addition, the self-report items were related to general achievement motivation but not to test-taking motivation. General achievement motivation (i.e., motivation to learn a subject such as mathematics) is based on students’ beliefs about their abilities to learn a subject, the value of school activities and endeavours, and the goals students bring to their classes and homework [77, 78]. Test-taking motivation (i.e., effort given to a test on the part of the student) can be thought of as the degree to which examinees exert effort in the attempt to provide the correct response to the test items [74, 81, 82].There is evidence in the literature, however, to support that test-taking motivation and motivation to learn a subject (as it relates to general achievement motivation) are distinct but related [18, 21, 49, 50, 51, 52]. The results from the principal component analysis, experts’ opinion and the literature grounded on expectancy-value theory and self-efficacy theory, provided enough evidence to use the PCA components (math-values and interest) depicted in Table 2 as a proxy to measure motivation. The results of the analysis of research question 1 supports the research work of Swerdzewski, Harmes, and Finney [74] by dichotomizing motivation components (math-values and interest) into examinees with high and low motivation using student self-report questionnaires from a large-scale assessment.The results of research question 1 also provided an avenue to further examine the impact of low motivation on the estimates of test item parameters, when using an item response theory model in combination with measures of student motivation grounded on general achievement motivation via self-report data [80, 81, 83].
4.1. Bias and RMSE in Parameter Estimates for Academic and Applied Programs
- Although a different method was used to measure student motivation, the results of this study seem to be consistent with the findings of Wise and DeMars [81]. The results as depicted in Table 3 indicated that the item level difficulty and slope parameter estimates were negatively biased when using the filter model as reference and the standard model as focal. The items appeared to be more difficult and more discriminating under the standard model for both applied and academic programs. For the item level difficulty, similar to Wise and DeMars [81], there was more agreement between the two models in terms of threshold parameter estimates for more difficult items and more disagreement for easier items. More disagreement for easier items can be explained by the notion that under the effect of low motivation, examinees, especially those with high ability, may not provide a correct response to the test items [18, 79, 80, 82] and may opt to guess or omit easy items, which causes an overestimate of item difficulty parameters on the test [8, 81, 83, 86]. On the contrary, as the items became more challenging, the magnitude of bias and RMSE between the IRT low motivation filter and standard model seemed to indicate that there was a lower effect when including examinees with low motivation in the model calibration. While the modeling techniques used in this study did not account for a change on examinee level of motivation per item as compared to item response time modeling techniques, one explanation for this outcome may be that examinees found some of these difficult items to be engaging, especially those examinees with low motivation and higher ability who were included in the 3PL IRT standard model calibration and as a result generated more correct responses to these difficult items. As Printrich and Schunk [58] stated students’ engagement increases when they are given tasks that are challenging but that can be accomplished based on student ability level. In the case of the discriminant parameter, similar to Wise and DeMars [81], the items appeared to be more discriminating under the 3PL IRM standard model. One explanation for this, as stated in Wise and DeMars [81], may be that the discriminant parameters from the 3PL IRM standard model were spuriously high due to the presence of examinees with low motivation, which caused the discriminant parameters to be more discriminating in the 3Pl IRM standard model. Overall, the results of the current study indicate that test item parameters estimates for EQAO Grade-9 assessments of mathematics seemed to have been influenced by the effect of student low motivation in both academic and applied programs. Test item parameter estimates seemed to be overestimated when using a standard item response model. As Palomba and Banta [53] stated, this low motivation effect raises a concern of whether data collected from large-scale assessments are valid measures of student achievement. Using a filter item response model minimizes the effect of low motivation as a source of construct-irrelevant variance to more accurately estimate test item parameters [73, 81]. The model can function as a low motivation filter by systematically removing low motivated examinee responses from the test data [73, 74, 79].
4.2. Limitations of the Study
- Some of the limitations of the current study, however, relate to uni-dimensionality, self-report measures of motivation and measures of test-taking motivation. The assumption of uni-dimensionality of the item-response models as it was assumed that examinee’s mathematical performance consisted of a single ability [24, 36]. This notion was tested, however, by using an exploratory factor analysis [22] for English academic item response data and an exploratory factor analysis for English applied item response data. From a cluster of 24 items, one component was identified to account for a large proportion of the variance. This proportion was 76% for the English academic program data and 75% for the English applied program data. Since in both programs (academic and applied), one component accounted for a large proportion of the variance, this outcome indicated that there was one single ability representing examinee mathematics performance [67]. The student motivation components (math-values and interest) on EQAO Grade-9 mathematics exams were based on student self-reported questionnaires, which were not originally designed as a measure of motivation. In addition, the items used to measure motivation related to general achievement motivation and not test-taking motivation. While the degree to what these two types of motivation are related (general achievement or motivation to learn a subject and test-taking motivation) has not been extensively investigated, there is some evidence in the literature to support that although distinct, they are related [18, 21, 49, 50, 51, 52]. Some evidence of validity were collected for the use of the EQAO self-report items as measure of motivation, by referring to research work done by Wigfield and Cambria [77], Bandura [3] and soliciting experts’ opinion.The IRT low motivation filter model used in this study does not measure examinee effort per item and it is different from the effort-moderated model used by Wise and DeMars [81]. The effort-moderated model is able to differentiate between examinees with high or low effort per item based on examinee response time. On the contrary, the IRT low motivation filter used in this study is a motivation filtering method in which those examinees exhibiting high motivation get a score and those examinees exhibiting low motivation do not get a score or the ability estimates for those examinees are unavailable. Said differently, the low motivation filter model does not measure examinee effort-moderated per item, but rather the motivation levels that examinees bring to the test-taking situation. These motivation levels can change, however, due to the interactions of the examinee with the test items (e.g., engaging items or less taxing items).
5. Conclusions
- The purpose of this study was to examine the effect of removing examinees with low motivation on test-item parameters estimates when using an item response theory model. The findings indicate that using a 3PL IRT low motivation filter model may provide more accurate estimates of test item parameters than those obtained with a 3PL standard IRT model. For example, using the 3PL IRT low motivation filter model to calibrate Grade-9 EQAO large-scale assessments of mathematics may reduce bias and provide more valid interpretation of test results when assessing student academic performance. In addition, this approach may provide another avenue for pencil and paper test administration agencies such as EQAO to flag the effect of low motivation on large scale assessment data calibrations to make better decisions in assessing student abilities and performance, test designs, allocation of funding and mathematics curriculum changes in our current educational system. The outcome of this study also supports the research work of Steedle and Austin [73], Swerdzewski’s et al. [74], Wise and DeMars [81] and Wise, Wise, and Bhola [79] and builds on existing literature.
5.1. Future Research
- A simulation study may provide further evidence of the use of the low motivation filter model as an avenue to minimize the effect of low motivation and more accurately estimate test item parameters. Simulated data with different proportions of examinees with low motivation may be generated by using item parameters and proficiency estimates from the current study. The estimates of test item parameters from the simulated study (calibrated with the low motivation filter and standard item response models) may be compared to known values obtained from the low motivation filter model calibrations in the current study.
ACKNOWLEDGEMENTS
- This research was funded by the Social Science and Humanities Research Council (SSHRC) and the data were provided by the Education Quality Accountability Office (EQAO).
Declaration of Conflicting Interests
- The opinions presented in this paper are solely those of the authors and do necessarily reflect the opinions of SSHRC and EQAO.