-
Paper Information
- Next Paper
- Previous Paper
- Paper Submission
-
Journal Information
- About This Journal
- Editorial Board
- Current Issue
- Archive
- Author Guidelines
- Contact Us
International Journal of Applied Psychology
p-ISSN: 2168-5010 e-ISSN: 2168-5029
2013; 3(4): 109-113
doi:10.5923/j.ijap.20130304.03
Life Satisfaction among Professional and Non-Professional Students in India
 Abstract
 Reference
 Full-Text PDF
 Full-text HTML
Mahmoud Shirazi1, Matloob Ahmed Khan2
1Department of Psychology, University of Sistan and Baluchestan, Iran
2Department of Psychiatry, Post Box-9086 Addis Ababa University, Addis Ababa, Ethiopia
Correspondence to: Matloob Ahmed Khan, Department of Psychiatry, Post Box-9086 Addis Ababa University, Addis Ababa, Ethiopia.
| Email: |  |
Copyright © 2012 Scientific & Academic Publishing. All Rights Reserved.
The objective of the present study was to examine the relationship between life satisfaction and mental health among students. A total of 150 participants were randomly selected from Aligarh Muslim University, Aligarh, India. Life satisfaction was measured by life satisfaction scale. Independent t-test was used for analyzing the data. The independent t-test showed no significant difference at the mean scores of professional students’ life satisfaction with consideration of residence, gender respectively. On the mean scores of nonprofessional students’ life satisfaction significant difference found with consideration of residence and gender.
Keywords: Life Satisfaction, Professional Student, Nonprofessional Student, Residence, Gender, and India
Cite this paper: Mahmoud Shirazi, Matloob Ahmed Khan, Life Satisfaction among Professional and Non-Professional Students in India, International Journal of Applied Psychology, Vol. 3 No. 4, 2013, pp. 109-113. doi: 10.5923/j.ijap.20130304.03.
Article Outline
1. Introduction
- In recent years, the positive psychology movement has called for as much focus on strength, virtue and thriving as on disease, disorder and distress[1]. Researchers are increasingly recognizing the contribution of subjective well-being (SWB) – or happiness – to an individual’s mental and physical health. Traditional conceptualizations of mental health, which focus only on the absence of disease or symptoms, do not provide a comprehensive account of the quality of a person’s life[2,3]. Positive indicators such as life satisfaction should be included in any assessment to measure overall psychological well-being[4,5]. Subjective well-being as a multidimensional construct includes such cognitive and affective components as satisfaction with life, the frequent experience of positive emotions and the infrequent experience of negative emotions[2]. Life satisfaction (LS), the cognitive component of SWB, is an individual’s subjective appraisal of the quality of his or her life as a whole[2].
2. Literature Review
- Life satisfaction is often considered a desirable goal, in and of itself, stemming from the Aristotelian ethical model, eudaimonism, (from eudaimonia, the Greek word for happiness) where correct actions lead to individual well - being, with happiness representing the supreme good[6]. Moreover, life satisfaction is related to better physical[7] and mental health[8], longevity, and other outcomes that are considered positive in nature. Men and women are similar in their overall levels of life satisfaction[9] although women do report more positive and negative affect. Married people are more satisfied with their lives and those with life-long marriages appear to be the most satisfied[10]. Life satisfaction tends to be stable over time[11] suggesting a dispositional[12], and perhaps, even a genetic component [13]. Life satisfaction set-point (a relatively stable level that an individual will return to after facing varying life circumstances) reporting that there are longitudinal changes in satisfaction levels for about one-quarter of their respondents[14].LS is related to other psychological constructs such as self-esteem but still distinct. Different correlates are found for LS and self-esteem[15]. For example, academic competence is a strong predictor of self-esteem, whereas satisfaction with one’s family is more robustly associated with global LS[16]. Gender differences are often found for self-esteem (males are typically higher) but usually not for LS.Life satisfaction is an overall assessment of feelings and attitudes about one’s life at a particular point in time ranging from negative to positive. It is one of three major indicators of well-being: life satisfaction, positive affect, and negative affect[17]. Although satisfaction with current lifecircumstances is often assessed in research studies,[9] also include the following under life satisfaction: desire to change one’s life; satisfaction with past; satisfaction with future; and significant other’s views of one’s life. Related terms in the literature include happiness (sometimes usedinterchangeably with life satisfaction), quality of life, and (subjective or psychological) well-being (a broader term than life satisfaction). The research on life satisfaction and cognate concepts is extensive and theoretical debates over the nature and stability of life satisfaction continue. Life satisfaction is frequently included as an outcome or consequence variable in work-family research[18].Much of the work-family literature, however, has emphasized a conflict perspective[19], although this is changing,[20] noting the potential for role incompatibility and strain relating to negative outcomes. Life satisfaction is used to assess the impact of conflict levels on overall feelings about one’s life. Importantly, life satisfaction exhibits the strongest relationship with work-family conflict of all non-work variables studied[18]. Research has shown that, beyond direct relationships between work-family conflict and life satisfaction, how people deal with such conflicts is also important. Successful coping with work-family conflict is also associated with higher levels of life satisfaction[21]. According to this view, even if conflict is a likely consequence of engaging in work and family roles, how people deal with such conflict is a determinant of life satisfaction possibly because of self-efficacy perceptions generated by successful coping behavior. Despite extensive research with adults, there have been only a limited number of studies of LS in children and youth. Possible reasons for this neglect include a lack of well-validated, age-appropriate measures of children’s SWB[22]. It has been assumed that young children have difficulty in evaluating their global LS because they are unable to integrate evaluative information from various life domains[23, 24].Although studies of LS among US children and youth are increasingly common, investigations of the LS among children from Asian cultures remain scarce. Thegeneralizability of findings concerning the correlates, consequences and development of psychological well-being among Western youth should not be assumed, but rather should be explicitly investigated among children and youth from different cultures. Of special interest would be studies of young people from collectivistic cultures.The specific objective of the present study was to investigate possible differences and similarities in LS of professional and non-professional students of India. LS of professional and non-professional Indian students were expected to change as they matured. These changes might be in the direction of increasing congruence with the values of a collectivistic culture, but this is an empirical issue which the present research explicitly addressed.However, In the extensive literature on LS of professional and non - professional Indian students little has been written. The importance of this study lies in its potential to add a key component to the past research on LS and in particularly positive psychology. Insight gained from the proposed study will guide future research strategies. Hence,the research questions and hypothesis that this study intends to investigate are:1. Is there significant difference between the mean scores of professional students’ life satisfaction with consideration of residence?H01 There is no significant difference between the mean scores of professional students’ life satisfaction with consideration of residence.2. Is there significant difference between the mean scores of professional students’ life satisfaction with consideration of gender?H02 There is no significant difference between the mean scores of professional students’ life satisfaction with consideration of gender.3. Is there significant difference between the mean scores of non-professional students’ life satisfaction with consideration of residence?H03 There is no significant difference between the mean scores of nonprofessional students’ life satisfaction with consideration of residence.4. Is there significant difference between the mean scores of non-professional students’ life satisfaction with consideration of gender?H04 There is no significant difference between the mean scores of nonprofessional students’ life satisfaction with consideration of gender.
3. Method
3.1. Sample
- In social science research the sample size and its selection technique plays significant role. Sometimes it becomes difficult to specify the sample size because it varies from problem to problem of a proposed research. The researcher has to plan his research works by limiting its domain in his investigation. Sampling is a process of selecting a small part of a population assuming that it should be representing the characteristics of the population of which it is a part.The adequate sample size and the method of selecting sample size from the population enable an investigator to draw meaningful conclusion and helpful in making generalization about the population from which the samples were drawn. In present research, samples of 150 students (professional and non-professional) were drawn using stratified random sampling from different faculties of Aligarh Muslim University, Aligarh. The sample comprised of equal number of75 professional and 75 nonprofessional students.
3.2. Tools
3.2.1. Personal Data Sheet (PDS)
- The PDS includes the information under the following major headings: Age, gender, course and residence.
3.2.2. Life Satisfaction Scale (LSS)
- A 10 items scale used to measure the satisfaction with salient features of daily life and activities of the respondents, psychometric properties of the scale (test, retest reliability, split-half reliability, internal consistency, reliability and validity), were reported by author and others. Responses were rated on seven points scale from 1, referring to “I am extremely dissatisfied”, to 7, referring to “I am extremely satisfied”. The possible range of scores could vary from 10-70. A high score indicated high satisfaction and vice-versa. Test-retest of this scale is also very high i.e. r= 0.87[25].
3.3. Procedure
- Permission to conduct the research was received from the relevant faculty authority and participating students. The data were collected by the researchers in class groups. Two questionnaires namely Life Satisfaction Scale and Personal Data Sheet (PDS) were administered on students. Each respondent took almost 15-20 minutes in answering all the questionnaires. They were assured that their responses would be kept strictly confidential and would be used exclusively for research purpose. After the data collection scoring was done by the investigators.
4. Results
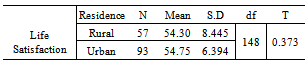
- As stated earlier, the main objective of this investigation was to study life satisfaction among professional and non-professional students. For the purpose, independent samples t-test were used. All the analysis has been done by SPSS. In this study the percentage of males-females was equal (75 or 50% respondents).Research questions and Hypothesis Testing1. Is there significant difference between the mean scores of professional students’ life satisfaction with consideration of residence?H01 There is no significant difference between the mean scores of professional students’ life satisfaction with consideration of residence.For responding of this question independent t-test should be run. The result is as follows:
|
|
|
|
5. Discussion
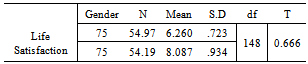
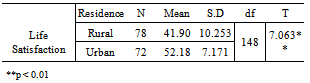
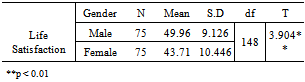
- The results of this study show important similarities and differences in life satisfaction of professional and nonprofessional students in terms of residence and gender. These findings may be interpreted in terms of value differences in individualistic versus collectivistic cultures, using the value as moderator of SWB model proposed[26]. The results of the study will be discussed in the light of the research questions as listed below:Based on research question 1 that, is there significant difference between the mean scores of professional students’ life satisfaction with consideration of residence result shows that because of (p=.710>0.01), there is no significant difference between two groups on life satisfaction. But result shows that urban students have higher mean scores (M=54.75) of life satisfaction in comparison to rural students’ mean scores i.e. (M=54.30). Thus null hypothesis (H01) is accepted.Based on research question 2 that, is there significant difference between the mean scores of professional students’ life satisfaction with consideration of gender results shows that because of (p=.506>0.01), there is no significant difference between two groups on life satisfaction. But result shows that male students have higher mean scores (M=54.97) of life satisfaction in comparison to female students’ mean scores i.e. (M=54.19).Thus the null hypothesis (H02) is accepted.Based on research question 3 that, is there significant difference between the mean scores of non-professional students’ life satisfaction with consideration of residence results shows that because of (p=.000<.01), there is significant difference between two groups on life satisfaction. Result shows that urban students have higher mean scores (M=52.18) of life satisfaction in comparison to rural students’ mean scores i.e. (M=41.90). Thus null hypothesis (H03) is rejected.Based on research question 4 that, is there significant difference between the mean scores of non-professional students’ life satisfaction with consideration of gender because of (p=.000<.01), there is significant difference between two groups on life satisfaction. Result shows that male students have higher mean scores (M=49.96) of life satisfaction in comparison to female students’ mean scores i.e. (M=43.71).This study shows that the urban students’ life satisfaction is higher than that of rural students. Urban students have stronger abilities than rural students in social communication as well as adaptive capability to environment because of the differences in economy and culture between urban and rural areas. In spite of the rapid development in its economy and culture in the recent years, India’s rural areas still lag behind the urban areas. Therefore, compared to urban students, who have stayed in a cultural environment quite similar to that of universities, rural students are faced with a totally contrastive environment when they come to university; hence, suffering from greater pressure in self-coordination and adaptation.With feminism on boom in this era though females are on fore front with their male counter parts, but here in India the load of domestic work is still binded with females be it cooking food or taking care of house hold etc. therefore female students may experience negative consequences from assuming more roles and increasing life demands.[28] have suggested that female students may experience negative consequences from assuming more roles and increasing life demands. They proposed a scarcity hypothesis that postulates adverse effect from increasing demands particularly for females who desire a more achievement oriented life style. Invariably, the adoption of more achievement oriented life style in females’ leads to an expansion of the number and types of role demands and energy resulting in a more stressful life.[29], however, found that reports of low life satisfaction were typical of females who had assured more traditional roles rather than more life active roles. This finding is supported by the findings of[30], he observed significant difference between males and females regarding life satisfaction and[27] found that Males have higher life satisfaction scores than females. Thus the null hypothesis (H04) is rejected.
6. Conclusions
- While Indian culture emphasize conformity, filial piety, moderation and harmony with group members, the apparently increasing need for students to be satisfied with the ‘self’ creates potential conflicts with cultural conventions. In India, societal and familial pressure on academic achievement reaches its apex during college and university level. At the same time, the contribution of college satisfaction to global well-being decreases. Such a contradiction between students’ psychological needs and cultural expectations may contribute to stress among university students and show itself as depression or even suicide. In order to balance individual and cultural emphases, Indian educators and mental health professionals who work with Indian students might consider designing the educational curriculum and various university activities to take into account the developing need for satisfaction with the self and individuation.Although the current study provides a better understanding of the LS among Indian students, it has limitations that should be acknowledged. First, the population from which the research sample was drawn consisted of students from only one university. The results from this study, therefore, provide only a template on which to base further research and cannot be applied to the general populations of either students or faculty.The readers must remember that the makeup of the population of university students changes every year due to graduation, attrition and admission. In order for the recommendations based on the study to remain valid, the perceptions of this population must be re-evaluated after every few years to ensure that any changes within the population are reflected in appropriate changes in the interventions that are offered. If patterns within certain populations can be discovered through this continued evaluation, however, then it may be appropriate to establish general perceptions to provide a preliminary structure on which to frame future interventions.