
-
Paper Information
- Paper Submission
-
Journal Information
- About This Journal
- Editorial Board
- Current Issue
- Archive
- Author Guidelines
- Contact Us
International Journal of Agriculture and Forestry
p-ISSN: 2165-882X e-ISSN: 2165-8846
2026; 15(1): 7-14
doi:10.5923/j.ijaf.20261501.02
Received: Jul. 6, 2026; Accepted: Aug. 8, 2026; Published: Aug. 31, 2026

Socio-economic Determinants of Climate-smart Rainwater Harvesting Technologies in Mbui Nzau Landscape, Kibwezi West Sub-County, Makueni County
 Abstract
 Reference
 Full-Text PDF
 Full-text HTML
Mcbride Dan Psomken1, Charles Ndung’u Kimani2, Festus Mutiso2
1MSc Student, Department of Environmental Science and Land Resource Management, South Eastern Kenya University, Kenya
2Lecturer, Department of Environmental Science and Land Resource Management, South Eastern Kenya University, Kenya
Correspondence to: Mcbride Dan Psomken, MSc Student, Department of Environmental Science and Land Resource Management, South Eastern Kenya University, Kenya.
| Email: |  |
Copyright © 2026 The Author(s). Published by Scientific & Academic Publishing.
This work is licensed under the Creative Commons Attribution International License (CC BY).
http://creativecommons.org/licenses/by/4.0/

Climate variability and water scarcity driven by irregular temporal and spatial rainfall patterns have increasingly threatened biodiversity and ecological stability, particularly in drought-prone areas. Climate-smart Rainwater Harvesting Technologies (RWHT) offer sustainable solutions by enabling the efficient collection, storage, and utilization of rainwater. A mixed-methods approach integrating explanatory sequential and cross-sectional designs was applied to 104 households selected via stratified and systematic sampling (Yamane,ε=9.65%). Inferential analysis using chi-square tests indicated significant associations between adoption and socioeconomic variables (p<0.05), excluding gender. Binary logistic regression identified significant positive predictors of adoption, while gender was not statistically significant (β=0.05; p>0.41). One-way ANOVA revealed statistically significant differences in farm size across adoption duration of climate-smart RWHT in Mbui Nzau landscape.
Keywords: Rainwater harvesting, Climate-smart, Water scarcity
Cite this paper: Mcbride Dan Psomken, Charles Ndung’u Kimani, Festus Mutiso, Socio-economic Determinants of Climate-smart Rainwater Harvesting Technologies in Mbui Nzau Landscape, Kibwezi West Sub-County, Makueni County, International Journal of Agriculture and Forestry, Vol. 15 No. 1, 2026, pp. 7-14. doi: 10.5923/j.ijaf.20261501.02.
Article Outline
1. Introduction
- Water scarcity is a pressing global challenge, especially in regions prone to drought [1]. According to the Intergovernmental Panel on Climate Change report (IPCC) [2], the climate we take for granted on a global scale is evolving and causing significant negative externalities at the local level, unpredictable precipitation patterns, increased Atmospheric Evaporative Demand (AED), among other serious temporal and spatial environmental disasters [3]. Approximately 40 % of the Earth's land is classified as dry, covering about 52 million square kilometres [4]. The worrying trend is that non-arid lands are gradually attaining aridity thresholds, altering ecosystems, and threatening biodiversity existence [5]. During the Conference of the Parties (COP) 2015, the member states committed to the adoption of climate-smart Rainwater Harvesting Technologies (RWHT) as a strategy for climate adaptation [6], [7].Rainwater harvesting is an ancient technology used in many parts of the world for more than 4500 years ago [8]. Countries such as Iraq, China, Thailand, India, Ethiopia, Pakistan, Egypt, and Israel, among others, practiced conventional rainwater harvesting technologies for domestic and agricultural purposes [9]. Some of these technologies include bamboo-drip irrigation in India [10], lime-lined tanks in Sri Lanka, rock-cut cisterns, rock pit technology, fog-water harvesting technologies in North Africa [11], micro dams, and other hydraulic systems were also used in water conveyance [12]. Ancient Israel built water reservoirs in the Negev desert and carried out flood irrigation systems in Nabatean villages for their vulnerable populations [13]. In Africa, Egypt is known for the use of qanats and ancient cisterns [14]. Modern developed nations have transitioned from indigenous technologies to the use of Artificial Intelligence (AI) and Machine Learning (ML) to improve rainwater catchment efficiency and groundwater recharge. This ensures surplus food production and improved citizen welfare to counter the adverse climate change events [14], [15].Although conventional RWHT has played a role in the rainwater harvesting journey, water scarcity continues to threaten biodiversity in many African countries, leading to overreliance on foreign aid for basic commodities [16]. Research reveals that 96% of smallholder farmers have not yet adopted climate-smart RWHT, indicating low adoption rates across the continent, despite numerous studies linking these technologies to alleviating food insecurity, improving infrastructure, and reducing the poverty index [17]. Just like other developing nations, Kenya faces complex challenges in the provision of basic commodities such as food and water amidst global apprehension of increased water scarcity levels exacerbated by climate change phenomena and the population rise [18]. Approximately 85-89% of Kenyan land is arid or semi-arid, with the per capita annual water availability of 647m3 and projected to reduce to 293m3 by 2050 [19]. According to the National Drought Management Authority of Kenya (NDMAK) [20], there are spatial differences in Kenya's climatic zones, with the Eastern and North Eastern parts receiving very little rainfall in terms of distribution, intensity, and reliability compared to other parts.This study delved into understanding the various socio-economic factors that would influence the adoption of climate-smart RWHT including in situ, ex situ and roof catchment RWHT in Mbui Nzau landscape in Makueni County. The study area experiences adverse effects of climate change, including acute water scarcity. It was selected due to its high potential for adoption of climate-smart RWHT [21]. According to Kanu & Przezborka [22], socio-economic factors remain the most decisive drivers of climate-smart technologies. More recent studies have demonstrated that education level, income, farm size, and access to information directly influenced adoption [23]. The results of this study provided a structured solution on the Sustainable Development Goals (SDGs), specifically the provision of clean water and the eradication of hunger [24].
2. Methodology
2.1. Description of the Study Area
- This research was conducted in the Mbui Nzau landscape (Mbui Nzau, Mikuyuni, and Kalungu sub locations), found in the southeastern part of Kenya in Makueni County, Kibwezi West Sub County in the Kikumbulyu South ward. It is along the Nairobi-Mombasa highway (A109), the geographical coordinates of the area are latitude 2° 20' 26" S and longitude 37° 53' 39" E. The area is inhabited by the Kamba community [25]. Figure 1 below shows the map of the study area.
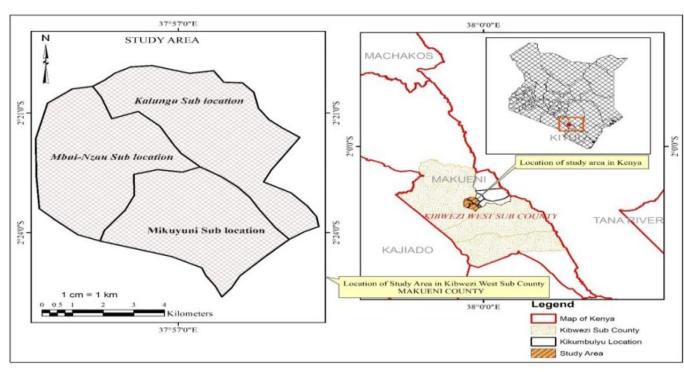 | Figure 1. Map of the study area |
2.2. Research Design
- The explanatory sequential research design guided the whole process of data collection, analysis, and interpretation of quantitative and qualitative data [26]. Quantitative data was essential in emphasizing systematic measurement, statistical evaluation, and objective interpretation of numerical data using computational techniques [27] while qualitative data was used to provide in depth understanding of the study and attainment of the objective. The latter design was achieved using open-ended questions integrated in the questionnaire [28]. This research also employed cross sectional research design that focused on collecting primary data once from the selected household heads.
2.3. Sampling Method
- Transect walks were done in the study area alongside household surveys and mapping to help identify the climate-smart RWHT (In situ, ex situ and roof catchment RWHT) adopted in Mbui Nzau landscape. Structured questionnaire was administered through face-to-face interviews to systematically selected household heads who met the criteria including permanent residence, active engagement in farming and should have attained at least 18 years [29]. A sampling interval of approximately the 30th household was adopted as an operational approximation of the sampling fraction derived from the target population (N=3,280) and the required sample size (n=104), thereby ensuring proportional and spatial representation in the study area without selection bias [30]. Furthermore, the adoption threshold of climate-smart RWHT was at least two technologies. The household constituted the decision unit while the timing of adoption was determined by the period in years of using RWHT. In addition, adoption intensity was assessed by the number of technologies implemented per household. Finally, farm size was measured in acres and categorized into classes, whereas household income comprised of self-reported gross monthly income earning (KES) from farm and non-farm sources. This made it possible to assess adoption behavior and its association with socio-economic variables [27].
2.3.1. Sample Size and Sampling Procedure
- This study involved a farmer-based analysis of climate-smart RWHT, stakeholder analysis was done to identify the landscape’s dynamics and key actors related either directly or indirectly to adoption [31]. Yamane’s formula of identifying sample size of 104 as shown below [32].
 | (1) |
2.4. Data Collection
- Prior to data collection, ethical approval and requisite administrative permits were obtained from National Commission for Science, Technology and Innovation (NACOSTI). The participation was entirely voluntary and one retained the right to decline or withdraw at any stage without prejudice. Respondent privacy and confidentiality was also safeguarded. This professionalism in data collection resulted to a high response rate of 92%. Finally, all the data sets were securely stored with limited access to corresponding authors [29].
2.5. Data Analysis
- The quantitative data were coded and keyed into a computer for analysis using the Statistical Package for Social Sciences (SPSS) software 2023 version, while qualitative data were analysed Thematically. The quantitative data were further analysed by descriptive statistical tools such as means, frequencies, standard deviation, maximum, and minimum values. Econometric analysis using a logit model was employed to examine socio-economic factors influencing the adoption of climate-smart RWHT [34] as shown in the logistic regression below. Probit and logit models may be used to determine the factors that may influence climate-smart RWHT [35]. This was because smallholder farmers in Mbui Nzau landscape were at liberty to either adopt or fail to adopt the technology. A binary choice provided either “yes” or “no” answers from the questionnaire (dichotomous variable). Let the probability (P) that a household adopts climate-smart RWHT be: P1 =εđ /1+εđ. Where d is the hypothetical variable (not directly observed), this required a binary outcome, if a value of 1 if the farmer adopts and 0 if the farmer fails to adopt climate-smart RWHT. This therefore means; The above logistic regression function converts the value “đ” into a probability between 0 and 1. When d is large and positive (P1≈1), this means there is a high likelihood of adoption of climate-smart RWHT. If d is negative, the farmer is likely to fail to adopt RWHT (P1≈ 0).
 | (2) |
 | (3) |
3. Results
3.1. Association of Socio-Economic Groups on Adoption of Climate-Smart RWHT in Mbui Nzau Landscape
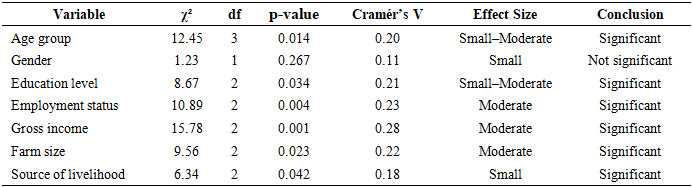
- The results of a chi-square test of independence revealed a statistically significant association for; Age group (X2=12.45, df=3, p<0.014, V=0.2), education level (X2=8.67, df= 2, p<0.034, V=0.21), employment status (X2 =10.89, p<0.004), gross monthly income (X2 =15.78, ,df=2, V= 0.28, p<0.001), farm size (X2 =9.56, p<0.023) and source of livelihood (X2 =6.34, df=2, p<0.042, V=0.22). In contrast, gender (X2 =1.23, df=1, p>0.267, V=0.11) did not exhibit any significant association as shown in Table 1.
|
3.2. Comparison of Income Levels Before and After Adoption of Climate-Smart RWHT
- The results (Table 2) of paired samples t-test indicated statistically significant differences before and after adoption of climate-smart RWHT as reported by the respondents (t=-4.56, df=38, Cohen’s d= 0.73, p<0.001). The mean income after adoption was KES 18,000 (SD=4,500), comparatively higher than before adoption (KES 12,000, SD=3,000). This was dependent on the respondent’s recall of pre-adoption outcome.
|

3.3. Impact of Farm Size on the Duration of Adoption of Climate-Smart RWHT
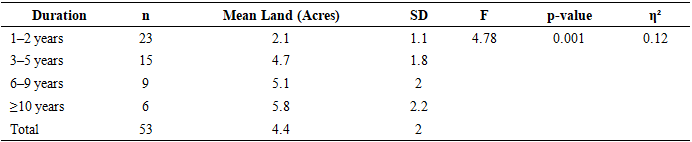
- The results of a one-way ANOVA revealed a statistically significant differences in farm size among four adoption-duration groups (F= 4.78, p<0.001, η²=0.12). There was progressive increase in farm size with duration periods. A post-hoc test was done to identify the specific groups which showed that farmers who had adopted RWHT for 1-2 years had a mean farm size of 2.1 acres, whereas those who had adopted these technologies for more than 10 years had a relatively larger farm size mean of 5.8 acres. The effect size indicated that adoption duration accounted for approximately 12 % of the observed variation in farm size as shown in Table 3.
|
3.4. Socio-Economic Determinants of Adoption of RWHT in Mbui Nzau Landscape
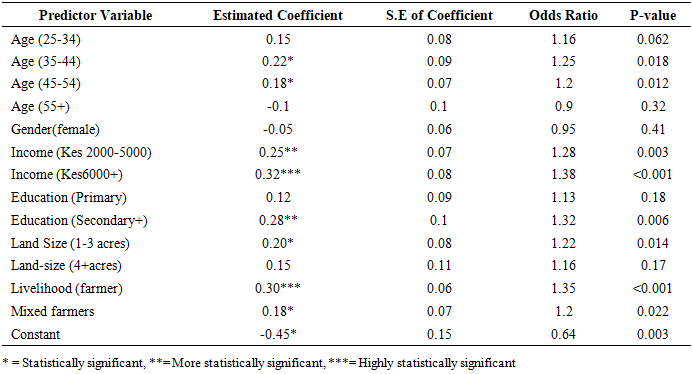
- A logistic regression was run to determine the influence of socio-economic variables on the adoption of climate-smart RWHT in Mbui Nzau landscape. The dependent variable was adoption which had a dichotomous outcome (1=Yes, 0 =No). The results in Table 4 indicate that the adoption among youths (25-34 years) increased by a factor of 1.16, while those between 35-44 years were more likely to adopt by a factor of 1.25. However, the adoption among smallholder farmers between 45 and 54 years increased by a factor of 1.2. A further decline in adoption by a factor of 0.9 was reported among aged farmers (55 years and above).
|
4. Discussion
4.1. Influence of Different Socio-Economic Groups on Adoption of Climate-Smart RWHT in Mbui Nzau Landscape
- A chi-square test of independence was conducted to examine the association between socio-economic and demographic variables on the adoption of climate-smart RWHT. The results revealed a statistically significant association between adoption and key socio-economic variables. Notably, gross monthly income, farm size and employment status were the variables that collectively shaped household’s effective adoption capacity. Higher income levels and larger farm sizes enhanced financial liquidity and economies of scale, thereby increasing the ability to absorb both the fixed and recurrent costs associated with adoption [36]. The employment status further influenced adoption outcomes as formally employed households were more likely to access institutional credit services. The observed strong income-adoption nexus brings the critical role of financial capital in overcoming entry barriers and facilitating sustained adoption [36], [37].Similarly, the statistically significant association between education and age aligned with the human capital and experiential dimension of adoption. Higher educational attainment enhanced respondents’ capacity to acquire, interpret, and apply technical complex information thereby lowering cognitive barriers to adoption [38]. Concurrently, older farmers exhibited greater accumulated farming experience and asset endowment than younger counterparts. Given the inherently cumulative and path-dependent nature of these long-established technologies, age emerged as a critical determinant. Furthermore, the significance of primary source of livelihood refined the interpretation whereby households fully dependent on farming demonstrated stronger adoption compared to diversified livelihood strategies. The Cramer’s V values ranged from 0.18-0.28, indicating that the selected socio-economic factors exhibited small to moderate associations to adoption. In contrast, the association between adoption and gender was not statistically significant. From a statistical standpoint, the distribution of adopters across male and female respondents did not differ significantly. However, this did not imply that gender was irrelevant to the adoption process but could be interlinked as a distal variable. Research by [39] explained the complex social dynamics unpacking the role of gender in the agricultural sector. In the recent past, the Kenyan Constitution 2010 has advocated for gender parity in all spheres of life, including leadership positions [40].
4.2. Comparison of Income Levels Before and After the Adoption of Climate-Smart RWHT
- A paired samples t-test was run to compare the self-reported income levels of small-scale farmers before and after the adoption of climate-smart RWHT. There were statistically significant differences, suggesting a systematic directional shift in the outcome variable. Recent empirical evidence corroborates the findings of this study. [41] Modeled the impact of climate-smart technologies on agricultural performance in Ethiopia and demonstrated that enhanced efficiency in water supply systems resulted in statistically significant increase in wheat yields. Similarly, at the local level in Kaiti (Makueni County), [42] established that adoption of rainwater harvesting and drip irrigation technologies substantially improved crop yields. However, research by Ayim et al. [43] Found divergent information resonates that the agricultural sector is characterized by a multitude of exogenous variables such as climatic conditions and market fluctuations that needed to be considered to determine marginal benefits. Further analysis by [44] found that several factors could also directly influence productivity in returns to the smallholder farmer, mentioning entrepreneurial spirits and soil quality. Arguably, the present study found that the farmers sold surplus agricultural produce to gain more income. Similarly, the observed increase could be conflated with general economic progress and favourable policy changes. To make the findings more defensible, there was a need for more complex, resource-intensive analytical strategies to provide a dynamic rather than static view of result [45].
4.3. Impact of Farm Size on the Duration of Climate-Smart RWHT
- A one-way ANOVA was conducted to examine whether mean farm size differed across categories of adoption duration of climate-smart RWHT in the Mbui Nzau landscape. The results observed provided critical insights into the dynamics of technological diffusion and its interaction with structural farm characteristics. The statistically significant one-way ANOVA indicated that the mean farm size differed across cohorts defined by adoption longevity. This further necessitated time as a constitutive variable in understanding adoption in the landscape, suggesting that the population of adopters was heterogeneous and systematically stratified according to duration of engagement with the innovation [46].The Success-Breeds-Success (SBS) model was a plausible theory where adoption of climate-smart RWHT itself generated economic returns such as water security, yield stability, and crop diversification, that enabled farm expansion over time [47]. This meant that the technology acted as a catalyst for capital accumulation and long-term increment in land holdings [38]. The latter created a positive feedback loop where adoption facilitated exponential and progressive growth. According to [48], a robust and dynamic view of such results required longitudinal data to disentangle any variation in adoption apart from time. The present study is in consonance with this critique because it approaches the subject matter in a two-way interactive perspective to understand both sides of the coin and breaks down trajectories of farm growth and reliance relying on farmer’s pre-adoption memory.
4.4. Socio-Economic Determinants of the Adoption of Climate-Smart RWHT in Mbui Nzau Landscape
- A logistic regression run to examine the extent to which the selected socio-economic characteristics influenced the likelihood of adopting climate-smart RWHT among small-scale farmers in the Mbui Nzau landscape. The findings demonstrated that age exhibited a non-linear relationship with the adoption behaviour. Young farmers, particularly those within the early productive age bracket, exhibited a higher likelihood of adopting climate-smart RWHT. The probability of adoption increased progressively by a factor ranging from 1.16 to 1.25, indicating a strong age-related effect. This pattern suggested that smallholder farmers around the age of 25 combined economic vitality with a more innovative and risk-tolerant mindset, making them more inclined towards the uptake of climate-smart RWHT.However, the probability declined among farmers aged 55 years and above, with the likelihood decreasing by a factor of 0.9. This decline may be attributed to risk aversion, reduced labour capacity, and therefore lowered willingness to invest in relatively new technologies. Research by Dadzie et al. [49] in Ghana found similar findings where age was positively associated with risk aversion and negatively associated with the intensity of adoption of improved cassava technologies. Similar findings were found by [47] in Southern Ethiopia, pointing to a peak adoption age before diminishing returns from experience.Gender of the respondents was found to be insignificant in the present study. These results were in consonance with findings from [50] on the adoption of new agricultural technologies, where gender was found to be insignificant in influencing adoption decisions, implying that both male and female farmers had comparable livelihoods in adopting. This suggested that these technologies were gender-neutral in accessibility and application.The income levels emerged as strong positive determinants of adoption. Farmers within the higher income bracket demonstrated significantly greater adoption likelihood. This indicated that financial capability enhanced the adoption of climate-smart RWHT simply because adoption required capital to start and maintain. Increased income levels reduce liquidity constraints [51]. These results converge with the economic adoption, which posits that farmers with high resources would easily embrace change considering the manageability of risks and uncertainties. A small-scale farmer with stronger financial muscles would comfortably invest in the technologies that provide an assurance of returns in the agricultural space. Farmers with secondary education exhibited a higher adoption probability compared to those with primary education and below. This meant that education levels enhanced farmers’ ability to access, interpret, and utilize the technical information concerning adoption. Research by [52] justifies the latter, where education was found to be a key driver of agricultural innovation, and it also provided awareness and managerial competencies. Consequently, according to [53], the education level of the household head increased adoption of hybrid crop varieties, use of manure, and use of pesticides. The high awareness levels and low adoption could be attributed to the low levels of education. Perhaps the small-scale farmers were not able to comprehend the deeper insights of these technologies, thereby affecting adoption negatively. On the other hand, the low cognitive capabilities could have increased the risks and uncertainties associated with adoption because of limited understanding.Land size shaped the adoption behaviour, increase in land size increased adoption rates likely because it is primary factor of production in agricultural production [54]. However, ownership above four acres was insignificant, they were observed to engage in an extensive farming system. This study is in concordance with previous empirical studies because the majority of adopters had between 1 and 3 acres of land. This outcome was also unexpected, as farmers with the capacity to operate on a larger scale were partially reluctant to adopt the technology. Further inquiry into this sceptical disposition revealed that a substantial proportion of these large-scale owners had acquired their land through inheritance. This is in coherence with research work by [55], where inherited land was found to create resistance to technological experimentation, especially if it would threaten long-standing land use patterns. Livelihood strategy emerged as a statistically significant predictor of adoption. Households that engaged in diversified livelihood strategies particularly mixed farming, exhibited a higher probability of adoption. Research by Pretty et al. [56] Found that mixed farming enhanced risk diversification by spreading production and income risks across enterprises and generating complementary interactions between crops and livestock, such as manure recycling and feed residue utilization. This complementation was likely to increase the marginal value of production stability, elevating demand for a reliable water supply, leading to enhanced adoption of climate-smart RWHT. However, the farmer's mindset also played a central role in the prediction of adoption. Holding all relevant socio-economic factors constant, a farmer’s willingness to adopt emerged as a critical determinant, as this study observed substantial variation in adoption behaviour even among households with access to resources [44]. This study also sought farmers’ perceptions on adoption, the respondents consistently associated adoption with financial capability, education levels, livelihood diversification and openness to innovation. Moreover, older farmers cited labour constraints and risk aversion as major hindrance to adoption. This qualitative insights align with the statistically significant predictors in the logistic regression and the chi-square test of independence done in this study.
5. Conclusions
- All examined socio-economic variables-Age, monthly income, farm size, and education levels had statistically significant (<0.05) influence on the adoption of climate-smart RWHT, except gender (>0.267). The findings further indicated that the study population was characterized by relatively low levels of formal education and limited income, conditions that potentially constrained adoption processes. Nonetheless, the adoption of climate-smart RWHT emerged as a promising pathway for improving livelihood. This was corroborated by the presence of statistically significant differences (p<0.001) in mean income before and after adoption, suggesting a positive economic effect associated with adoption.
ACKNOWLEDGEMENTS
- I would wish to thank ALMIGHTY GOD for good health throughout the research period. Sincere appreciation to my lecturers and supervisors Dr. Festus Mutiso and Prof. Charles Ndung’u for the endless guidance during the research process.