International Journal of Agriculture and Forestry

p-ISSN: 2165-882X    e-ISSN: 2165-8846

2024;  14(2): 40-50

doi:10.5923/j.ijaf.20241402.02

Received: Jun. 5, 2024; Accepted: Jul. 26, 2024; Published: Aug. 8, 2024


Agricultural Conversion Based on Cocoa and Rubber Cash Crops in the Former Cocoa-Growing Loop, Abengourou Department (Eastern Côte d'Ivoire)

Innocent Koffi1, Kouakou Guy-Casimir Douffi2, Kouakou Philipps Kouakou1, 3

1Université Alassane Ouattara de Bouaké (Côte d’Ivoire), Département de Géographie, UFR Communication, Milieu et Société

2Université Nangui ABROGOUA, Abidjan (Côte d’Ivoire), UFR Sciences de la Nature, Laboratoire Écologie et Développement Durable

3Centre Suisse de Recherches Scientifiques en Côte d’Ivoire

Correspondence to: Innocent Koffi, Université Alassane Ouattara de Bouaké (Côte d’Ivoire), Département de Géographie, UFR Communication, Milieu et Société.

Email:

Copyright © 2024 The Author(s). Published by Scientific & Academic Publishing.

This work is licensed under the Creative Commons Attribution International License (CC BY).
http://creativecommons.org/licenses/by/4.0/

Abstract

This study aims to determine, through remote sensing, the spatio-temporal dynamics of perennial cocoa and rubber crops in the old cocoa loop of 1960, in Abengourou in Ivory Coast. To do this, land use since 1986, 2000, 2016 and 2024 was mapped. The mutation of perennial crops was analysed through the transition matrix and the annual rate of evolution. In the spring of 1986, cocoa plantations were 43 699 ha (18.05%). In 2016, they were estimated at 62 799 ha (26%), with an increase of 43.71% for an annual growth of 0.95. On this date, rubber trees are estimated at 23 981 ha (9.92%). Meanwhile, forests estimated at 83 608 ha in 1986 increased to 41 509 ha in 2016, a decline of 17.18%. This decrease represents a loss of 42 099 ha of forest areas, equivalent to a regression of 50.35%. This continued downward trend in forests extends over 36 504 ha in 2024. The annual regression is therefore 12.06%. In this dynamic, in 2024, cocoa plantations with an area of 54 643 ha are down by 12.98%. However, this time, the rubber plots which were completed at 23 981 ha in 2016 increased to 31 647 ha in 2024, i.e. a proliferation of 31.97%. This shows that rubber is gaining ground over cocoa. The development of a spatio-temporal modelling of arable land seems necessary for a sustainable agricultural planning and production policy.

Keywords: Agriculture, Conversion, Cocoa, Rubber trees, Remote sensing, GIS, Abengourou, Côte d’Ivoire

Cite this paper: Innocent Koffi, Kouakou Guy-Casimir Douffi, Kouakou Philipps Kouakou, Agricultural Conversion Based on Cocoa and Rubber Cash Crops in the Former Cocoa-Growing Loop, Abengourou Department (Eastern Côte d'Ivoire), International Journal of Agriculture and Forestry, Vol. 14 No. 2, 2024, pp. 40-50. doi: 10.5923/j.ijaf.20241402.02.

1. Introduction

Like other West African countries, Côte d'Ivoire has adopted a development model based on the exploitation of natural resources and agriculture [1-4] Coffee and cocoa, two products considered inseparable because they are grown in the same areas, were the backbone and emblems of the economy during the colonial era [5]. The expansion of cocoa production led to a change in farming practices, resulting in multi-layered agroforestry systems and crops grown under moderate shade or full sun [6-10]. Based on a production model described as forest rent, the plantations created as a result of forest clearing were abandoned as the orchards aged and as a result of stress due to climatic and environmental hazards. Rather than replanting, farmers abandon old plantations and set off to create new ones [4]. The area of forest in Côte d'Ivoire has decreased from 16 million hectares in 1960 to around 2.5 million hectares today [7,11,12]. This has led to a drastic reduction in the area of dense forest and a profound change in the natural environment. Given the decline in forest area, the scarcity of land and the fall in world commodity prices from 1980 onwards, Côte d'Ivoire had the highest rate of deforestation between 1990 and 2015. The Ivorian forest has decreased from 46% to less than 10% of the country's total forest area. In other words, deforestation has eliminated at least 90% of the country's forest cover, and agriculture is primarily responsible [11,12]. This situation has created an ecological imbalance.
Abengourou, in the east of Côte d'Ivoire, has not escaped this reality [13-15]. Since the 1960s, this town, the capital of the Indénié-Djuablin region, has been the scene of intense cocoa farming activity. As a result, it has been subjected to strong anthropogenic pressures, leading to deforestation and degradation of its forest landscape.
As a result, the original forest vegetation now exists only in fragments. In addition, the protected forests of Bossématié and Béki, important links in the conservation of biodiversity in the region, have not escaped clandestine agricultural clearing [6,15].
More than twenty years after the relocation of the cocoa loop, the Abengourou department should certainly be experiencing a reduction in human pressure on the remaining forest fragments. However, from 2000 onwards, there has been a gradual shift from cocoa to rubber cultivation, with the corollary of another profound change in the vegetation landscape. This is the context of this study.
Remote sensing and geographic information systems (GIS) are therefore proving to be effective tools for enlightening decision-makers [15-17]. They constitute an organised set of users, procedures and know-how [18].
The aim of this study is to help assess the spatial dynamics of farms, in particular cocoa and rubber farms, in the Abengourou department from 1986 to 2024 using satellite images, with a view to implementing a planning and sustainable management strategy for its arable land.

2. Materials and Methods

2.1. Study Area

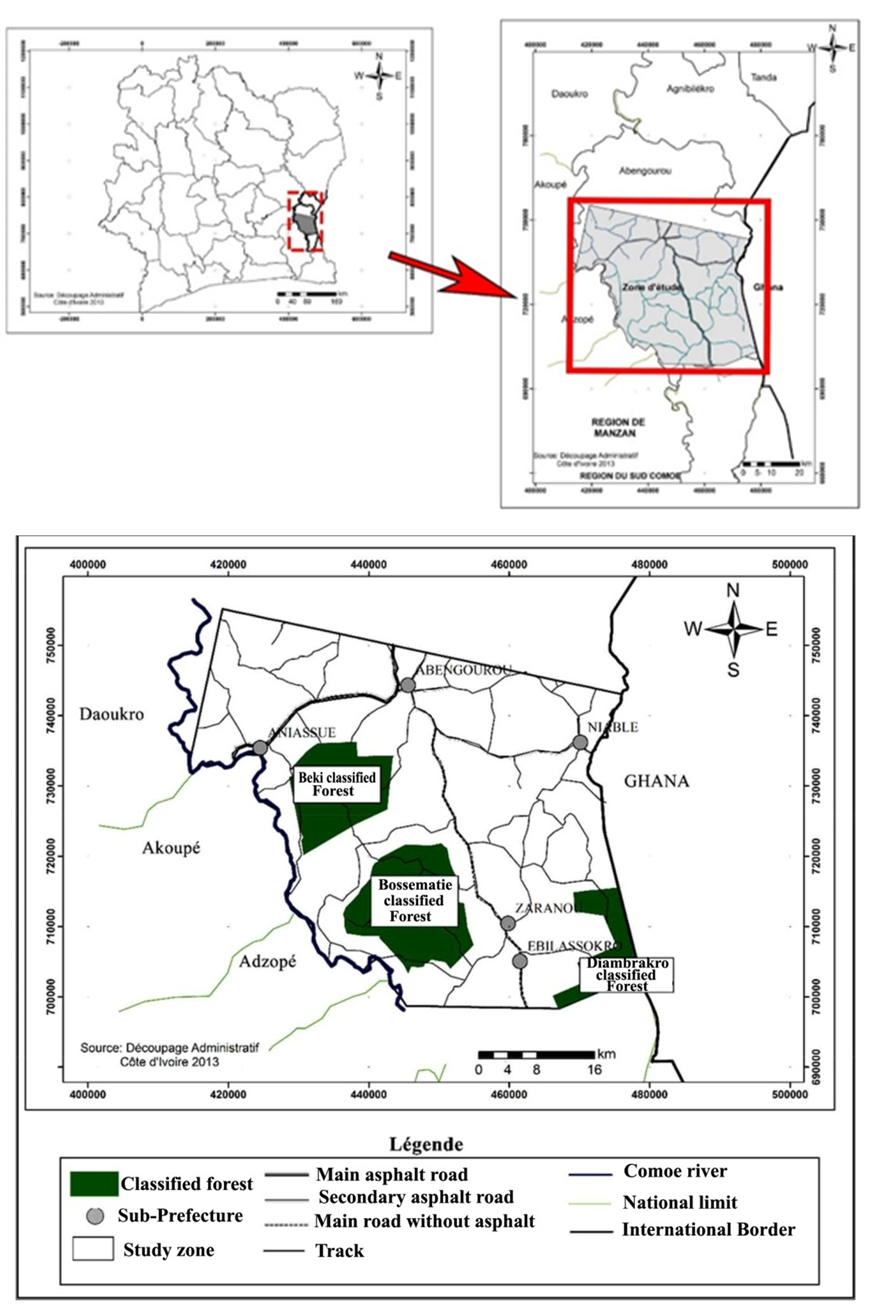
Abengourou, capital of the former cocoa loop, is located in the east of Côte d'Ivoire, 210 km from Abidjan (Figure 1). The study area occupies the centre of the Abengourou department and lies within a quadrilateral bounded by the geographical coordinates 3°10'' to 3°40'' west longitude and 6°20'' to 6°50'' north latitude. It contains the Béki and Bossématié protected forests. The region is made up of a dense semi-deciduous mesophilous forest. It is drained by the Comoé River and its tributaries (Béki, Bossematié, Mazan and Sogan). In a context of climatic variability [19,20], the climate is humid tropical (sub-equatorial), with 2 rainy seasons and 2 dry seasons alternating throughout the year. Annual rainfall is 1,667 m. June has the highest rainfall at 283 mm, while January has the lowest at 50 mm. The population of Abengourou department is 430,539, of whom 53.13% are men and 46.86% women, with a density of 32 inhabitants per km². It has a cosmopolitan population made up of the indigenous Agni ethnic group, allochthonous Ivorians and a foreign population estimated at 43.4% [21].
Figure 1. Location of the study area, Abengourou Department
Coffee and cocoa are the two main perennial crops. However, since the beginning of 2000, rubber has emerged as the most fashionable perennial crop [14]. Agriculture is the main economic resource in Abengourou department. It accounts for 90% of the department's economy. In addition to these export crops, Abengourou's agricultural sector is rich in food crops and market garden produce such as plantain bananas, yams, cassava, taro, maize and tomatoes.

2.2. Materials

2.2.1. Choice of Satellite Images and Metadata
Two datasets were used for this work. These were Landsat satellite images covering scenes 195-55 and 195-056 (Table 1). The four satellite images, previously processed, were downloaded from the Earthexplorer site of the USGS, United State Geological Survey (https://earthexplorer.usgs.gov/) and date from 1986, 2000, 2016 and 2024, with characteristics varying from one image to another.
Table 1. Satellite data acquired (Landsat, scenes 195-055 and 195-056)
     
2.2.2. Software and Field Tools
Software and tools were used to map and analyse agricultural change. These include
- GPS, used to take geographical coordinates during the study.
- ENVI 5.3, used for pre-processing and digital processing of satellite images.
- ArcGis 10, used for mapping and analysing changes in land use/land cover.
- Microsoft Excel, used to produce graphs and histograms.

2.3. Methods

2.3.1. Land Use and Land Cover Mapping
a. Image data pre-processing
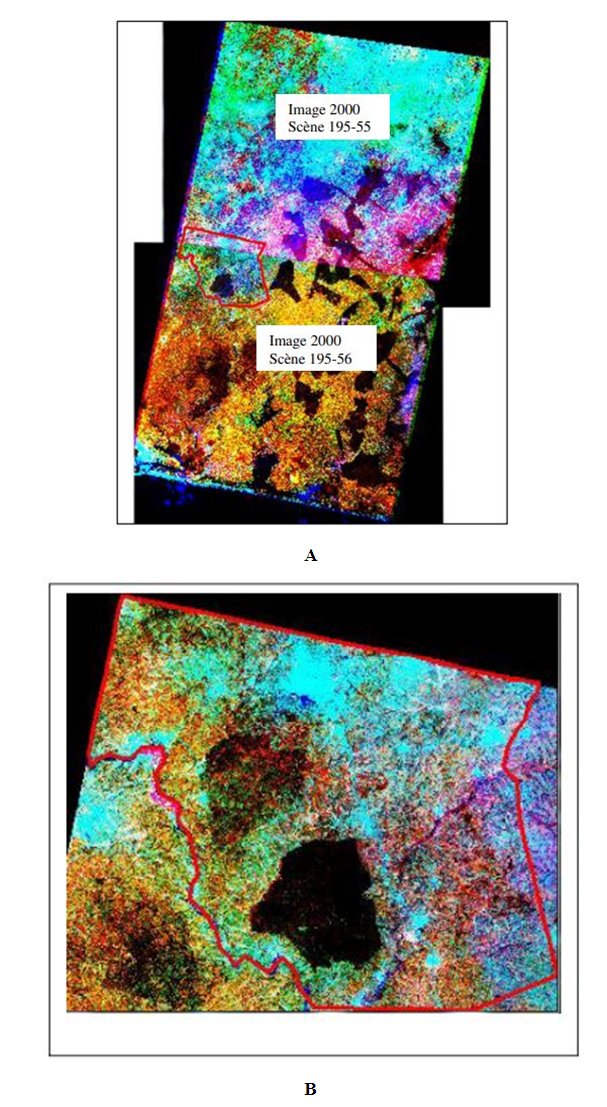
Pre-processing refines spatially inaccurate Landsat data for supervised classification based on satellite imagery [22]. Extraction of the study area also involves digital pre-processing of satellite images in order to make the raw data suitable for thematic analysis, especially for images straddling two scenes (195-55 and 195-56) with Landsat TM 1986, ETM+ 2000 and OLI+ 2016, 2024. A mask was then applied to the mosaicked scenes using ENVI software, in order to extract the study area (Figure 2).
Figure 2. Case study area extracted from Landsat (A: Scenes 195-055 and 195-056 from TM 1986, ETM+ 2000, OLI 9 2024 and B: only scene 195-056 from OLI 2016)
b. Image processing and mapping validation
Image processing consists of extracting information from images for good spectral discrimination and interpretation [23,24]. This was done in ENVI 5.3 software by applying spectral vegetation indices [25] and the colour composition of TM 1986, ETM+ 2000, OLI 2016 and OLI 2024 images. This RGB colour composition, enhanced by histogram equalisation, was applied to the near infrared (PIR), mid infrared (MIR) and red (R) channels. This entire methodology will make it possible to identify the types of land cover from which forest cover, annual crops and perennial crops such as cocoa and rubber will be extracted.
Classification corresponds to the action of extrapolating test areas previously chosen during data collection and whose thematic significance is known, over the entire satellite image [6]. This was done on the coloured composition using the Maximum Likelihood algorithm. On average, 15 training plots and 15 control plots were selected for each class, giving a total of 150 training plots and 150 control plots. The treatments were validated using the confusion matrix, using the 150 control plots. The choice of these validation sites to visit in the field was guided by the reflectance of the land cover, but also by the geographical position, the topography of the environment and, above all, accessibility (proximity to a runway or locality). The plots selected in this way are characterised by their homogeneity and sufficiently large size (9000 m2 to 27000 m2 i.e. 10 to 30 pixels) to be recognised in the field [26]. Once the classification has been validated at the Kappa index threshold of 0.5 [27,28]. A median 3x3 filter is applied to reduce intra-class heterogeneity and eliminate isolated pixels. The 7 land cover classes selected are presented as follows: Forest, Fallow/Crop dominant mosaic, Annual crop/Fallow mosaic, Cocoa, Rubber tree, Bare soil/Locality, Hydrography.
2.3.2. Quantifying Change
The spatio-temporal evolution of each land cover class was assessed using a series of set transformations [29]. The relationship between the same class on two different dates was used to extract the 'stable', 'regressing' and 'progressing' areas of the class.
In order to quantify changes in land cover classes, two statistical indicators were calculated. These are the rates of change in the areas of land cover classes for the years 1986, 2000 and 2016 and the transition matrix for these land cover types.
a. Calculating rates of change
The rates of change (annual rate of change and overall rate of change) in the areas of the land cover classes between 1986 and 2016 were determined respectively using the equation proposed by the FAO [30], which is commonly used to measure the growth of macroeconomic aggregates between two given periods [24,31] (Equation 1)
(1)
Where tg = overall rate of change (%)
S1 is the surface area of a unit area class at date t1;
S2 is the area of the same class of surface unit at date t2.
b. Calculation of annual growth rates
The annual growth rate is calculated using the following formula [30,32] (Equation 2)
(2)
Where r = annual rate of change (%); S1 = area at date t1; S2 = area at date t2; n = 8 years, years between the two dates (2016 - 2024).
c. Land use and cover change using the transition matrix
After the supervised classification, a transition matrix was created to identify the transition frequencies between classes over the time interval studied. It provides a condensed description of the different forms of conversion or spatial mutation of agricultural and forest land, at the level of land use units, between two dates, t1 and t2, and describes the uses to which the land has been put [33]. It is obtained by cross-referencing the 2016 and 2024 land use maps using the "intersect" function of the "ArcGIS" software as described extensively by Koné et al. [11] and Douffi et al. [24]. To achieve the forests (FD) dynamics map from 2016 to 2024, a new field indicating the year was created in the attribute table of these vectors. For 1986, the field is named "year" with a single value for all the lines "2016 ". This field, for 2024, is named "date" with for value "2024". The merging of these two layers of FD (2016 and 2017) is carried out thanks to the function "union" of GIS software "ArcGis 10". By making requests on the attribute table of this merging, following areas are given:
• Areas of the forests for "year" = 2016 and "date" = 0;
• Areas of the forests remained stable: for "year" = 2016 and "date" = 2024;
• Areas of the forests regenerated: for "year"= 0 and "date" = 2024.

3. Results

3.1. Mapping Land Use in 1986, 2000, 2016 and 2024

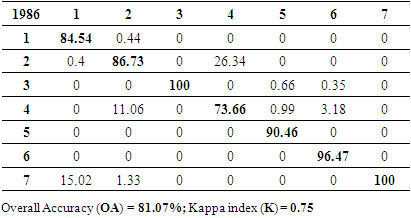
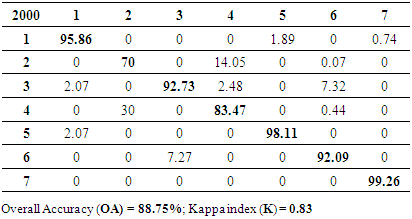
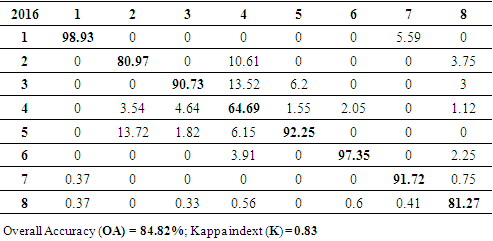
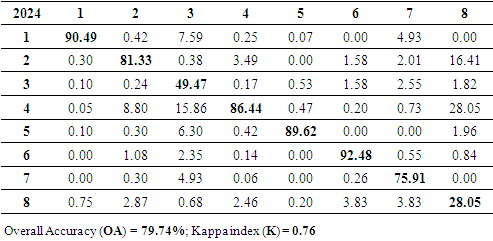
Once the Land use land cover maps for the Abengourou Department had been produced, they were evaluated using confusion matrices (Tables 2, 3, 4 and 5). The overall accuracy (OA) and the Kappa index were obtained for the years 1986, 2000, 2016 and 2024 respectively. They are 81.07% (Kappa = 0.75), 81.07% (Kappa = 0.75), 84.82% (Kappa = 0.83) and 79.74% (Kappa = 0.76). These values show that the maps have been produced successfully. In order to facilitate the analysis of these tables, it was necessary to codify the land cover classes as follows: [1- Forest, 2- Mosaic Dominant fallow/Crop, 3- Lowland/Crop/Fallow, 4- Mosaic Annual crop/Fallow, 5- Cocoa, 6- Bare soil/Locality, 7- Hydrography, 8- Rubber tree].
Table 2. Confusion matrix of 1986 LULC
     
Table 3. Confusion matrix of 2000 LULC
     
Table 4. Confusion matrix of 2016 LULC
     
Table 5. Confusion matrix of 2024 LULC
     
In order to facilitate interpretation of the land cover, the Lowland/Crop/Fallow (3) has been merged with the Mosaic Dominant fallow/Crop (2).
The land cover maps were presented in Figure 3, with overall accuracies of 81.07%, 88.75%, 84.82%, 79.74% and Kappa index of 0.75, 0.83, 0.83 and 0.76 respectively for the years 1986, 2000, 2016 and 2024. The land cover maps were successfully produced for Kappa greater than 0.5.
Figure 3. Land use Land cover maps of the study area for 1986, 2000, 2016 and 2024
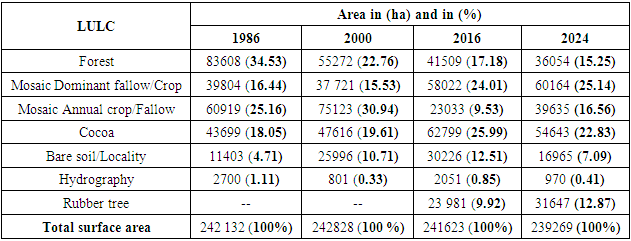
Table 6 shows the land cover in 1986, 2000, 2016 and 2024.
Table 6. Land use and Land cover in 1986, 2000, 2016 and 2024
     
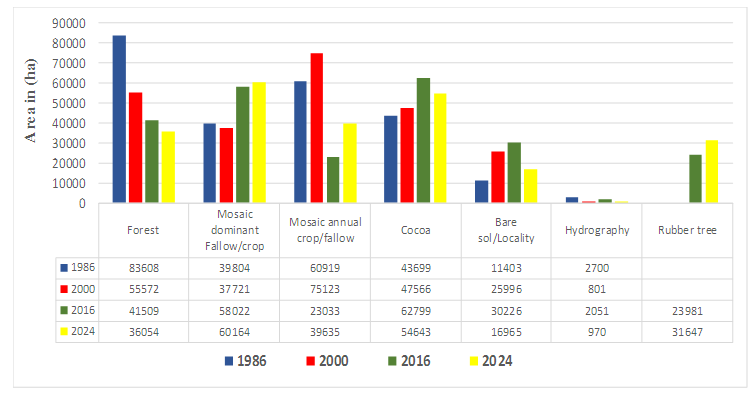
In 1986, forests dominated the landscape of Abengourou Department, covering 83 608 ha (34.53%). This was followed by annual crop/fallow mosaic at 39 804 ha (16.44%) and cocoa at 43 699 ha (18.05%). At that date, rubber crops were absent from the landscape.
In 2000, annual crop/fallow mosaics dominated the landscape, covering 75 123 ha (30.94%), followed by forests covering 55 272 ha (22.76%) and cocoa plantations covering 47 616 ha (19.61%). Rubber plantations are still absent from the landscape.
From 2016, cocoa plantations and annual crop/fallow mosaics began to dominate the landscape, with areas of 62 799 ha (25.99%) and 58 022 ha (24.01%) respectively. Receding woodland covered 41 509 ha (17.18%). At the same time, rubber trees planted in recent years began to emerge, occupying 23 981 ha (almost 10%).
In 2024, the landscape will continue to be dominated by dominant fallow/crop mosaics and cocoa plantations, each accounting for more than 20%, with 60 164 ha (25.14%) and 54 643 ha (22.83%) respectively. The annual crop/fallow mosaic and forest each occupy just over 15%, with 39 635 ha (16.56%) and 36 054 ha (15.25%) respectively. Rubber plantations increased in area to 31 647 ha (12.87%).

3.2. Dynamics of Land Use from 1986 to 2024

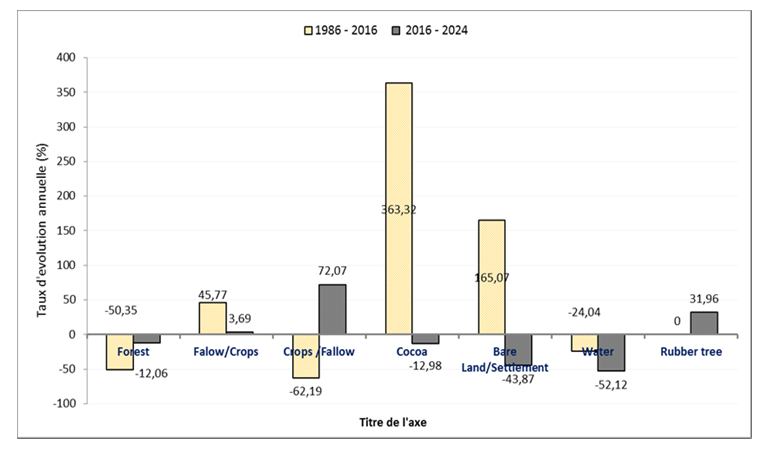
An analysis of the spatio-temporal evolution of land use is illustrated in Figure 4, which shows a progressive trend in the dominant fallow/crop mosaic and in perennial crops, including cocoa and rubber, from 1986 to 2024. In 2016, we see the appearance of rubber cultivation. Then, a regressive trend is illustrated in forestry from 1986 to 2024.
Figure 4. Spatial and temporal dynamics of land use from 1986 to 2024
Figure 5. Evaluation of the annual growth rate between 1985-2016 and 2016-2024

3.3. Changes in Perennial Crops from 2016 to 2024

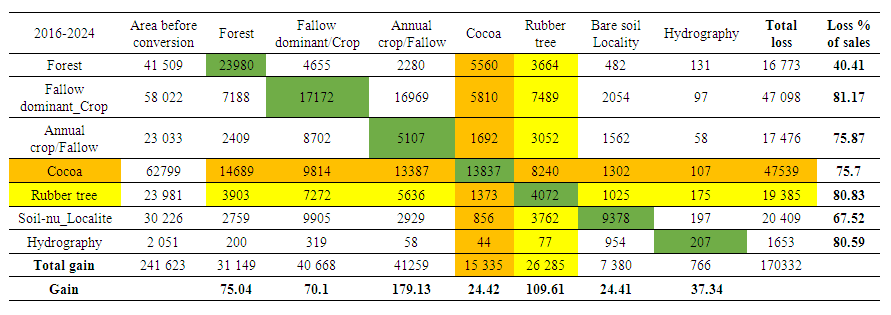
Analysis of the transition matrix (Table 7) shows the various changes in land use over the period 2016-2024. During this period, agricultural areas underwent changes in terms of both land use types and surface areas.
Table 7. Land cover change in 2016 and 2024 [Green: areas remaining stable; Orange: cocoa conversion area; Yellow: Rubber conversion areas]
In 2016, out of a total forest area of 41 509 ha, 16 773 ha were converted to cocoa (5 560 ha), rubber (3 664 ha), 4 655 ha to predominantly fallow/crop and 2 280 ha to predominantly fallow annual crop. In all, 40.41% of forest formations have undergone changes. However, 23 981 ha remained stable in 2024. As a result of these changes, the area of forest formations in 2024 will be 36 504 ha.
In terms of Cocoa plots, out of 62 799 ha in 2016, we note that 13 848 ha remained stable. In addition, 13 387 ha of these cocoa plots were converted to annual crops/fallow and 8 240 ha to rubber. However, 14 689 ha of these cocoa portions were abandoned, and later merged with forest formations, followed by 9815 ha under fallow cultivation. In total, 75.70% of cocoa-growing areas were converted to different types of land use, compared with gains of 24.42%.
In the same vein, the area under rubber has also been transformed. Of the 23 981 ha of rubber plantation, 7 273 ha have not been maintained to such an extent that by 2024, this portion of rubber plantation will merge with the dominant fallow/crop plots and 3 903 ha will resemble forest portions. What's more, 5 636 ha of these rubber plantations will be reconverted to dominant crop/fallow land. However, 4 072 ha, or 16.98%, of the rubber area remained stable. In total, up to 2024, the total area under rubber cultivation, estimated at 31 647 ha, has increased by 26 285 ha, equivalent to a rate of 109.61% and a dynamic of 31.96%.
With regard to the 23 033 ha of fallow annual cropland in 2016, we note that these areas have been used for both rubber plantations (3 052 ha) and cocoa cultivation (1 692 ha) in 2024. However, graphical analysis shows that 8 702 ha of these plots are transformed into dominant fallow/crops and 2 049 ha into forest formation. Nevertheless, 5 107 ha of fallow annual crop area remained stable, i.e. 22.17%. Added to the gains made by the other types of agricultural change, we can see that in 2024, annual crop/fallow plots will be around 41 259 ha, representing a gain of 179.13%. We can therefore say that these plots are likely to guarantee food security in the study area.
In the same vein, the 58,022 ha of predominantly fallow/cropped land in 2016 were converted to different types of land use. They were converted as follows: 7,489 ha of this land was converted to rubber cultivation, 5,810 ha to cocoa, and 16,969 ha to annual crops/fallow. However, it should be noted that 2,409 ha of these dominant fallow/crop areas were abandoned and later merged with a portion of forest. However, 17,172.5 ha of these plots remained stable. In total, 47,098 ha of predominantly fallow land/cropland, or 81.17%, was lost to different land use types. As a result of the changes made, there will be around 40,668 ha of predominantly fallow land/cropland available in 2024, a gain of 70.1%.

4. Discussion

The overall accuracy of Landsat TM, ETM+ and OLI+ images are around 80%. We can confirm that the maps obtained using Maximum Likelihood image classifications are good. The overall accuracy value is an indicator of the classification performance. Values of 80% or more are considered acceptable [15,34].
In addition, the Kappa index, which varies from 0.75 to 0.83 depending on the date and image sensor, determines the similarity between the maps and the reality on the ground point control. Values between 0.61 - 0.80 are in substantial agreement and those of 0.81 - 0.99 are said to be in almost perfect agreement, because they bring the classification into real agreement with the ground point control observations [27]. According to Rwanga & Ndambuki [34], the kappa index is rated as substantial and hence the classified image found to be fit for further research. These accuracy values are very close to those obtained by authors who have worked on the same aspects. For example, Koffi et al. [15] obtained overall classification accuracies of 81.07% and 88.74% respectively when processing Landsat images under the same conditions. The disadvantage of the supervised classification by Maximum Likelihood algorithm used is that it does not always allow Land use land cover to be clearly differentiated, especially small-area classes. This confusion is due to the similar spectral responses of some of these woody land cover [23,35,36]. Confusion could also be linked to the definition of homogeneous plots when choosing training sites [35,36].
The spatio-temporal dynamics of land use in the department of Abengourou, the capital of the former cocoa loop, highlights two evolutionary processes. On the one hand, we observe the regression of forest ecosystems in favour of the dominant fallow/crop, annual crop/fallow areas and portions of rubber plantations from 2016 to 2024. The analysis shows that in 2016, area of forest fell from 41 509 ha to 36 504 ha in 2024, a loss of almost to 12.06%. This decadent state of the forest could mean that Côte d'Ivoire's forests are on the brink of extinction.
The rate of forest loss in our study area is similar to the findings of Koné et al. [13], who estimate that Côte d'Ivoire is one of the highest forest loss countries in the world. Whereas in 1990, around 24.5 per cent of the country was forested, by 2020 only around 8.9 per cent of forest cover remained, corresponding to around 2.8 million hectares of remaining forest [12].
On the other hand, the increase in mosaic fallow/crop, mosaic annual crop/fallow and rubber acreage during this period is due both to the degradation of forest areas and to changes in other types of land use. This situation is out of step with the forest preservation, rehabilitation and extension policy adopted by the Ivorian government between 1996 and 2017. Furthermore, the adoption of rubber cultivation by farmers could be explained by changes in world coffee and cocoa markets [37,38], but also by mimicry and ecological and social change [37,39]. According to the Global Forest Resources Assessment (FRA), this reform led to the creation of 116,202 hectares of reforestation between 1996 and 2017 [38]. The national objective is to restore forest cover to at least 20% of the national territory by 2045 [40]. However, the effects of this policy do not seem to be felt in our study area.

5. Conclusions

This study identified seven (7) land use classes. These are forests, mosaics dominated by fallow/crops, mosaics dominated by annual crops/fallow, cocoa, bare soil/localities, the hydrographic network and, finally, rubber trees. This last class is present in the land cover for the years 2016 and 2024.
At the end of the analysis, the dynamics and changes in agricultural and forestry areas reveal two trends: (1) a continuous decline in the forest ecosystem. From 1986 to 2016, forest regression is estimated at 50.35%, then from 2016 to 2024, the decline is 12.06%. This illustrates the disappearance of forest areas over the years in favour of other types of land use, such as cocoa, rubber trees and areas under annual crops/fallow and fallow/annual crops.
Taking into account the planning and management policy for arable land, and with the implementation of the national forest monitoring system (SNSF) with technical support from the UN-REDD+ Programme, the policy of preserving and monitoring the last remaining forest massifs in the study area (Bossématié and Béki) must be implemented while continuing to raise awareness among local populations. This would help to improve the reconstitution of forest cover by 2030, or even longer in these cultivable areas.

ACKNOWLEDGEMENTS

We would like to thank the United State Geological Survey (USGS) (on the link https://earthexplorer.usgs.gov/), for providing the satellite on data used in this study.

References

[1]  R. Blein, B.G. Soulé, B. Faivre-Dupaigre and B. Yérima Les potentialités agricoles de l’Afrique de l’Ouest. CEDEAO, Farm. (2008).
[2]  R. Balac Stratégies des jeunes dans une économie de plantation de l’Ouest ivoirien, Afrique contemporaine 259 (2016) 41-58. DOI: 10.3917/afco.3259.0041.
[3]  V. Ribier and J.J. Gabas Vers une accentuation des disparités dans le financement de l'agriculture en Afrique de l'Ouest ?, Cahiers Agricultures (2016) https://doi.org/10.1051/cagri/2016045.
[4]  F. Ruf Au cœur des cycles du cacao et des conflits en Afrique de l’Ouest: Le triangle Côte d’Ivoire, Ghana et Burkina Faso, Revue internationale des études du développement 3 (2020) 199-231. https://doi.org/110.3917/ried.3243.0199.
[5]  F. Ruf and J.L. Agkpo Etude sur le revenu et les investisssements des producteurs de café et de cacao en Côte d'Ivoire: rapport final. Mai 2008, (2008) DOI:10.13140/RG.13142.13141.14097.10089.
[6]  J. Oszwald Dynamique des formations agroforestières en Côte d‘Ivoire (des années 1980 aux années 2000), Suivi par télédétection et développement d‘une approche cartographique. Thèse de doctorat, Université des Sciences et Technologies de Lille, France, 304 p, (2005).
[7]  M. Koné Evolution du couvert forestier dense et impact de la déforestation sur la migration de la boucle du cacao en Côte d’Ivoire. Thèse de doctorat, Université Nangui Abrogoua (Abidjan), UFR Sciences de la nature, 166 p, (2015).
[8]  P. Jagoret, F. Ruf, C. Du Castel, J.M. Harmand, S. Rafflegeau, S. Saj, ... and T. Wibaux. L’agroforesterie: des pratiques diversifiées pour la transition agro-écologique de la cacaoculture africaine., La transition agro-écologique 59 (2019).
[9]  L.G. Youan, K.A. Kouadio and G.Y. Jean-Baptiste L’extension de la cacao-culture et la dégradation de l’environnement forestier dans le Département de Duekoué. Espace Géographique et Société Marocaine, (30). (2019).
[10]  N. Kalischek, N. Lang, C. Renier, R.C. Daudt, T. Addoah, W. Thompson, ... and J.D. & Wegner. Cocoa plantations are associated with deforestation in Côte d’Ivoire and Ghana, Nature Food 4 (2023) 384-393. DOI:310.1038/s43016-43023-00751-43018.
[11]  M. Koné, K. Kouadio, Y.L. Kouadio, D.F.R. Neuba, D.F. Malan and L. Coulibaly Évolution de la couverture forestière de la Côte d’Ivoire des années 1960 au début du 21e siècle, International Journal of Innovation and Applied Studies 7 (2014) 782 - 794.
[12]  FAO and SEP-REDD+ Données forestières de base pour la REDD+ en Côte d'Ivoire: Cartographie de la dynamique forestière de 1986 à 2015. SBN: 978-92-5-209999-4, 32p, (2017).
[13]  M. Koné, K. Kouadio, Y.L. Kouadio, D.F.R. Neuba and D.F. Malan Dégradation de la forêt dense humide tropicale, cas de l’Indénié-Djuablin à l’est de la Côte D’ivoire, Journal of Animal & Plant Sciences 21 (2014) 3324 - 3338.
[14]  I. Koffi, H. Dibi N’Da, K.G.C. Douffi, K.F. Kouamé and B.É. Koffi Impact of Cash Crops (Cocoa, Rubber Tree) on the Farmers’ Life Quality in Abengourou Department (East of Côte d’Ivoire), European Journal of Engineering Research and Science 5 (2020) 408 - 414. DOI:410.24018/ejers.22020.24015.24014.21782.
[15]  I. Koffi, N.H. Dibi, K.F. N’Dri, B.E. Koffi and K.F. Kouamé Apport de la Télédétection et des SIG à la caractérisation des mutations de cultures pérennes à base de Cacao et d’Hévéa dans l’ancienne boucle de Cacao : cas du département d’Abengourou (Sud-est de la Côte d’Ivoire), International Journal of Engineering and Science Invention 7 (2018) 01-12.
[16]  E. Dada and M. Hahn Application of satellite remote sensing to observe and analyse temporal changes of cocoa plantation in Ondo State, Nigeria, GeoJournal 87 (2022) 231-246. DOI: 210.1007/s10708-10020-10243-y.
[17]  T.D. Kanmegne, H. Latifi, T. Ullmann, R. Baumhauer, M. Thiel and J. Bayala Modelling the spatial distribution of the classification error of remote sensing data in cocoa agroforestry systems, Agroforestry Systems 97 (2023) 109-119. DOI: 110.1007/s10457-10022-00791-10452.
[18]  H. Pornon La géomatique, pour le meilleur et pour le pire, Géomatique Expert (2014) 100.
[19]  T. Brou Variabilité climatique, déforestation et dynamique agrodémographique en Côte d’Ivoire, Sécheresse 21 (2010) 1-6.
[20]  A.M. Kouassi, J.M. Kouao and K.E. Kouakou Caractérisation intra-annuelle de la variabilité climatique en Côte d’Ivoire, Bulletin de l’association de géographes français. Géographies 99 (2022) 289-306. https://doi.org/210.4000/bagf.9534.
[21]  RGPH Recensement Général de la Population et de l’Habitat (RGPH), 2021. Résultats globaux, 37 p, (2021).
[22]  N.E. Young, R.S. Anderson, S.M. Chignell, A.G. Vorster, R. Lawrence and P.H. Evangelista A survival guide to Landsat preprocessing, Ecology 98 (2017) 920-932. DOI: 910.1002/ecy.1730.
[23]  H. N’Da Dibi, K.E. N’guessan, W.M. Egnankou and K. Affian Apport de la télédétection au suivi de la déforestation dans le parc National de la Marahoué (Côte d’ivoire), Revue Télédétection 8 (2008) 17 - 34.
[24]  K.G.-C. Douffi, M. Koné, K.I. Kouassi, Y.J. N'Guessan and A. Bakayoko Farmers Establishment Impact on the Forest Dynamic of Monogaga Protected Forest, in the Southwest of Côte d'Ivoire: Remote Sensing and Geographical Information Systems (GIS) Approach, European Journal of Engineering Research and Science 4 (2019) 12-20. DOI: 10.24018/ejeng.22019.24014.24015.21230.
[25]  J.W. Rouse, R.H. Haas, D.W. Deering, J.A. Schell and J.C. Harlan Monitoring Vegetation Systems in the Great Plains with ERTS. P. 309-317, in S. C. Freden, E. E Mercanti & M. A. Becker (réd.), Third Earth Resources Technology Satellite Symposium Proceedings, Washington, D.C., 10-14 december 1973, NASA Science and Technology Information Office, Washington D.C., Publication NASA SP-351, vol. 1, (1973).
[26]  C. Chatelain Possibilités d’application de l’imagerie satellitaire à Haute Résolution pour l’étude des transformations de la végétation en Côte d’ivoire Foresterie. Thèse Univ. Geneve, 206 p, (1996).
[27]  A.J. Viera and J.M. Garrett Understanding interobserver agreement: the kappa statistic, Family Medicine 37 (2005) 360 - 363.
[28]  G.M. Foody Explaining the unsuitability of the kappa coefficient in the assessment and comparison of the accuracy of thematic maps obtained by image classification, Remote sensing of environment 239 (2020) 111630.
[29]  C. Noyola-Medrano, C. Mering and M.A. Rojas-Beltrán Evaluation du changement de l’occupation du sol à l’aide des images LANDSAT et SPOT: champ volcanique de la sierra chichinautzin (MEXIQUE). In Actes du 26eme colloque international., (2009).
[30]  FAO Forest resources assessment 1990 - Survey tropical forest cover studies of change processes. FAO Forestry Paper 130, Food and Agriculture Organization of United Nations, Rome, Italie. [en ligne] http://www.fao.org/docrep/007/w0015e/w0015e00.htm (dernière visite : 25 Janv. 2018), (1996).
[31]  J. Oloukoi, V.J. Mama and F.B. Agbo Modélisation de la dynamique de l’occupation des terres dans le département des Collines au Bénin, Télédétection 6 (2006) 304 - 323.
[32]  J.-P. Puyravaud Standardizing the calculation of the annual rate of deforestation, Forest Ecology et Management 177 (2003) 593-596. https://doi.org/510.1016/S0378-1127(1002)00335-00333.
[33]  R. Schlaepfer Analyse de la dynamique du paysage. Fiche d’enseignement 4.2, Laboratoire de Gestion des Ecosystèmes, Ecole Polytechnique de Lausanne, Suisse, (2002).
[34]  S.S. Rwanga and J.M. Ndambuki Accuracy assessment of land use/land cover classification using remote sensing and GIS, International Journal of Geosciences, 8 (2017) 611-622. https://doi.org/610.4236/ijg.2017.84033.
[35]  B. Tankoano, Z. Sanon, M. Hien, N.H. Dibi, J.T. Yameogo and I. Somda Pression anthropique et dynamique végétale dans la Forêt Classée de Tiogo au Burkina Faso: apport de la Télédétection, Tropicultura 34 (2016) 193-207.
[36]  A.A. Siradji, I.M. Maarouh, M. Mahamane, A.G. Ousseini, H.N.A. Latif, D. Soumana, B. Yacoubou and M. Ali Dynamique spatio-temporelle des écosystèmes de la Réserve de Biosphère de Gadabédji dans la zone Nord Sahélienne au centre du Niger, European Scientific Journal 20 (2024) 310-335.
[37]  A. Lipchitz and T. Pouch Les mutations des marchés mondiaux du café et du cacao, Géoéconomie 1 (2008) 101-124. DOI: 110.3917/geoec.3044.0101.
[38]  FAO Évaluation des ressources forestières mondiales (FRA) 2020 Côte d’Ivoire - Rapport, Rome, Italie, 55p, (2020) https://openknowledge.fao.org/handle/20.500.14283/cb10126fr.
[39]  F. Ruf L’adoption de l’hévéa en Côte d’Ivoire. Prix, mimétisme, changement écologique et social, Économie rurale 330 (2012) 103-124. https://doi.org/110.4000/economierurale.3527.
[40]  FAO Stratégie nationale de préservation, de réhabilitation et d'extension des forêts, 52p, (2022) https://faolex.fao.org/docs/pdf/ivc213819.pdf.