E. C. Merem 1, Y. A. Twumasi 2, S. Fageir 3, D. Olagbegi 1, J. Wesley 1, R. Coney 1, Y. Babalola 1, T. Thomas 1, A. Hines 4, G. Hirse 4, G. S. Ochai 5, E. Nwagboso 6, M. Crisler 1, S. Leggett 7, J. Offiah 1, S. Emeakpor 8
1Department of Urban and Regional Planning, Jackson State University, 101 Capitol Center, Jackson, MS, USA
2Department of Urban Forestry and Natural Resources, Southern University, Baton Rouge, LA, USA
3Department of Social Sciences, Alcorn State University, 1000 ASU Dr. Lorman, MS, USA
4Department of Public Policy and Administration, Jackson State University, 101 Capitol Center, Jackson, MS, USA
5African Development Bank, AfDB, 101 BP 1387 Avenue Joseph Anoma, Abidjan, AB 1, Ivory Coast
6Department of Political Science, Jackson State University, 1400 John R. Lynch Street, Jackson, MS, USA
7Department of Behavioral and Environmental Health, Jackson State University, 350 Woodrow Wilson, Jackson, MS, USA
8Department of Environmental Science, Jackson State University, 1400 John R. Lynch Street, Jackson, MS, USA
Correspondence to: E. C. Merem , Department of Urban and Regional Planning, Jackson State University, 101 Capitol Center, Jackson, MS, USA.
| Email: |  |
Copyright © 2024 The Author(s). Published by Scientific & Academic Publishing.
This work is licensed under the Creative Commons Attribution International License (CC BY).
http://creativecommons.org/licenses/by/4.0/

Abstract
In the political economy of the nation of Sudan, cotton ranks significantly high as an essential component of the revenue generation sources. Considering the significance of the crop in the country, cotton has not only been exported to various countries, but some portions of the produce are also used up internally. With that also came, large scale cultivation of the cotton produce on vast swaths of land over the years amidst demands and fluctuations in the marketplace. Given the effects of cotton production on the environment from the use of chemicals and widespread water use, there came changes in the lager agricultural structure that coincided with variations in yield levels, land size and production. Yet, as very little has been done to assess the changing trends in cotton land use in Sudan, no one has bothered to examine the extent and nature of cotton land use and the potentials under a mixscale approach. Accordingly, the paper focusses on cotton land use change, with emphasis on the issues, trends, environmental analysis, impacts, and factors using descriptive statistical techniques connected to Geographic Information Systems (GIS). Through the applications of mixscale model, the study not only showed rising changes in cotton production and yield, but most of the land use indices and the others posted variations as well. While the changes are attributed to a host of socio-economic, ecological, and political elements located within the local farm system, the GIS mappings of the trends point to the gradual dispersion of cotton land use indices spread across different points in space in the study area. There are also widespread impacts in the form of intense water usage, pollution from chemicals, the loss of land and degradation. Along these lines, despite the efforts of the institutions, the paper proffered solutions ranging from education, monitoring to the design of regional and national cotton land use information system.
Keywords:
Cotton, Potentials, Land Use, Sudan, GIS, Change and Factors
Cite this paper: E. C. Merem , Y. A. Twumasi , S. Fageir , D. Olagbegi , J. Wesley , R. Coney , Y. Babalola , T. Thomas , A. Hines , G. Hirse , G. S. Ochai , E. Nwagboso , M. Crisler , S. Leggett , J. Offiah , S. Emeakpor , Analyzing the Capacities of Cotton Production in Sudan, International Journal of Agriculture and Forestry, Vol. 14 No. 1, 2024, pp. 1-17. doi: 10.5923/j.ijaf.20241401.01.
1. Introduction
The ideas of cotton farming and the benefits, in the Sudan [1] go back to the 19th century. This emerged when the crop was cultivated for the initial period in Eastern Sudan (Tokar area). From then on, commercial production commenced in 1905 with the Zeidab Pilot Scheme in Northern Sudan. From this historiographic info and flashback into memory lane, 1925 represents a breakthrough and the turning moment in irrigated farming activity in Sudan, coupled with the design of Sennar dam [2]. While such undertakings at that material time deeply resonates with the venture capital side in the Hydro-politics of the Nile Valley of the past and current eras [3-5]. Ever since then, the primacy of cotton, despite the dependence on water and the politics involved, resonates among global and regional stakeholders in the political economy of the Nile valley [6-10]. As a measure of the prominence of cotton crops, based on various agro-economic indicators, the primacy of the crop has over the ensuing time reached major milestones. This is evident looking at the economic climate over time and judging from what transpired in terms of the size of land under cotton cultivation and the volume of production capacity. This began from the avalanche of surges in the 1960s through the 1980s and the later years. In as much as, the spark in activities catapulted the produce to a higher height as a cash crop. The spillovers from the fiscal footprints of transactions that occurred in the orbit of international capital, lifted the commodity to economic relevance [11-15]. This is currently, shaping policy pronouncements, steps and the recourse to a favorable trajectory driving the revival of cash crops like cotton towards a glorious return to eminence [16]. Against that background, in the political economy of the nation of Sudan, cotton ranks significantly high as an essential component of the revenue generation sources. Considering the significance of the crop in the country, cotton has not only been exported to various countries, but some portions of the produce are also used up internally. With that also came, large scale cultivation of the cotton produce on vast swaths of land over the years amidst demands and fluctuations in the marketplace. Given the effects of cotton production on the environment from the use of chemicals and widespread water use, there came changes in the larger agricultural structure that coincides with variations in yield levels, land size and production, export, and distribution of the spectra of export varieties found in the nation [17-19]. Clearly, cotton, as an essential crop in Sudan, is grown in many agro-ecological zones that supports it. The crop is cultivated in different topographical and ecological settings, using techniques including irrigation, and the spraying of agro chemicals. Specifically, it is cultivated in clay soil in hubs from Gezira to Blue and White Nile and on silt soil in the other regions. Still, it remains clearly a vital farm produce for domestic use, industries, exports, and fiscal welfare. In the last several years, cotton has assumed greater prominence in various stages of Sudan's developmental trajectory [1]. As a result, much of the cotton cultivation in Sudan occur on modest farms as a cash crop meant to sustain monetary needs of families for the purposes of utilization and venture capital. In line with the recurse to innovative activities in modern farming, the introduction of genetically modified (GM) cotton brought some success on farms with many advantages including pesticide cutbacks, bigger yields, and higher gains. In as much as the adoption of biotech rose continually all through 2011, over 90% of Sudan’s overall cultivated cotton land area in 2018 had GMOs. Accordingly, for many in the Sudan, cotton farm activities not only sit at the center of community life, but it is also major tradition for 300,000 planters [1,20-28]. In the process, the rigorous labor requirement of cotton and the sub sector has been instrumental to job creation, alleviation of poverty, better quality of life and the emergence of new localities in the countryside. Notwithstanding this success, leakages in policy and other factors have limited the full actualization of cotton as key catalyst of development among communities in the nation. With Sudan’s profile as big cotton producer in Africa, output rose notably quicker ever since 2016. So, in 2018, the nation generated 236,000 tons of cotton on 184,000 hectares of cultivated land [22]. Additionally, the robust export activities of Sudan among cotton producers are a testament to the capacity and viability of land areas classified as arable and sizable. In that way, as the nation posted growth and variations over time [12], in various key land use indicators. The Sudan sold quantities of the produce, particularly to China, Egypt, and Turkey. For that, while the export of cotton surged by 22,000 TMT in 2014 to 150,000 TMT in 2018. The study area saw widespread use of chemicals, rising prices, threats to the ecosystem, crop diseases [21], and volatility in commodity trade [12]. This issue is compounded further by policy defects and sectorial inadequacies amidst the waning influence of cotton as a key foreign currency earner. For the return of cotton to prominence in the Sudan [23], these issues merit vivid assessment anchored in mix scale methods [7]. Yet as very little has been done to assess the changing trends in cotton land use in Sudan and the larger farm structure, no one has examined the extent of cotton land use change and the potentials under a mixscale approach [1,29-35]. Accordingly, the paper focuses on cotton land use change, with emphasis on the issues, trends, environmental analysis, impacts, and factors using descriptive statistics techniques connected to Geographic Information Systems (GIS) [36-40]. The belief is that in the context of sustainable development models driving the revival of prime cash crops of the past as pillars of future economies. The focus on cotton in Sudan provides a template for other nations to draw from in reviving the viability of major cash crops that once dominated. The study has five purposes. The initial two objectives cover the analysis of current issues in cotton farmland use and to assess the production trends. The third and fourth aim tries to assess the potential of cotton cultivation in the various regions and the recognition of factors, effects, and recent efforts. While the fifth aim is to design a decision support tool for managers. The paper’s five sections cover introduction, methods, results, discussions, and conclusions.
2. Methods and Materials
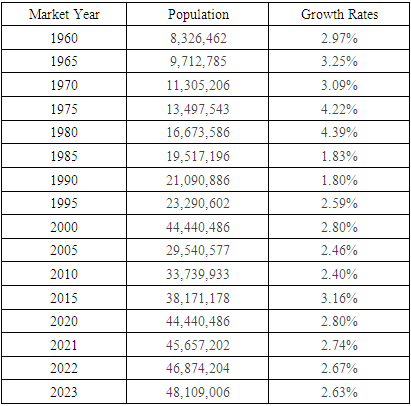
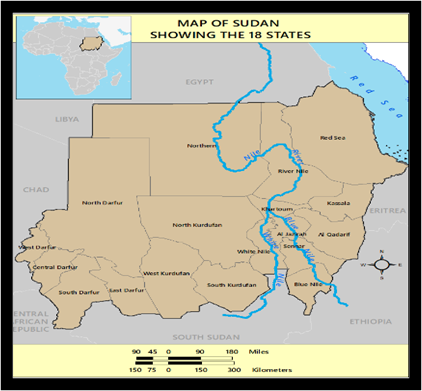
The Sudan (Fig. 1), as Africa’s largest nation stretches through a 2.5 million km2 area on the crossway of Sub-Saharan Africa and the Middle East near to the Red Sea and the horn of Africa. While the nation boasts of about 80 million ha in arable land, of which only about 20% is devoted to farming. In 2023 [23], the Sudan has a population estimate of 48 million citizens (Table 1), at a growth rate of 2.63%, mostly in 14 regions along the central and Eastern axis [1,13,16,23,40,14,15]. Being a nation endowed with biodiversity in an area bordered by Egypt, central and East Africa. The study area labelled often as a cotton hub from the Blue Nile to the Red Sea, has diverse ecological zones with thriving activities at the epicenter of environmental uncertainties (Fig. 1). Said that, cotton as cultivated in the Sudan occurs under different geological and ecological settings, using different techniques of irrigation, and together with recurrent treatments of agro-chemical inputs on various soil types. Just as the common practice of cotton cultivation in clay soil is synonymous with the Gezira, Rahad, New Halfa, Suki, Blue Nile, and the White Nile. Amidst the suitability of silt soil, the Tokar of Eastern Sudan offers the ideal location, while substantial clay soil deposits in the Nuba Mountains area of Western Sudan provides the optimal spot for such an undertaking. Being grouped and set apart by the network of irrigation schemes, the cultivation of cotton occurs also through natural gravity and pumps mounted at Gezira, Rahad, New Halfa (Girba), White Nile, Blue Nile, and Suki schemes coupled with flood flow along the Tokar Delta and Khor Abohabil. In addition to that, are the presence of rain droplets in the Kurdofan, Darfour, Blue Nile, Senar and Gdarif axis. Considering that, of the varieties and hybrids cultivated in the nation of Sudan, the largely prevalent types encompass Barakat and Acala. The cotton production volumes under the two major types of Barakat and Acala represent 46.67%-44.28% individually at combined total of over 90% of the nation’s production between 2001-2010. The remaining lower-level varieties of cotton unique to the study area from Nour to Nuba+ Acrain faded to lower single digits rates of 8.62% -0.42% [16,23]. Table 1. The Population of Sudan 1960-2023
 |
| |
|
 | Figure 1. The Study Area Sudan |
Realizing that the Sudan is a signatory to the global convention on biodiversity in 1985, requiring the protection and conservation of natural resources and the environment. Understand that this is currently being done through ongoing revival in the rising production of the crop to its post 1960s levels. In its physical form, cotton appears as whitened, soft basic fiber that is nearly completely cellulose (about 87-90%). As an agricultural product, the existence of cotton is as old as time in having been cultivated for fiber and diet in more than 6,000 years. Considering that the crop is abundant and cost-effectively harvested and the derivatives reasonably cheap, economically. Cotton stands out as an essential farm commodity and among one of the world’s top farm produces. The seed requires over 16 weeks for the crop to thrive and grow into a plant with balls ready for harvesting. The fact that cotton serves a vital purpose for consumers other than fiber for fabrics. It is used as an extremely significant resource of raw materials utilized in animal food supply and for different kinds of processed food ingredients. Considering that cotton is deemed as a major cash earner to millions of small sized farmers at the margin, in the Sudan hundreds of thousands of small growers depend on it as source of their livelihood. Despite all that, the major drawbacks to cotton production come from the escalating use and cost of pesticides and fertilizers and the destruction of cotton crops by pests and diseases. This was the case in the Sudan in 2021. In the process, planters in the Sudan and as presently done in several nations, are cultivating genetically modified cotton to enhance productivity and ward off cross diseases and infestations. For that, the production of cotton and the distribution in the Sudan under various types over time shows that, between 2001-2010, output intensified notably. In the process, the cotton production volumes of the two dominant varieties, most notably Barakat and Acala accounted for individual tallies of 1453838 lb to1379399 lb and overall estimates of 2833237 lb from 2001 to 2010 production season.Possibly Sudan boosts of enormous and varied agricultural assets highly indispensable in the attainment of sustainable agricultural development. This vast-untouched agricultural capabilities makes the nation independent and a net exporter of several agricultural produces. Against that back background, the Sudanese Government under the nation’s comprehensive plan towards the quickening of agricultural development, initiated variety of plans including the Green Mobilization Program and the Executive Program for Agricultural Revival (EPAR). Even at a reduced speed pace, the implementation of the schemes is currently showing excellent outcomes in advancing farm growth including cotton cultivation and operations. In the nation of Sudan, where the farm sector continues to experience unprecedented surge in the economy, offering employment for many citizens in the nation and benefitting from its contribution to a large portion of the nation’s farm businesses. Since the key agricultural products range from sugar cane, cotton, cereals, oil seeds, Arabic gum, cattle, and dietary items. The cotton sub sector ranks high as among the most valuable harvests supplied in Sudan. In the early years, cotton served as the principal overseas exchange generator, contributing significantly to the external reserves. As such, many families in the Sudan continue to rely on cotton as source of their daily living. In addition to that are the tens of thousands of people currently involved in cotton linked vocations. Notwithstanding all these, mix scale methodical analysis of the trends using temporal spatial techniques remains essential in evaluating what transpired all through 1960 to 2022 [40-45].
2.1. Methods Used
The research uses temporal-spatial data, ecological-economic, and agricultural census info based on mix scale tools of descriptive statistics and Geographic Information Systems (GIS). Just as this was intended to display the trends spatially, the tool assesses the state of cotton production, uses and the issues involved along Sudan’s Upper North region in North Africa and the Horn of Africa ecozone side of the nation. This was made possible by the retrieval of spatial data sets of shape and grid files from host of local, international, and regional agencies by country and states in digital form, using ARCVIEW GIS. Accordingly, the geospatial info for the study came from such agencies as the United Nations Food and Agriculture statistical and digital database (FAOSTAT), the US Geological Survey (USGS), Ministry of Agriculture of Sudan, The US National Aeronautical and Space Administration (NASA), the US Department of Agriculture (USDA) and the sets of other regional data by country and states in digital form using ARCVIEW GIS. To that effect, the spatial information for the study came through many agencies comprising of Sudanese National Population Commission, the United Nations Economic Commission for Africa (UNECA), the United States Department of Agriculture (USDA) foreign agricultural services (FAS) and The United States Department of Agriculture (USDA) office of global analysis. Additional sources of spatial data came from the Sudanese Meteorological Agency, and the USDA International Production Assessment Division (IPAD). Additionally, the USDA International Food Policy Research Institute, inter regional cooperative network on Research, The International Textile Manufacturers Federation, Sudan Central Bureau of Statistics, the archives of the Government of Sudan, the European Union, the World Bank and FAO also furnished other information needed in the research.Primarily, most of the cotton crop indicators like the area cultivated with cotton, the volume of cotton production, yield, harvested cotton, export and domestic consumption, initial and ending stocks, cotton varieties, commodity prices and market prices are not only from local and global sources. But indices like growth rates, and cotton export varieties from the different ecozones of Sudan, and the distribution of fertilizers, agrochemicals, vital to the production regions came from both, the Sudan’s Bureau of Statistics, Mundi Index and Keoma data agencies. In the same manner, Global data base of Cotton, the USDA, Arab Organization for Agricultural Development and FAOSTAT, Government of Sudan, United Nations Environment Programme, Global Environment Facility (UNEP/GEF), The International Textile Manufacturers Federation, Sudan Central Bureau of Statistics, and the Sudan cotton company planning and research department, helped with essential stages in the data acquisition process as well. On the one hand, the World Bank, the agricultural and data base of the United Nation FAOSTAT, USAID, International Fund for Agricultural Development data (IFAD), Government of Sudan, Ministry of Agriculture of Sudan and the Bureau of National Statistics provided the gateway to extra secondary data on the numbers, quantities, trends, gains and declines in cotton indicators and the other needed info. On the other hand, The Sudanese Standards and Metrological Organization, Swedish International Development Cooperation Agency (SIDA) and Kenoma, offered the assistance on historical data and other valuable information on cotton related indicators. Concerning the remaining data needs, the Government of the Netherlands, Sudan’s Ministry of Agriculture, the Sudan cotton company, planning and research department of the Sudan cotton company, Arab Authority for Agricultural Investment and Development, Agriculture Bank of Sudan, Sudanese Arab Seed Company, and Sudan Cotton Corporation were involved in the procurement of information on the areas cultivated, the volume produced and the highlights of changes. Given that the boundaries stayed same and unchanged in the North despite the partition, the regional and state, county and federal geographic identifier codes of the nation were used to geo-code the info contained in the data sets. This information was processed and analyzed with basic descriptive statistics, and GIS with attention paid to the temporal-spatial trends at the state, regional and national levels running through the desert or arid North and all over the Blue and White Nile areas of Sudan. The relevant procedures consist of two stages listed below.
2.2. Stage 1: Identification of Variables, Data Gathering and study Design
The initial stage in this enquiry started with the identification of variables sought to assess the scale of cotton output and trends at the regional, state, and national levels from 1960-2022. The variables encompass of socio-economic and environmental, data made up of population, rainfall, population change, quantity of fertilizer, cotton production, total cotton production, cotton area, yield, harvested cotton, cotton exports, GMO cotton, commodity prices, market prices and growth rates. The others consist of cotton varieties, cotton export types by regions across Northern Sudan, land use indices of areas and output, and cotton acreage fluctuations. Added to that, are the volumes or quantity and price of agrochemicals, like herbicides, and insecticides, percentage of quantity and price of agrochemicals, percentage of change, cotton areas planted in acreages and production. The others are sunshine level, precipitation by state, nighttime temperatures by state, the humidity percentage, elevation, daytime temperature, and aridity scale by region, land use indices of areas and output and cotton acreage fluctuations. Notable among the variables consists of export and domestic consumption, total distribution, and yield, initial and ending stocks. The variables as mentioned earlier were derived from secondary sources made up of government documents, newsletters, and other documents from NGOs. This process was followed by the design of data matrices for socio-economic and land use (environmental) variables covering the census periods from 1966-2022. The design of spatial data for the GIS analysis required the delineation of county and boundary lines within the study area as well. Given that the official boundary lines between the states remained the same, a common geographic identifier code was assigned to each of the area units for analytical coherency.
2.3. Stage 2: Step 2: Data Analysis and GIS Mapping
In the second stage, descriptive statistics and spatial analysis were used to change the original socio-economic and ecological data into relative measures (percentages, ratios and rates, averages). This process created the parameters for indicating, the volume of cotton production, cultivated area, land use change, cotton farmland deficits from activities vital to cotton production, cotton production by zone, the scale of usages, average yearly consumption of cotton, and cotton output level, and commodity prices over time. Of importance in all these are the market prices, growth rates, cotton acreage, and the amount of rainfall and changes in land use indicators prompted by growing consumption and population surge and growth rates across the study area among the individual states through measurement and comparisons over time. While the spatial units of analysis consist of the various states, regions, shorelines, counties, the boundary, and locations where the farming, consumption and export of cotton crop flourished. This approach enables the recognition of change and the level of usage. While the tables highlight the actual frequency and impacts, cotton cultivation land declines and the pace of production and the trends as well as the environmental and fiscal impacts. The remaining steps involve spatial analysis and output (maps-tables-text) covering the study period, using Arc GIS 11 and SPSS 29.0. With spatial units of analysis covered in the states (Figure 1), the study area map indicates boundary limits of the units and their geographic locations. The outputs for each state in the region were not only mapped and compared across time but the geographic data for the units which covered boundaries, also includes ecological data of land cover files and paper and digital maps from 1966-2022. In as much as this process helped show the spatial evolution of spots clustered over the zone, the various levels of usage, and the trends. The approach pinpoints the ensuing socio-economic and environmental impacts, as well as changes in the other variables and the factors driving the production volume, cotton land use and the effects in the study area.
3. Results
This section of the research focuses on temporal and spatial analysis of landuse activities in the study area. Utilizing descriptive statistics, beams an opening spotlight on the analysis of land use and cotton production in the nation with info drawn from state levels and mainly on large to small producers. The other portions present the percentage composition and distribution of both land use and cotton output across the various periods together with impact assessment of any accrued risks from operations in the North African nation of Sudan. This is followed by the continuing parts of the section comprising of GIS mappings, and the identification of the factors behind variations in cotton cultivation and the efforts of several stakeholders in the Sudan within the North African region.
3.1. Sudan’s Cotton Land Use and Output 1960-2022
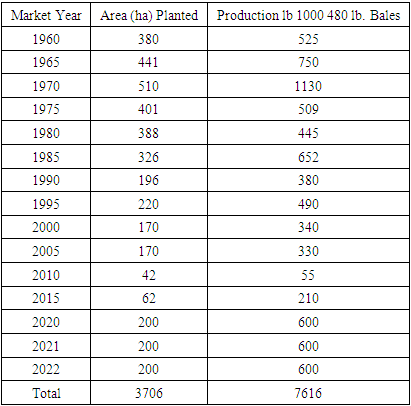
The thing to draw from Sudan’s profile in cotton land use from 1960-2022, is the firmness of the indices starting with cultivated area total of 3706 thousand ha and output volume of 7616 lb. In the process, the first periods of 1960-1985, represent times of intense cotton land use activities given the profiles of land area and output percentages. Being indicative of intense pace of operations in product delivery. Note that Sudan’s 2446 thousand ha in planted cotton fields nationwide in 1960-1985 occurred in an era deemed as the most heavily farmed at 66% of total land areas. It was also the time planters poured in all they had. Added to that, in as much as in the 1990s to the early 2000 at 756 thousand ha in total areas, the nation used 20.39% of available farming space for cotton cultivation. By 2010-2022 at 704 ha, land under cotton accounted for only 18.99% of the total. In starting with 380-441 hectares in cotton planted areas in 1960-1965 to boost capacity, during the periods 1970, 1975, and 1980, more areas of land including the largest size throughout the years at 510 thousand ha together with another 401-388 ha, came under extensive use in cotton cultivation. In the following 15 years during 1990-2005, the nation allotted close to valuable portions of land areas (196, 220 and 170 ha) to cotton. However, in the later years, 2010 -2022, areas under cotton reached lower levels of 42-62 ha in 2010-2015, only to jump to 200 ha by 2020-2022.The production activities as presented shows 3 different periods (1960-1985, 1990-2005 and 2010-2022) considered germane to the capacity of the crop. Among the 3 cycles, 1960-1985 not only accounted for the bulk of the Sudan’s output estimated at 4011 lb at the rate of 52.66%. But the pattern is followed by the activities in the remaining cycles of 1990-2005 and 2010-2022 during which production ranged from 1540 lb to 665 lb. With this representing 20.22 to 8.73% of output, in the first three periods, cotton output in Sudan grew remarkably by 525 lb, 750 lb -1130lb in 1960, 1965 to 1970. By the following years of 1975, 1980 to 1985, cotton production waned significantly by 509, 445- 652 lb. From there, during 1990-1995 to 2000-2005 periods, Sudan’s output changed further by 380 lb-490lb to 340 to 330 lb. In the ensuing years, 2010-2015, cotton output still rose further steam by 55 lb -210 lb at a modest pace, until it stabilized in 2020-2022 at 600 lb (Table 2).Table 2. Sudan’s Temporal Profile of Cotton Cultivated Area and Production 1960-2022
 |
| |
|
3.1.1. Sudan’s Cotton Cultivation Land Area and Production 2011-2022
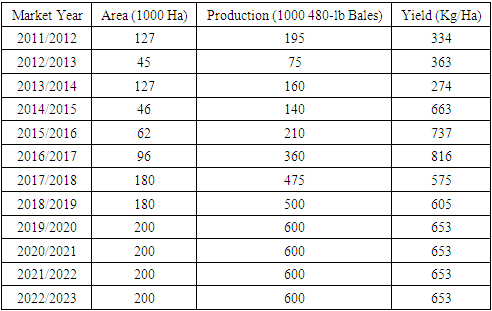
The analysis of the state of Sudan’s cotton market outlook years based on areas planted with crop and the actual production and levels between 2011/2012 through 2022/2023 reflects a deep contrast. Of the twelve years as represented in the market years, 2011/2023 -2018/2019 among the trio of key land use indicators, there exists visible variability in the first eight years for land areas under cotton cultivation, compared to the stable nature of the activities over the four years span from 2019/2020 to 2022/2023, when the transactions held firm for cotton land areas, production, and yield. Against that background, during 2011/2012-2014/2015, the opening physical values for cotton land area consists of identical sizes of cultivated areas of 127-45 hectares and 127-46 hectares involving deficits until the cultivated areas rebounded by 62-96 hectares in 2015/2016 through 2016/2017. Even at that, the same cotton land distribution patterns unfolded further in the ensuing periods 2017/2018-2018/2019. This involved much a bigger stock in cultivated land areas at the disposal of planters across the country. The fact that Sudan’s cotton cultivated land area rose notably back-to-back in the market years by 180 hectares respectively over time. In the same order, during the last agricultural market years of 2019/2020, 2020/2021, 2021/2022 to 2022/2023, cultivated areas remained at 800 hectares. Further along these lines, the 5-year average for cultivated cotton areas for 2017/18 - 2021/22 stood at 192 ha, whereas the percent change from 5 Year Average (%) reached 4. The production side of the analysis shows that after quick start based on the opening output level of 195 bales, by the market year 2011/2012. The values dropped drastically to 75 bales ((1000 480-lb bales) in the 2012/2013 seasons. Considering such recurrent shortfalls in cotton production in the country, in the next two cycles of 2013/2014,2014/2015, it is not surprising that the crop output still dropped further from 160-140 lb bales. Nevertheless, between 2015 through 2019, the produce rose notably from 210-360 lb bales in 2015/2016 to 2016/2017. The uptick in cotton continued deep into next market years in 2017/2018 -2018/2019 when crop production jumped again from 475- 500 lb bales. With time, the nation’s cotton production values reached all-time highs of 600Ibs bales throughout the periods 2019/2020, 2020/2021, 2021/2022 to 2019/2020, 2022/2023. This leaves the area with 5-year average values of 555 lbs in 2017/18 - 2021/22 at 8% percent change from a 5-year average percentage. In all the respective market periods, the ratio of cultivated cotton yield per kg/ha surged from 334lb, 363 lb bales to 274lb and 663lb bales between the initial 4 periods of 2011/2012, 2012/2013, 2013/2014, and 2014/2015. Further evidence of unprecedented growth in cotton yield, shows rising harvests measured at 737lb-816 lb bales to 575lb-605lb bales in the planting seasons 2015/2016, 2016/2017, 2017/2018 to 2018/2019. Just as the evolving patterns in other two cotton land use indicators assessed earlier indicated, the 2019-2020 to 2022-2023 temporal profile of the yield values, points to a steady and unchanged values of 653 lbs bales in the years outlined on the table (Table 3).Table 3. Cotton Cultivation Area and Production, Other Years 2011-2022
 |
| |
|
3.1.2. Overall Cotton Supply and Yield 1960-2022
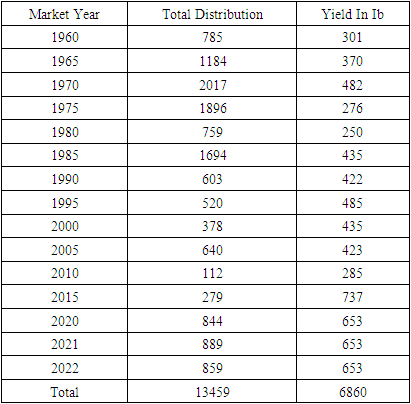
The period of the 1960 pertaining to the supply and yield levels of cotton, offers some interesting scenarios. On the one hand in the supply side, the maximum era of cotton distribution over a period of three decades from 1960-1990, shows overall estimates of 8938l lb at an average of 1276 while the lower period in 1995-2015 totalled 1929 lb with mean values of 385 lb. The supply activities during the medium cycle in the periods 2020-2022 for the nation of Sudan amounted to 2592lb under the average allocation values of 864 lb. From the percentage breakdown of the various periods out of the overall distribution figures of the nation at 13459 lb, the opening phase during the golden era from 1960-1990 represents 66.40% of all cotton supply transactions in Sudan with 14.33 to 19.25 of the supply totals more evident in 1995-2015 and 2020-2022. In the process, Sudan experienced unprecedented delivery of the produce with 1965, 1970, 1975 and 1985 seen as the periods of the highest volumes of cotton supply. During these periods, cotton supply levels at 1184 lb, 2017 lb and 1896 lb surpassed the levels in other years like 1960, 1980 and 1990 when distribution transactions reached identical values of 785lb-759lb to 603lb. With the cotton supply intensity gradually evaporating between 1995 through 2015 at 520,378, 640 lb, in 2010-2015 the supply levels fluctuated further at 112 lb-279lb before a notable rally of 844 lb, 889lb, to 859 by 2020 through 2022. Turning to cotton yield in Sudan over the years, the nation not only posted about a total of 6860 lb/ha from 1960-2022, but the individual break down of the corresponding yield estimates, and the average across the years, 1960-1990 through 1995-2015, reached 2356lb/ha- 362lb ha and 2635lb/ ha- 473lb/ha respectively. In the same order, Sudan’s yield level in 2020-2022 stood at 1959lb/ha-653lb/ha. This kept the percentage ratios of cotton harvests in the nation at 34.34%- 38.41 to 9.51%. From what transpired in the cotton yield distributions phases in the activities during 1995 to 2015. The data showed some consistencies given the identical levels of 485, 435, 423 with the outliers being 2010-2015 at 285 lb/ha -737 lb/ha as the market years 2020-2022 finished strongly at 653 lb/ha throughout the periods. The accumulated sum of the cotton domestic consumption for the years 1995-2015 to 2020-2022 varied by 19.03%- 29.09% respectively (Table 4).Table 4. The Overall Supply and The Yield In Sudan 1960-2022
 |
| |
|
3.2. Impact Assessment
Given the rise and variations in cotton farming and production activities in the study area. There are mounting risks regarding the effects of various scales over the usage and purchase of chemicals among farmers in the Sudan along cotton producing hub with environmental and socio-economic fallout.
3.2.1. Ecological Risks from Surge in Fertilizer Use
Looking at the concerns and alarm over numerous ecological risks from yam production. The mounting liabilities from cultivation, land treatment with fertilizer, processing and the effluent flows and run offs are sometimes big reminders of the dangers posed to both the built and surrounding natural ecosystems. Being a nation where fertilizer import prices and volume for Urea and TP from 1995-2005 surged notably. In the case of Urea, the opening price values per tonne in US $ went from $73.63 per tonne to $209.69 between 1995 through 2005. The pricing for Triple superphosphate (TSP) at the same period, ranged from $54.02 per tonne to $260.32 in the span of a decade [46]. While the same can be said of the mini tabular snapshots of the recommended rates of fertilizer applications in cotton farming. In all these, it is evident, that the applications of fertilizers amongst cotton farms in the country seems on the rise at levels deemed quite risky to the adjacent lakes and rivers and the farm operations (Table 3). Seeing that, the spraying of fertilizers on cotton in Gezira began during the mid1950 with one dose (1N) of nitrogen(18kgN/fed) before in it rose to 36kgN/fed(2N) in the 1960s. The(2N) application threshold stayed firm up till now despite the sudden surge to 3N in 1981-82. Elsewhere in the same period, by the 1980s, Northern Section of the Rahad Scheme turned to (3N) as well [47]. Even though the authorities in Sudan opine that rainfed irrigation uses little fertilizer, the flow to the adjoining areas, the streams, and major head waters could be lethal and problematic. For that, it is always imperative to show certain level of concern in the use of fertilizer in the actively producing cotton farm areas of the country (Table 5).Table 5. Recommended Rates of Fertilizer Applications In the Sudan
 |
| |
|
3.2.2. Environmental Effects
In study area and in the other places where multiple threats to cotton farming coming from pests and insects results in the destruction of crops and huge economic losses to the growers. It is not uncommon to use approved chemical insecticides to prevent continual attacks on cotton crops. For that, over the years, the cotton growing areas who barely catch a break from mounting losses in the process resort to the application of the chemicals to safeguard their crops. In that way, chemical insecticides have always been the key method of containing the problem but at an escalating expenditures estimated at 30 to 40% in overhead costs. Whereas the pest management activities induce the contamination of the ecosystem and destruction to different life forms therein and community health. The major insects’ pests doing further damages consists of Bollworms, Jassids, Thirips, Fleabeatles, Whiteflies and Aphids. With the spread patterns of these insects different and dictated by shifting seasons and climatic uncertainties in rainfall and the intensity of host plants. The emergence of late season pest (Aphid) initially during the planting season and the early season pests (Jassid and Bolloworm) coming in extended planting season really compounds the risks. Against that background, during the 2019 market season in which the spread of pests besieged production. Sudan’s cotton output suffered major devastation from pests like cotton Mealy Bug and Bacterial Blight with an eventual decline of harvests by 80%. The other impacts partially involved spike in water use, crop losses, land degradation and pollution risks. Since chemical spray threatens marine ecosystem, they endanger biodiversity as well. Communities especially in the lower areas in the cotton producing states and regions of Sudan face serious risks since it impedes cultivation as well (Figure 1.1).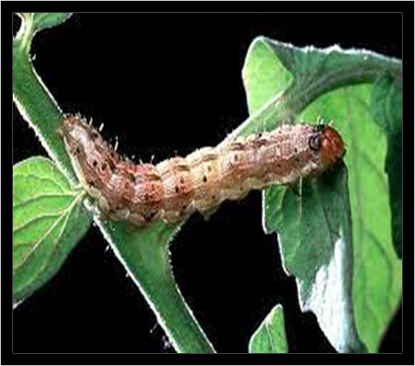 | Figure 1.1. Pest Destroying Cotton Plants |
3.3. GIS Mapping and Spatial Analysis
The GIS analysis covers the graphic flash of spatial patterns highlighting production, land use, and the costs of seedlings used. In addition to that are the differing activities representing spraying of chemicals and the agro-ecosystem of the region vital in the cotton land use activities. From the depictions of the indicators in space, emerges patterns of changes in output in the Sudan’s cotton hub and other things that transpired. The info as conveyed through geo-visual analytics of different scales and colors also symbolizes the changing paths of the sector. The capacity to visualize such spatial-temporal evolution of production activities over swaths of vast farmlands using GIS points to the tool’s essence in showcasing the state of cotton landuse use and the resurgence in Sudan. The GIS in displaying these forms, went a long way in revealing persistent dispersal of producing spots across different places in Sudan. From the rhythm of that spread, the harvesting of cotton seems intact and concentrated primarily on portions of the map highlighting spots germane to the production from north to south of the study area. Since the spatial dispersal of cotton land use activities illustrates the state and evolution of the subsector. The changing patterns of principal indicators central to regular state of the commodity and related factors remained evident across time. To that effect, the evolving patterns in cotton production levels in dark and light green, blue and milky colors from 2005 to 2022 shows the emergent core centers instrumental in the increases in cotton output levels. This shift happened at rates quite different from one period to the other with increments and declines across the production regions.Accordingly, from the 2022 season, the geographic highlights of the regional profile, shows 80% of Sudan’s cotton production visibly spread over the Blue Nile, Kassala and Northern. From the info, the green portion of the map indicates the three areas where the national output is of great importance. The breakdown of the information pertaining to the spatial distribution in percentage rates of cotton output, shows Blue Nile in dark green deep on the lower side of the map in the South, with higher concentration of cotton production estimated at 65% of the overall nationwide. Further up in the Northeast central, comes the Kassala axis responsible for about 18% of the national output. Along the Northern plain, near to River Nile, emerges the sites responsible for 12% of Sudan’s cotton production, near the Egyptian border (Figure 2). 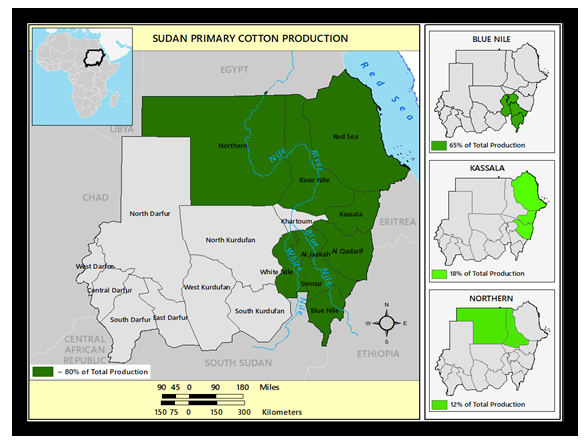 | Figure 2. Spatial Distribution of Prof Primary Production, 2022 |
Considering the significance of cotton production in the 2005 season, the spatial distribution of the commodity presents a new pattern showing a double-digit level estimated at 13% and firmly visible in the northern region for the period. During the same year, in the Northeast zone, the map shows 4% of cotton production in the country emanates from farms clustered in the upper part of the map along the Red the Sea area at margins below the previous spot within the Northern axis. Further down on the map in the Northeast and Southern east, note clusters of areas most notably Gadaref, Sennar, and the Blue Nile hub with production capacities of 13%, 11% to 6%. Adjacent to these spots are cotton production areas in the Southwest area of White Nile responsible for 6% of the country’s output and the Al Jazirah in East Central zone with the largest national production percentage level of 47% superseding every other regional source of cotton in nation during the 2005 season (Figure 3).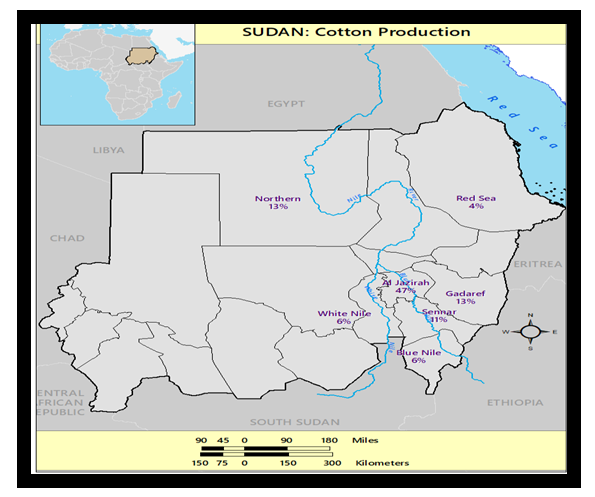 | Figure 3. Spatial Distribution of Primary Cotton Production, 2005 |
By 2010, apart from the Northern zone’s 13% share in cotton production nationwide during that period. There came some changes in the spatial distribution of cotton production with Al Jazirah picking up 2% to arrive at 49% while nearby Senmar in the Southwest dropped to 10% as Al- Qadarif in the Southeast also saw its commodity values rise by 1% only to finish at 14% in production (Figure 4). Considering the role of physical forces in the production of cotton and the prevailing effects on the harvest and planting of the crop. The spatial distribution of some of the daytime temperature levels in place based on the map shows slightly identical values consistent in the nation. This highlights the cotton producing areas in the red sea and River Nile in the North, identified in orange, red and beige under conditions measured at 37.71°C -38.40°C, - 36.51°C -37.70°C and 0.01°C -35.10°C. Towards the South east and south west side of the map in yellow are temperature levels of 35.11°C -36.50°C prevalent in the cotton hubs at Kassala, Al-Qadarif, Al- Jazirah evident in the Southern axis of the country (Figure 5). Additionally, the underlying spots highlighting night time temperature and Sun shine hours in the maximum and medium values coincides with the core centers of cotton farm production represented in red at North Kurdifania on the scale of 25.21- 35.30. Elsewhere, in the map under orange and yellow colors, emerges spots with temperature scales of 22.11-25.10 firm from the Red sea, River Nile, Kassala, Al-Quadarif to the White Nile under various values of night time temperatures. Of great importance on the maps are the yellow spots represented on the scale of 19.31-22.10. This is made up of cotton production hubs of the Northern area in the upper part of the map, coupled with further spread of the temperature values in Al-Jazzirah, Sennar and Blue Nile corridors (Figure 6).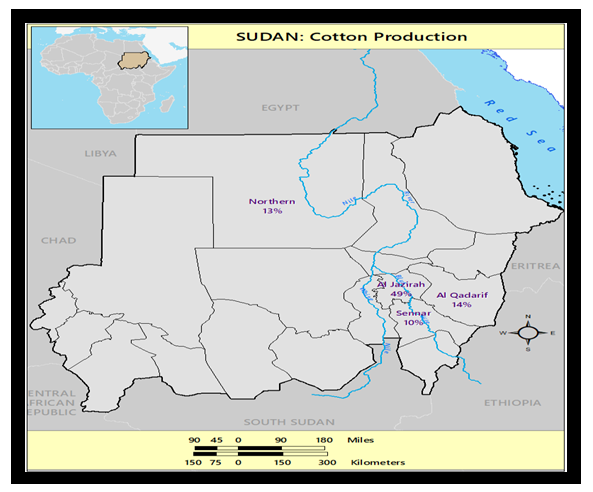 | Figure 4. Spatial Distribution of Primary Cotton Production, 2010 |
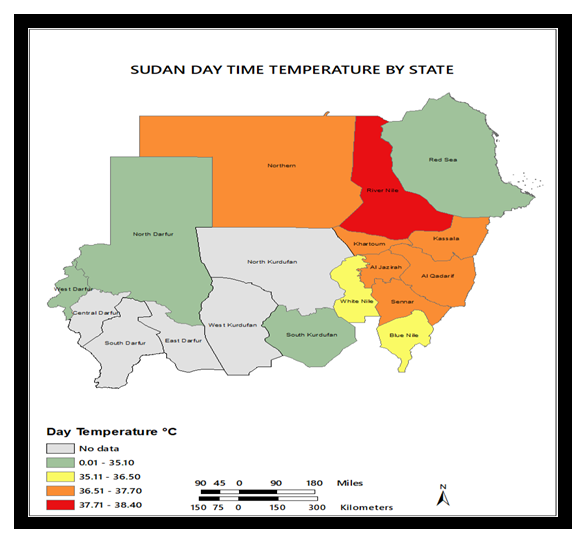 | Figure 5. Day Time Temperature |
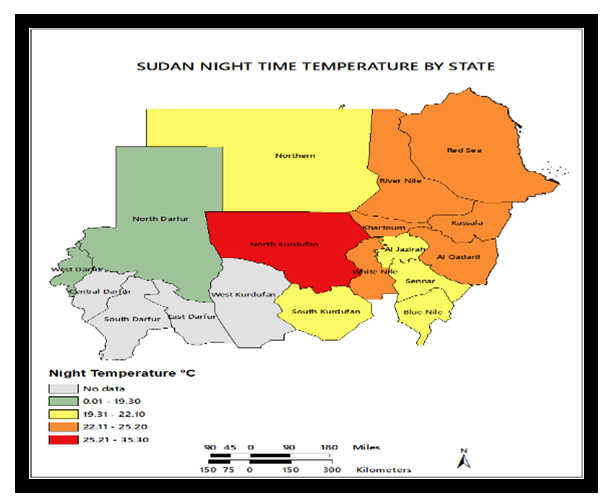 | Figure 6. Nighttime Temperature |
The sunshine side of the physical variables as robust as they are and displayed under the colors of red, light red, orange underscores their relevance in the production and harvest of cotton. For that, the dispersions in space across different states remain in sync with the major cotton producing areas from Northern states to Blue Nile. These are spots on the map legend captured under the hour scales of 3460-3614 hrs to 3177-3468 in the orange colors. There are as well the states in the orange shades with the hour values of 2,848- 3176 to 1-2847 in sunshine that are indicative of the physical parameters shaping the production of cotton in the Sudan (Figure 7). 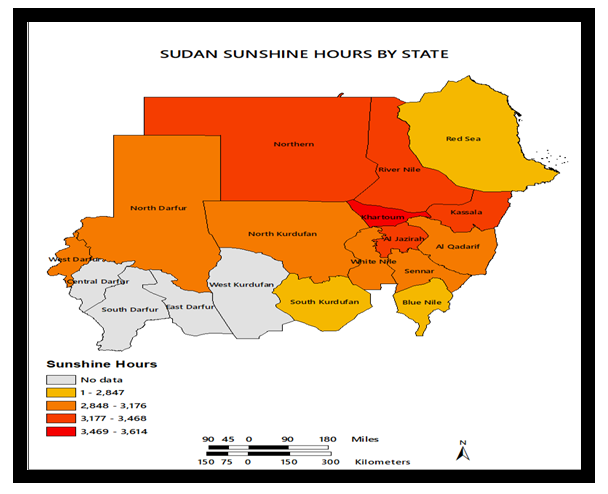 | Figure 7. Sunshine Hours By State |
To really grasp the spatial dimensions of the physical attributes of cotton producing areas in Northern Sudan, consider the climate info contained in the legend box highlighted in points or spots of different colors of red, orange in the upper side along the northwest, central and the blue in the lower axis in the south. The fact that the spots from port Sudan, Dangola and Kasalla areas in the Northeast portions associated with the commodity production proximal to the major cotton hubs of the country attests to their role as catalyst. In the absence of these spots, access to the corridors and suitability of local conditions, would have been difficult for farmers tasked with production to harvest the commodity efficiently over the years. These inferences make the spots on the map under three different colors of red, orange, and blue, worthy symbols of the climate under warm arid and tropical savannah side of the zone as expected (Figure 8). 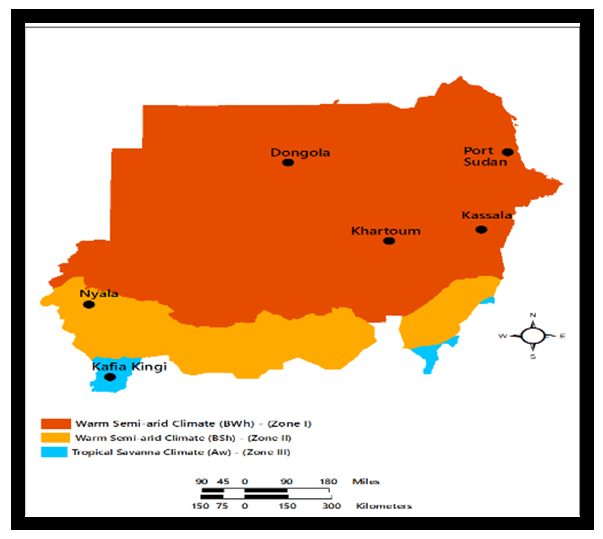 | Figure 8. Climate Types of Sudan |
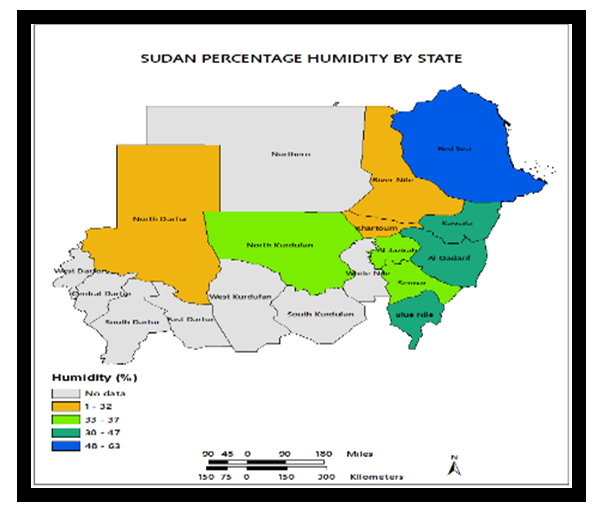
The other thing about the physical elements shaping the production of cotton in Sudan stems from the high and low elevation levels indispensable in undertaking activities adjacent to and surrounding the cotton fields in the various regions of the country (Figure 9). The humidity percentage of an area as the amount of water vapor in the air under different portions germane to the environmental forces comes under various scales and colors. Just as in the map this includes the high-level percentage rates of 40%-63% steadily firm in the Northeast zone of red sea. It also represented as the maximum level of humidity while the dark green spots in the map categorized under 30-47% in vapor scale show visible shifts on the map towards Southeast zone further to Kassala, Al Qudriaf and the Blue Nile area. Added to that also are the humidity percentages of 33-37% to 1-32 evident at Sanire and Aljazirah at 40%-63% and the Southeast zone of the Red Sea (Figure 10). 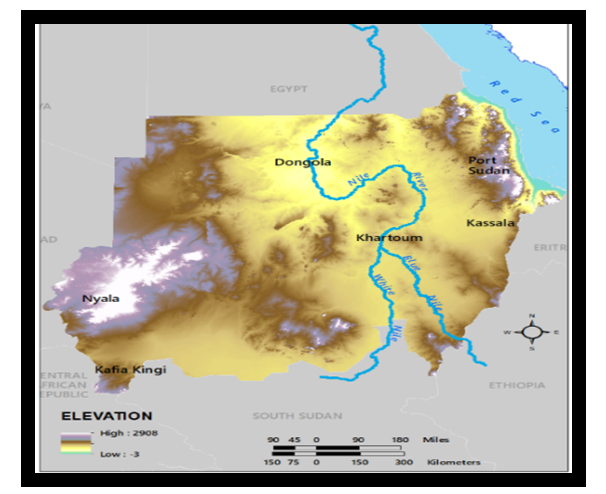 | Figure 9. Elevation Levels In the Study Area |
 | Figure 10. Humidity Percentage Distribution By State |
Knowing the importance of precipitation in cotton farming and the disparate nature of rainfall therein, the variability remains as vital as ever. Thus, regarding the volume of rainfall in the different states in Sudan actively involved in cotton farming. The Southeastern cotton hubs made up of Al-Qadarif, the Blue Nile and nearby South Kurdufan in blue color, saw highest precipitation levels. The rain distribution levels in these places are represented by 5,512 -7,341 in blue together with 4,162-5,511 precipitation levels in dark green, evident in the state of Sennar. In the other cotton producing areas denoted in light green, the duo of Al- Jazirah and White Nile in the Northwest also experienced rainfall volumes of 2342-4161. Additionally, Kasalla represented in the orange color experienced rain fall levels estimated at 732-2341 as the other spots of cotton farming in red colors appeared in the Northern states, River Nile, and red sea zone. Within the same time, the red colors became clustered in various spots on the map, where precipitation levels stood at 0-731 (Figure 11).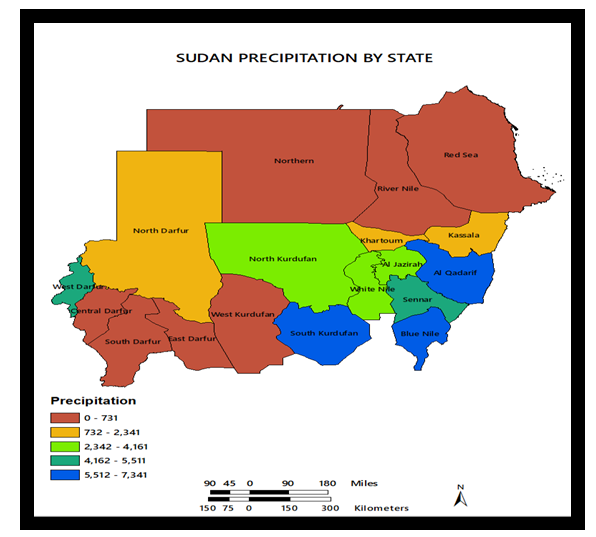 | Figure 11. Spatial Distribution of Sudan’s Precipitation By State |
3.4. Factors Driving Changing Cotton Land Use
The primary factors responsible for the changing cotton landuse and production trends in the Sudan do not occur in isolation. They are linked to different elements located in the larger national agricultural structure. This encompasses a host of policy, socio-economic, and physical-(environmental) factors. These elements are presented in brief in the paragraphs below.
3.4.1. Policy Elements, Infrastructure and Technology
The government’s interest as a vital element over the years, came with the formulation of official policies highlighting the positions and state machineries put into place to optimize the capacity of cotton production activities. Part of the efforts involved the conservation and sustainable use land under cultivation. Consistent with the other components of the policy dimension is the enabling atmosphere created by the government to facilitate the infusion of infrastructure with innovative technology driving the state-of-the-art cotton farming. This is evident through the advances in agricultural biotechnology and the way it is advancing the success of GMOs in cotton farming in the Sudan over the years. This is in line with ongoing policy initiatives to revive and return cotton export back to its golden era levels of prominence in the global marketplace. Added to that in the policy, are the moves by western non-governmental organizations and their governments, Sudan’s private sector, financial institutions, and state parastatals in advancing the cotton subsector. These actions are not only indicative of the drive towards the support for the production, cultivation, and manufacture of quality cotton derivatives, but they are indispensable in the handling, and distribution of cotton crops in the 21st century. Against that background, the nation’s comprehensive plan towards the acceleration of farm development, entailed the rolling out of a variety of plans including the Green Mobilization Program and the Executive Program for Agricultural Revival (EPAR). Even though under a reduced pace, the implementation of the schemes is currently showing excellent outcomes in advancing farm growth, including cotton cultivation and operations. Building on sincere moves by the Sudanese government to revitalize cotton output and the local textile trade. The Bt cotton program represents initiatives intended at realizing the actual desires of returning Sudan back into the orbit of international capital as a big actor in global cotton transactions. For that, Sudan cultivated an overall area of 61,530 hectares of Bt cotton during 2013 through 27,000 farmers. While this is by far, 3 times more than the 2012 levels of 20, 000 hectares. Among the Sudan’s cotton land area of 78,573.6 hectares in 2014, about 99% of that was biotech cotton on irrigated areas.
3.4.2. Socio- Economic Forces and Demography
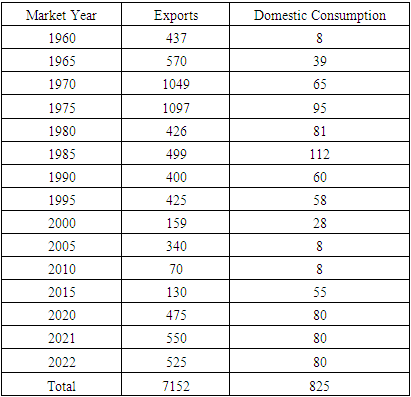
Cotton has always assumed greater importance in the welfare of farmers in the nation. This is line with the current prospects in many places and Gezira State in the Sudan, where the crop is the key commodity. While the sustainability of cotton in the Gezira Scheme remains noteworthy issue, particularly, in the aftermath of visible weakening of the cotton sector over time based on the perception of growers. To boost the markets and stimulate distribution and exchange, the government is moving forward with support to procure about 336,000 hectares of cotton land to be used in the generation of the crop. This is intended at promoting the viability of cotton crop whose values are growing globally by targeting both irrigated and rain-fed systems in Sudan. Realizing the essence of cotton as major cash crop in the Sudan and the risk exposures that triggered declines in the past years due to bollworm infestation. The adoption of Bt cotton in Sudan was therefore seen as an acceptable shift and possibly expected to optimize cotton production as key cash crop, and chief catalyst to the nation’s economy. The endogenic containment of dreaded bollworms prompted a decrease of the production expenses, and surge in cotton productivity. Additionally, Bt cotton minimizes the havoc triggered by killer insects while enhancing cotton quality by reducing tackiness. In all these, the prize of cotton insecticides and application for non Bt cotton stands at $892 per hectare, but eventually falling to $586 for Bt cotton by around 35%. From the process, the net gain for those farmers growing Bt cotton was projected to be $405 per hectare. Against that background, the opportunities provided through the emergent export markets in the global arena, has provided a fresh path that is now sparking a revival of the cotton sector in the 21st century. The patterns of growth trends in cotton output in Sudan have also been linked with various factors such as rapid population growth, vast internal market supplies and demands and the growing presence of high yielding improved varieties of cotton. Information on the market years for export and domestic consumption, showed the combined values for oversees shipment of cottons and local use totalled about 7152 lb to 825 lb between 1960-2022. Among the various periods both the export volumes and consumption figures in 1960-1990 estimated at 4478lb to 460lb amounted to over 62% to 55.75%) of the actual total of the former and later cotton indicators listed on the table. Further looks on the Sudan’s foreign shipment of cotton exports for the country points to middle level volumes of shipments in 1960 and 1965 estimated at (437lb-570 lb). Just as this pales in comparison with the huge export numbers of 1970-1975 at 1049lb-1097lb. The export activities during the ten-year span of 1980,1985, and 1990 reflects identical values of 426lb, 499lb and 400lb as a testament to the extent and form of cotton flow into the global market place. Even at that, moving down the roads in the later years from 1995 through 2015, Sudan’s international shipment of cotton products was at sizable levels enough to be traded during export transactions. The export values of the produce in those years consists of about 425lb-159 lb to 340lb 70 lb and additional 130 lb as recorded between 1995-2015. By the remaining years 2020-2022, medium levels of 475lb, 550lb -525lb in export bound cotton crops, surfaced again in the Sudan’s side of global cotton trade. Aside from a few exceptions in 1960 and 1985 in domestic cotton consumption at 8lb and 112 lb, the temporal distribution in the other years seemed somewhat stable with some of that evident, given the average value of 80 lb for the periods 2020-2022. Consistent with the analysis herein, is three domestic consumption totals across three periods starting from 1960-1990, 1995-2015 to 2020-2022 at average values of 65.1 lb and 31.4 lb (Table 6).Table 6. Sudan’s Cotton Exports and Available Stocks 1960-2022
 |
| |
|
3.4.3. Physical Environment, and Diseases
From the Sudan’s 80 million ha in arable land and only 20% set aside for farming in places dubbed the frontiers of cotton stretching between the Blue Nile to the Red Sea under diverse ecozones. In such conditions, where the output and processing of the produce require vast water transfers. The cultivation of cotton under different geological conditions including hot spells and the intensity raises demands for irrigation water transfers to boost output. Therefore, under the physical conditions in the study area, cotton farming relies on techniques of irrigation, alongside the spaying of agro-chemical inputs on various soil types. In the process cotton crop thrives on clay soil deemed common in the Gezira, Rahad, New Halfa, Suki, Blue Nile, and the White Nile areas as silt soil in the Tokar area in the East supports farming together with rain fed irrigation. In lieu of the physical conditions suitable for cotton, 80% of the production in 2022 held firm in the Blue Nile in the South and Kassala near the red sea. Nevertheless, the capacity to produce and harvest cotton and its derivatives from cotton seed meal, and cotton seed oil depends significantly on the exposure to pests and diseases. These stressors can impede productivity and the actual returns at any cotton farm. Since some of the pests and diseases listed as cotton green mite and cotton bud necrosis, the spiralling whitefly and cotton anthracnose constitutes serious risks. Understand that whatever the different components of cotton derivatives from cotton seeds to cotton oil and others mean to communities. Never overlook the risks posed to cotton from the attacks unleashed by the pests and diseases. The recurrency of their outbreak on production within many cotton farms can influence the shifts in land use and production across time as we demonstrated in this enquiry in the study area. For that, very many pests and diseases have the disastrous capacity to affect the time, labor and money spent towards the cultivation and harvest of cotton crops. They can also stop farmers from profiting and reaping the benefits that accrues cotton cultivation activities. Unsurprisingly, Sudan’s cotton production fell by 80% due to pests at levels that affects exports in the nation. This significantly impacts the exports of cottonseed by-products, to the extent that in Sudan, 80% of this year’s cotton production failed due to exposure to pests.
4. Discussion
The study emphasized the scope of cotton land use by assessing the state, trends, relating to structure and presence anchored on a set of indicators from cultivated land areas to production capacities in Sudan. This as well consisted of the states, region, and the frequency of variations in the pace based on increments and declines in cotton landscape resources and the other issues. The other aspects of the assessment concerns links between cotton land use, production activities, self-sufficiency in agriculture and the set of policy rooted in socio-economic and ecological, biological, and physical elements. With all these captured under many themes from policy, demography, environment, to common crop diseases, and state supported agricultural biotechnology infrastructure driving research and development efforts. The introduction of GMOs in cotton to boost productivity and eradicate the spread of common diseases amongst others remains a commendable policy decision. As such, the ongoing assessment covered the temporal profile of change among many indices including the prices of farm nutrients, cotton farm crops, cultivated area and yields, domestic supply and exports, the rising use of fertilizers and agricultural-chemicals and probable pollution hazards in farm zones adjacent to the network of rivers in diverse ecozones. From the findings in the enquiry, and where the sector was before and the road ahead amidst the sectorial revival agenda advanced by the government. The Sudan’s agricultural policy pronouncements and implementation pertaining to cotton, seems headed in the right direction. Clearly, the status of cotton land base, usage and the production in the Sudan seems promising and on track with abundance far ahead of other nations in Africa considering the usefulness. In fact, upon further scrutiny of the information encountered during the enquiry, aside from Egypt, we did not come across any other cotton market in Africa that matches Sudan. The upsides based on array of derivatives, global market profile and the potentials bestows a wider influence on the commodity as a cash crop despite the common dangers from crop disease occurrences and fluctuating climate and water demands. Granted the heavy concentration and dominance with 80% of all cotton production in the Blue Nile and Kassala areas in the Sudan’s cotton hub activities during the planting season of 2022. Of substantial relevance in all analysis caried out so far, is the overwhelming presence of both high production volumes and cultivated land areas over certain periods spanning through the decades of the 1960s-2022. In the process, the opening eras of 1960-1985, symbolize periods of deep cotton land use activities seeing the profiles of land area and production percentages. As a measure of the intense tempo of activities regarding cotton commodity supply. The Sudan’s 2446 thousand ha in cultivated cotton lands across the country from 1960-1985 happened in an era considered the most heavily farmed at 66% of the total land areas. Even though the activities in that era were at an all-time high by comparison to other periods. It represents the time farmers gave it all and laid it all on the table for market flow. Considering that the impressiveness of the Sudan’s cotton export activities can no longer be buried under the carpet notwithstanding the transition phases and the commitment to refocus all energy to sectoral revival and bounce back to the prominence attained in the golden years. Undoubtedly, the turnarounds in cotton production under the two major types (Barakat and Acala) occurred over the ten-year span of 2001-2010. This coincided with the decade of recurrent exports involving largest portions of Sudan’s export overall volumes at a rate of 95.84%. Additional, glance at overseas delivery of cotton produce out of the Sudan, shows medium estimates (437lb-570 lb) starting during the periods 1960 and 1965. This seems lower in contrast to the colossal foreign market export figures of 1049lb-1097lb in 1970-1975, as the operations in 1980-1990 reflect similar values at an average of over 400 lb. All through the three decades of 1960-1990 during which Sudan’s total estimates in opening total stocks of cotton reached 4547 lb to 77.81% in the overall average of 649 lb. The ensuing periods 2000-2015 followed up in that order with the 504lb, based on the mean value of 100lb, at a rate of 8.62% in Sudan’s cotton output from the opening stocks. To track the extent of cotton land use trends, output, and changes in the indicators and rankings as key export, ecological stressors, factors, and current concerns. The paper used mixscale model of descriptive statistics and GIS with secondary data under groups of socio-economic, physical, ecological, and agro-chemical indicators from percentage of change in cotton output to cultivated land area. Of essence in the study is that despite production activities in other areas, the Blue Nile zone stands out. At the same time, the variations in cotton output and use did not actually happen in isolation. They emanated through various policy, socio-economic, demographic, physical and environmental and tech forces located in the larger agricultural structure. Building on numerous advances shown in the enquiry to help managers assess issues encountered in cotton farming within the nation and different states. The paper offered remedies ranging from education, monitoring, and regular mapping using GIS and the design of national cotton land resource information system using data on related indicators with interactive features tracking the state of the sector regionwide and across the country.
5. Conclusions
This study analyzed cotton farmland use based on the rubrics of production, size, and the impacts in the Sudan with vital outcomes. This includes the following headings: a) The Sudan has vast potentials; b) Cotton in abundance; c) changes evident in land use indicators; d) mix scale methods effective; e) changes prompted by various factors; f) The important aspect of this enquiry comes from the capacity and richness of cotton in the Sudan’s production hubs from the Lower zones of the Blue Nile to the adjoining areas. Because cotton produce flourishes greatly under varied settings sustained by vast tapestry of biodiversity in an area surrounded by both desert and a mix of damp tropical and equatorial ecosystems along the Lower South. The turning of the Sudan into the frontier of cotton production with output and cultivation landbase at elevated level did not start today despite fluctuations in the global marketplace. For that, the current resurgence in the cotton export market to bring back Sudan to the orbit of international prominence is a testament to the growing potentials of the crop in manner deemed far ahead of competing crops. At the same time, the cotton sub sector Sudan did not give up too many grounds despite common challenges and the way Structural Adjustments programs (SAP) in the 1980s-1990s led to the removal of subsidies for farms at the margins in many Sub-Saharan African nations, that incapacitated the viability of the sector. Since the natural environments in Sudan’s Lower region have always provided the critical bio-geoclimatic parameters such as favourable temperature, soil, and a climate critical in the surge in output. The different crop types from sugar cane, sorghum and wheat continue to flourish across different ecozones in the Sudan. As such the producing areas in the lower axis of the nation still maintain full dominion in production levels considering the proportion of output across space considered ahead of the areas in the sector. Seeing the significance in the spatial evolution of cotton production from 2005-2022 evident in the fiscal policy, coupled with the point that planting occur under 4 periods yearly in the different geo-ecological zones. Among some of core cotton producing areas over time, those that come to mind consists of Blue Nile, Al Jazirah, Kassala and host of others serving as locales for the transactions. For that, cotton crop not only ranks high as vital farm produce, currency earner and food source to Sudanese families and restaurant menu daily. During the three decades of 1960-1990, Sudan’s total estimates in the opening total stocks of cotton at 4547 lb, covers 77.81% of the total under average value of 649 lb. In underscoring these potentials, the study added a novel way through which the nation can build on to consolidate the continual dominance and production outlook in the sector. The other important way to look at the fascinating result that emerged out of the enquiry encompasses the extent and proportion of variabilities in cotton land use all through 1966-2022 in the Sudan. Regarding the shifts in the temporal profile of the two major land use indices represented by the size of cultivated areas and the volume of cotton production across the different periods. The ratio of change that emerged in the time series, implies continual signs of highs and lows in the temporal distribution of the indices. Through the calibrated model, the size of cultivated cotton land and production, the intensification, and the concentration of farming operations surfaced more in certain decades than others by greater frequency from 1966 -2022. For that, the opening six years from 1960-1985 reflect decades of most extreme cotton land use operations in terms of land areas, production volumes and their ratios. As ample proof of the vast activities pertaining to transactions on the crop. Note that among the 2446 hectares of planted cotton fields from 1960-1985. The activities that ensued under the 25 year span not only fall under the most heavily farmed decades, representing 66% of total land areas. But the era represents the period of biggest rallies in farm operation with the scales at an all-time high. In the same order, by the following decade of the 1990s-2005 at 756 thousand hectares in total, the Sudan used about 20.39% of the farmland. This continued until 2010-2022 at 704 hectares for merely 18.99% of the overall land budget. Being the 3 cycles deemed germane to production, the temporal spread across the 1960-1985 accounted for the bulk of the Sudan’s output estimated at 4011 lb at the rate of 52.66% of the total. However, the pattern went further deep in the remaining cycles of 1990-2005 and 2010-2022 with outputs from 1540 lb to 665 lb representing 20.22 to 8.73%. Recognizing those variations and highlighting the trends as a step forward in land use informatics. The approach provided the path vital in the design of a regional cotton index and land information system for the zone. Applying descriptive statistics and GIS tools of the mixscale orientation as analytical devices injected more awareness to the evaluation of cotton farming operations. The model stayed quite efficient in detecting the trends, elements, efforts, and environmental effects, variations in ranking and the intensity scales over time. Accordingly, using descriptive statistics in that way underlined the capacity of systems essential in tracking cotton production and shifts in fam land areas. This application of the tool further extended to the assessment of other indicators from distribution of the crop, yield levels, to chemicals, opening stocks and the actual cotton varieties and volume of export bound cotton commodity. In as much as the calibration of the analytical tool also pinpointed variations in the context of gains and declines, the phases of high, medium and lows in the composition of ratios and percentages. Undoubtedly, the model provided more insights highlighting the intensity of land cultivation, production, and the proportions over time together with the environmental costs of cotton land use. Considering the scope at which GIS mapping revealed the spatial patterns of cotton production and the concentration of harvests levels in specific spots in space across regions of the country. The model to the effect, left its mark with style on the contours of innovation in visualizing the geographic clusters in the percentage of changes over time in cotton production. The other dimensions cover spots in space where the percentage, scales, and related indicators like temperature, elevation, humidity, precipitation, and sunshine hours germane to cultivation were highlighted. Additional graphical features also located the national expenditures on liability footprints based on environmental risk indices consisting of cotton farm fertilizers in the Sudan. From the utility in visual bio environmental informatics, analytics, and impact appraisal of land use in the Sudan. The GIS showed ample positives in pinpointing the site and, pattern, the scale of ecological, physical, and climatic parameters shaping production and their diffusion. Underlining these patterns and the trends as well as potential concerns helps move the emphasis in land protection in vulnerable areas to the corridors of mitigation where disasters are pending. In that mode, the study added ecological protection dimension. Making the cotton planting regions aware of these risks as manifested in the research, reduces the prolongation of ensuing dangers.Seeing that the shifts in the patterns of cotton land use stems from many forces comprising of policy, socio-economic, demography, the environment, and latest biotech innovations leading to the proliferation in GMOs and the introduction into cotton farming. In contrast to the awful policies adopted during 1960s through 1970s and 1980s that besieged the utility of cash crops in the other countries of Africa. The farm policy pronouncements and implementations in the agricultural sector of the economy in the Sudan did the opposite. Accordingly, the Sudanese government remained in the forefront through efficient policy enactments that are creating the needed enabling atmosphere beneficial to agriculture. The spillovers from such polices as shown in the enquiry, is manifested through the series of capacity building initiatives and partnerships with overseas and local actors. This is leading to the adoption of more efficient techniques and conservation measures in cultivation driving the revival of the sector. This is being manifested with cotton production now projected to rebound to the levels of prominence once witnessed in the international export markets of the 1960s, and 1970s. Added to that, the introduction of biotechnology on the basis of policy and access to tech infrastructure to sustain plant health and boost productivity remain worthy steps. This stems from the emerging market confidence through revenue generation and extension of GMOs in farming. Such moves are now taking cotton cultivation and production to another level. With the innovations brought through GMO farming and its emergence seen as a game changer in crop protection. Much of the profits for growers is reflective of the surge in population growth rates from 1960-2022. In a setting where opportunities exist to provide the sector access to internal market options and consumers positioned to draw from a timing population while meeting demands in foreign export transactions. The upsides in the intensity of cotton farm operations in the study area from 1960-2022 could not have occurred the way it did without access to the consumer made possible by population surge. Since the full potentials of cotton farming cannot be fully fulfilled without reliance on favourable topography and suitable soils and climate in the cotton hub of Sudan. The producing hubs affirm the linkages of intense production pace and land use since the crop flourishes in ecologically diverse tropical systems like the zone. The suitable conditions provided from soil types spanning over vast territories across the cotton producing areas as well as water usage, temperature, heat, and precipitation levels as catalysts just to mention a few, provided the ingredients for sectorial turn arounds as indicated in the study from 1966-2022. The enquiry in affirming the essence of those forces in the nation’s cotton farm operations re-asserted their power in the sub-sector in a manner capable of influencing public discourse and the return to splendour of the past.In that light, decision makers and scholars require speedy responses to essential queries out of this enquiry. The probable questions include: what form will cotton land use and production assume over time? Does the cotton hub have the capacity to consistently monitor the scale of agrochemical drift into the ecosystem? How will the perceived limitations and other predictors impact land use and output in the region? Can the zone gain from the design of integrated digital regional cotton land use index? Which indicators should be in the system? How will the nation bridge current gaps in the supply of cotton to export markets? In which other form ways will present plans to boost efficiency and the output via GMOs affect the ecosystem? Through these queries, there are ample possibilities to keep the sector focused on innovation given the country’s primacy in cotton land use and production approaches based on wise use of the ecosystem.
References
| [1] | Sudan Cotton Company. (2018 December). Sudan Country Statement the Sudan Cotton company planning and research department. Paper Presented at The 77th Plenary Meeting of The ICAC, Abidjan, Côte d’Ivoire 2-6 December. |
| [2] | Port Sudan Cotton & Trade Co. (2010). Production Sudan Cotton Exports By Variety. Khartoum, Sudan: Port Sudan Warehouses. |
| [3] | Merem, E. C. (2019 March). Analyzing Current Transboundary Water Issues and Hydro Politics of the Horn of Africa Region. Paper Presented At the 93rd Annual Meeting of the Louisiana Academy of Sciences, Baton Rouge: LA. |
| [4] | Elhance, A. (1999). Hydropolitics In the Third World: Conflict and Cooperation in International River Basin. Washington, DC: United States Institute of Peace. pp. 13, 233. |
| [5] | United Nations. (2005). Hydropolitical Vulnerability and Resilience Along International Waters. Nairobi, Kenya: United Nations Environment Pro-gramme, Africa. |
| [6] | Merem, E. C. (2020). Issues In Transboundary Water Use In The River Nile Basin Area of Africa. World Environment. 10:2: 27-44. |
| [7] | Merem, E. C. (2006). Hydropolitics: Case of the Niger River Basin. GIS Development: Africa, 24-28. |
| [8] | Carlson, A. (2013 March). Who Owns The Nile? Egypt, Sudan, and Ethiopia’s History-Changing Dam. Origins: Current Events in Historical Perspective. 38: 6:6. |
| [9] | Okoth-Owiro, A. (2004). The Nile Treaty: State succession and International Treaty Commitments: A Case Study of The Nile Water Treaties/. Nairobi: Kenya, Konrad Adenauer Foundation, Occasional papers. East Africa, ISSN 1681-5890: 9. |
| [10] | Erlich, H. (2002). The Cross and The River: Ethiopia, Egypt, and the Nile. Boulder, CO: Lynn Rienner Publishers. |
| [11] | Index Mundi (2021). Commodity Price Index. Retrieved 2023 March 28th From https://www.indexmundi.com/commodities/. |
| [12] | Index Mundi (2021) Commodity. Retrieved 2023 March 28th From https://www.indexmundi.com/agriculture/?country=sd&commodity=cotton&graph=yield. |
| [13] | Central Bureau of Statistics. (2021). Sudan Agricultural Production: Cotton 1990 – 2017. Khartoum, Sudan: Central Bureau of Statistics. |
| [14] | United States Department of Agriculture (USDA). (2021). Sudan Cotton Production. USDA Foreign Agricultural Service. Washington, DC: USDA. |
| [15] | United States Department of Agriculture (USDA). (2023). Sudan Cotton Area Yield and Production. USDA Foreign Agricultural Service. Washington, DC: USDA. |
| [16] | Merem, E. C. (2023 March a). Assessing The Potentials of Cotton Land Use In Sudan. Paper Presented at the Conference of Minority Public Administrators (COMPA). Baltimore Maryland: MD. March 2- 5, 2023. |
| [17] | Knoema. (2021). The Seed Cotton Production in Sudan. Knoema World Data Atlas. |
| [18] | Mundi Data and USDA. (2022). Agricultural Statistics: Country Sudan Commodity Markets. DC: Washington. United States Department of Agriculture (USDA). |
| [19] | CEIC Data (2021). Sudan Agricultural Production: Yield Cotton. New York. NY. CEIC Data. |
| [20] | UNDP. (2021 Sept). Cotton, Stability, 24,000 Opportunities In Sudan’s White Nile Jobs. New York. NY: United Nations Development Program (UNDP). |
| [21] | Ndubiwa, M. (2019 Dec). Triage Analysis: 80% Reduction in Sudanese Cotton Harvest. Triage Intelligences. |
| [22] | DeLancey, V. (2015). Agriculture,". Sudan: a Country Study. Washington, DC: Library of Congress. |
| [23] | Naglaa, A. (2014 Oct/Dec).Genetically Modified (GM). Crops. Food.5:4: 241–243. |
| [24] | Merem, E.C. (2021). Analyzing the Use of Genetic Modified Organisms (GMOs) in Agriculture in the US Midwest Region, Food and Public Health. 11:1: 1-17. |
| [25] | El- Wakeel. AS. (2014) Agricultural Biotechnology and Biosafety Regulations In Sudan: The Case of Bt Cotton. Agric-biotech-conf: Retrieved 2023 March 28th From http://www.nasaconline.org/dmdocuments/agric-biotech-conf/. |
| [26] | UNEP and Government of Sudan (2005). Sudan National Biosafety Framework, United Nations Environment Programme, the Global Environment Facility (GEF). Retrieved 2023 March 28th From https://www.unep.org/biosafety/files/SDNBFrep.pdf. |
| [27] | Latif. AH. (2012). An Interview and Current Status of Agricultural Biotechnology In Sudan. Southern and Eastern Africa Cotton Forum (SEACF) meeting. Retrieved 2023 March 28th From https://www.icac.org/wp-content/uploads/2012/09/Sudan_Report1.pdf. |
| [28] | International Service For The Acquisition of Agri-Biotech Applications (ISAAA) (2014 November a) Sudanese Farmers Reap Benefits From Bt Cotton. Crop Biotech Update: Metro Manila: Philippines. ISAAA. |
| [29] | International Service For The Acquisition of Agri-Biotech Applications (ISAAA). (2016). Biotech Country Facts and Trends, Sudan, Global Status of Commercialized Biotech/GM Crops: Brief No. 52. Ithaca, NY: ISAAA. |
| [30] | Merem, E. C. (2023 March). Assessing Climate Change Impacts In The US Pacific North WestRegion. Paper Presented at the 97th Annual Louisiana Academy of Science Conference. LSU Alexandria: LA. March 4th, 2023. |
| [31] | Merem, E. C. (2023 March). The Assessment of Climate Change Risks In Maryland’s Southern Region. Paper Presented at the 87th Annual Mississippi Academy of Science Conference. Biloxi, MS. March 23, 2023. |
| [32] | Merem, E.C. (2022). Gauging Cassava Land Use Trends in Nigeria’s Lower South Region. International Journal of Food Science and Nutrition Engineering.12:1: 1-19. |
| [33] | Merem, E.C. (2022). Assessing Issues in Water Resources Use within Countries in West Africa. International Journal of Ecosystem. 12:1: 1-19. |
| [34] | Merem, E.C. (2022). Analyzing Water Resources Management Issues Along the US Midwest Region. Resources and Environment. 12:2: 25-46. |
| [35] | Merem, E.C. (2020). Exploring Cocoa Farm Landuse Trends in The West African Region. International Journal of Agriculture and Forestry. 10:1: 19-39. |
| [36] | Merem, E. C. (2020). Appraising the Changing Trends In Oil Palm Farming in Nigeria’s LowerSouth Region. International Journal of Ecosystem. 10:1: 1-22. |
| [37] | Merem, E. C. (2023 March). Assessing Yam Land Use Trends In Nigeria’s Lower South Region. Paper Presented at 31st Joint Conference of National Association of African American Studies (NAAAS). Arlington, TX. February 16-18, 2023. |
| [38] | Merem, E. C. (2023 March). Assessing The Potentials of Cotton Land Use In Sudan. Paper Presented at the Conference of Minority Public Administrators (COMPA). Baltimore Mary land, MD. March 2- 5, 2023. |
| [39] | Merem, E. C. (2023 March). The Environmental Impacts of Farm Subsidy in California’s South-Central Region. Paper Presented at the 32nd Annual International (West Coast) Conference on Soil, Water, Energy, and Air (AEHS). San Diego, CA. March 20-23, 2023. |
| [40] | Merem, E.C. (2022). Assessing the Environmental Impacts of Farm Subsidy in North Texas Region. International Journal of Agriculture and Forestry. 2022, 12:1: 9-28. |
| [41] | Merem, E.C. (2023b). Assessing the Potentials of Cotton Land Use In Sudan. Draft of Research Manuscript. |
| [42] | Merem, E.C. (2022). The Analysis of Dairy Production and Milk Use in Africa Using GIS. Food and Public Health. 12:1: 14-28. |
| [43] | ]Merem, E. C. (2021). The Regional Assessment of Groundnut Farmland Use in Northern Nigeria, International Journal of Food Science and Nutrition Engineering. 11: 1.1-19. |
| [44] | Merem, E. C. and Twumasi, Y. A. (2020, February). Analyzing the Use of Genetic Modified Organisms GMOs in US Agriculture In the Midwest Region. Presented At The 2020 Mississippi Political Science Conference (MPCC), Jackson, MS. |
| [45] | Merem, E. C. (2021). The Assessment of China’s Scramble for Natural Resources Extraction in Africa, World Environment. 11:1: 9-25. |
| [46] | Unted Nations Food and Agriculture Organization UNFAO (2006). Fertilizer Use By Crop In Sudan. Rome, Italy: UNFAO Statistics Division. |
| [47] | Elfadil, AB. (2021). Sudan Cotton Research and Production Scenarios: Challenges, Achievements and Prospects. Retrieved 2023 March 28th From http://www.nasaconline.org/dmdocuments/agric-biotech-conf/https://staging.icac.org/tis/regional_networks/documents/africa/papers/day_1/sudan.pdf. |


 Abstract
 Reference
 Full-Text PDF
 Full-text HTML


