-
Paper Information
- Paper Submission
-
Journal Information
- About This Journal
- Editorial Board
- Current Issue
- Archive
- Author Guidelines
- Contact Us
International Journal of Agriculture and Forestry
p-ISSN: 2165-882X e-ISSN: 2165-8846
2022; 12(3): 71-78
doi:10.5923/j.ijaf.20221203.02
Received: Jul. 10, 2022; Accepted: Jul. 25, 2022; Published: Oct. 27, 2022

Tree Species Coexistence and Diversity on Elevation Gradient of Elephant Camp Natural Forest, Nigeria
 Abstract
 Reference
 Full-Text PDF
 Full-text HTML
Oladele Fisayo Falade, Taiwo David Babalola
Department of Forest Production and Products, University of Ibadan, Ibadan, Nigeria
Correspondence to: Oladele Fisayo Falade, Department of Forest Production and Products, University of Ibadan, Ibadan, Nigeria.
| Email: |  |
Copyright © 2022 The Author(s). Published by Scientific & Academic Publishing.
This work is licensed under the Creative Commons Attribution International License (CC BY).
http://creativecommons.org/licenses/by/4.0/

Spatial species diversity and size inequality contribute to maintenance of tree species diversity in tropical forests. Coexistence of tree species requires interactions within and between spatial species and size diversity. However, elevation gradient has significant impact on growth and species interactions. Failure of most conservation efforts is due to inability to identify and maintain coexistence mechanisms existing in the forest. Understanding the contribution of elevation gradient to coexistence of tree species will improve conservation efforts and terrestrial carbon budgeting. Therefore, association between tree diversity and size inequality on elevation gradient of Elephant Camp Natural Forest was investigated. Eight (30m x 30m) plots were systematically demarcated on 1km line transects in each identified elevation (Hilltop and Valley-Bottom stands). Trees diameter-at-breast height (dbh) were enumerated and identified to species level. Tree dbh was measured and density estimated. Tree species diversity (Shannon-Weiner, Simpson and Margalef indices) and size inequality (Gini coefficient, skewness and Coefficient of variation) were computed. Stem volume and biomass were computed and converted to biomass carbon. Data collected were analysed using descriptive, correlation analysis and principal component analysis. Tree density varied from 435/ha to 767/ha. There was positive correlation between Skewness and Gini coefficient in Hilltop stand and negative correlation between Skewness and Simpson index in Valley-Bottom stand. The measures of tree size inequality and species diversity were strongly associated with each other in Valley-Bottom stand and not in Hilltop stand. Structural diversity and species diversity determined the competitive interaction among tree communities in Hilltop and Valley-Bottom stands, respectively.
Keywords: Tree size inequality, Tree species diversity, Elevation gradient, Diameter distribution
Cite this paper: Oladele Fisayo Falade, Taiwo David Babalola, Tree Species Coexistence and Diversity on Elevation Gradient of Elephant Camp Natural Forest, Nigeria, International Journal of Agriculture and Forestry, Vol. 12 No. 3, 2022, pp. 71-78. doi: 10.5923/j.ijaf.20221203.02.
Article Outline
1. Introduction
- Species of plant grow and survive in a limited range of environment (Sharma et al., 2020). This indicates that presence of most tree communities is site-specific and largely depends on various characteristics of the sites. However, elevation controls many site characteristics. Therefore, change in elevation can lead to significant change in numerous environmental factors (Mao et al., 2015). Tree growth rate differs at different elevations due to change in characteristics of soil properties and climate (Mensah et al., 2018; Sharma et al., 2020). For example, water availability and soil nutrient may be limiting for tree growth in the upland compare to low elevation positions (Lopez et al., 2021). Also, plants response to environmental variables may vary during their life time since they are dynamic systems (Uria-Diez et al., 2014). Tree of different sizes may respond differently to environmental stresses (Rathgeber et al., 2011). For example, Wichmann (2001) noted that increased water availability benefits large trees more than small trees. De Luis et al. (2009) reported that tree sizes were more sensitive to environmental variables than tree species and Pommerening et al. (2021) reported that size diversity is caused by species mingling. Pattern of interaction of trees of different species and sizes indicates species mingling. Therefore, correlations between spatial species and size inequality are used to identify coexistence mechanisms of tree species diversity existing in a forest (Wang et al., 2021a; Pommerening et al., 2021). The existence of these correlations is crucial to conservation practices because they provide information on spatial structure of forest stand. However, the extent of the contribution of elevation gradient to mingling and consequently, coexistence of tree species alpha diversity is difficult to clarify. Moreover, failure of many conservation efforts on biodiversity is due to inability of foresters to identify and maintain functional coexistence mechanisms existing among tree species in the forest. Traditional diversity indices are no longer sufficient for measurement of conservation success (Graz, 2004). The value of conservation efforts is directly linked to maintenance of high diversity of species and spatial structure within the forest (Graz, 2004). Change in spatial structure may be observed on elevation gradient due to ecological and environmental differences. Hence, understanding the effect of elevation gradient on forest spatial structure can be used to improve tree species conservation efforts and climate change mitigation. Moreover, trees store large amount of carbon in the stem biomass. Tree species and size differ in the carbon storage capacity. Tree species and size control major ecosystem functions and services, respectively. Therefore, species diversity and size inequality can improve carbon storage capacity of a forest. Structural diversity of forest is required for better understanding of natural mechanisms that can be used to maintain coexistence tree species diversity so as to prevent loss of biodiversity and this is significant for climate change mitigation (Wang et al., 2020). Also, identification of natural processes that cause association of spatial species and size diversity is crucial for conservation efforts decisions. Therefore, species diversity and/or size inequality could be a focus of conservation efforts (Pommerening et al., 2021). (Keren et al., 2020) reiterated that it is important to understand the mechanisms regulating the interaction of tree of different species and sizes. Moreover, conservation of Elephant Camp Natural Forest (ECNF) has become a priority for the survival of the remaining herds of Forest Elephant in Nigeria and West African because ECNF is a unique corridor to other forest reserves and also, habitat that harbour some of the rare African Forest Elephants. ECNF is managed by African Forest Elephant Project initiative in Africa based in Nigeria. Therefore, conservation of forest structure of ECNF is important and critical. Therefore, this study quantified the association of tree species and size diversity in high and low elevation positions in Elephant Camp Natural Forest, Nigeria.
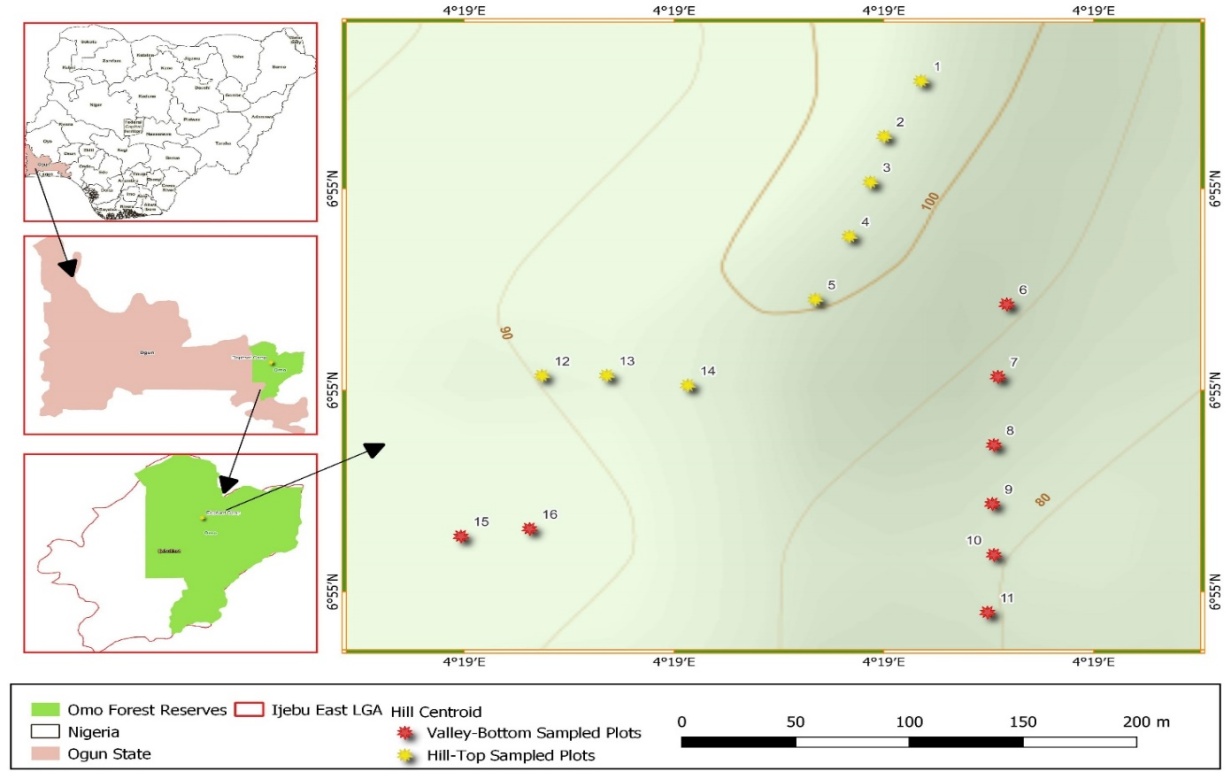 | Figure 1. The spatial map of Elephant Camp Natural Forest in Omo Forest Reserve, Nigeria |
2. Materials and Methods
- The study was carried out in Elephant Camp Natural Forest in Omo Forest Reserve. The Omo Forest Reserve is located on Latitude 06.51.00 to 06.91.00 N and Longitude 04.22.48 to 04.32.48E at an altitude of 150m above sea level (asl) in Ijebu area of Ogun State in Southwestern, Nigeria (Ojo, 2004). Elephant Camp Natural Forest covers approximately 55,000ha. The soil is on basement complex with gneisses quartzitic rock and disintegrated to ferruginous brown soil with gravel content of approximately 40%. The study area was purposively located on Hillslope (elevation range; 500-4800 m asl) of Elephant Camp Natural Forest. Therefore, Hillslope was divided into two elevation belts (Hilltop forest and Valley-Bottom forest). The average above sea level is about m while the soil is typical with a gravel content of approximately 40%. The vegetation is natural secondary forest. There is large elevation gradient and slopy topography. Elevations of the plots of Hilltop stand are between 1250 and 3315m asl and Valley-Bottom stand are between 700 and 1050 asl..The hillslope occurs at eastern part of Elephant Camp Natural Forest, with elevation range of 500-4800 m asl, was divided into two elevation belts (Hilltop stand and Valley-Bottom stand). A total of sixteen 900m2 square plots were used for the study. Eight (900m2) plots were demarcated systematically on line transects of 350 m long at the middle of each elevation. It was impossible for eight plots to be on one transect due to irregular land formation. Therefore, each elevation position has two line transects.. Trees with ≥5cm diameter-at-breast height (dbh) and ≥1.3m height were enumerated and identified to species level on the field and when in doubt, specimen of tree species were collected and pressed for further authentication by comparing them with herbarium voucher specimens deposited in the Forestry Research Institute of Nigeria (FRIN) herbarium. The dbh and total height of all trees within each plot were measured. Stem volume and biomass were computed and converted to biomass carbon. The stem volume of individual stem was computed per plot in both upland and low elevation positions. The volume of individual stem obtained was multiplied with individual species wood density and converted to stem biomass per hectare. According to Bhatta et al. (2018), stem carbon is approximately 47% of the tree stem biomass.
3. Data Analysis
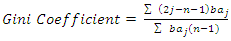
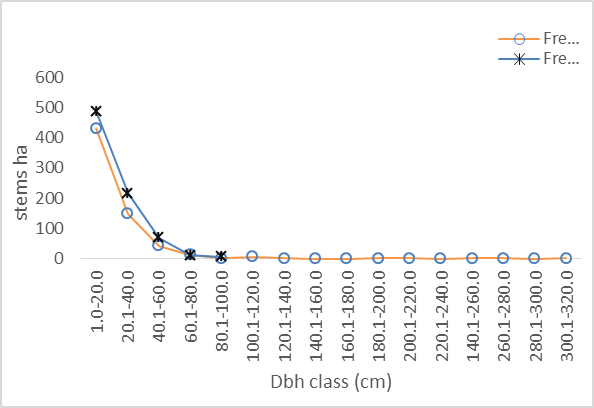
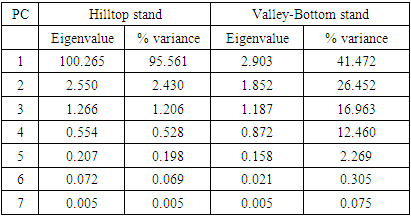
- Size-density distribution of 10.0 cm dbh classes was generated for Hilltop and Valley-Bottom stands and compared. Skewness coefficient, Coefficient of variation and Gini coefficient were used to quantify tree size inequality based on dbh (Weiner and Thomas, 1986; Weiner and Solbrig, 1984; Bendel et al., 1989) while Shannon-Weiner, Simpson, Margalef and species richness were used to quantify tree species diversity (Heip and Engel, 1974).Species richness is refers to the number of different tree species encounter in each plot (Magurran, 1988; Heip and Engel, 1974). The relationship between tree size inequality measures and tree species diversity indices was determined using Spearman correlation analysis. Principal Component Analysis was used to explain the variation in the ecosystem services and the species diversityand size inequality of upland and low elevation position. The input data for the analysis were a total total of 8 parameters include; stem biomass carbon, Richness, Simpson, Shannon, Margalef, Evenness, Mean dbh and Gini-dbh.Shannon-Weiner, Simpson and Margalef indices and species richness were used for assessment of species diversity in Hilltop and Valley-Bottom stands (Magurran, 1988).Shannon-Weiner index of species diversity is expressed as:
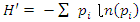 | (1) |
 = Proportion (n/N) of individuals of one particular species found (n) divided by the total number of individuals found (N),
  = natural logarithmSimpson index of tree species diversity (I-D)
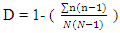 | (2) |
 | (3) |
 = natural logarithm Species Evenness (E)
 | (4) |
 | (5) |
 | (6) |
 | (7) |
4. Results
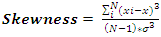
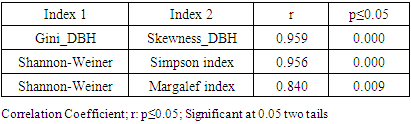
- The mean dbh of Hilltop stand (21.39 cm dbh) was significantly different from mean dbh of Valley_Bottom stand (24.35cm dbh) at 0.05 level (p≥0.038). The dbh distribution of Hilltop and Valley-Bottom stands ranged from 4.50 to 97.00 cm dbh and 6.00 to 319.00 cm dbh, respectively. Inequality measures (Gini-coefficient, Skewness and Coefficient of Variation) of tree diameter of Valley-Bottom stand were higher than Hilltop stand (Table 1).
|
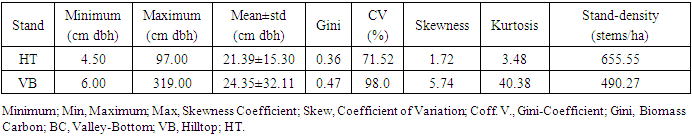
 | Figure 2. Diameter distribution of Hilltop and Valley-Bottom of Elephant-Camp Natural Forest |
|
|
|
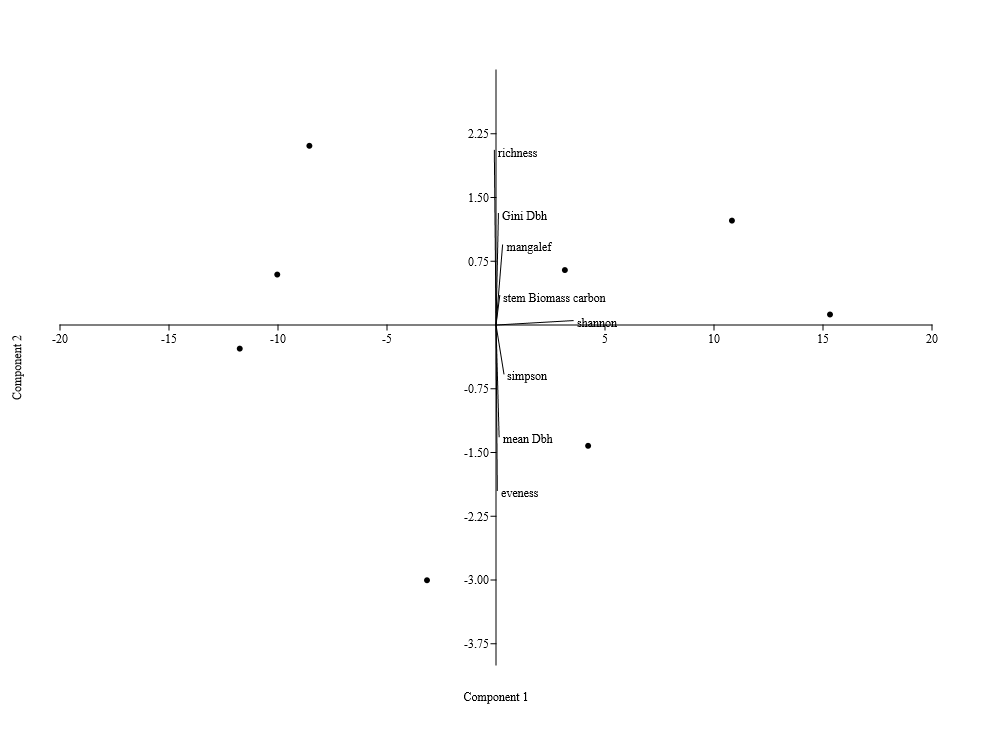 | Figure 3a. Principal component analysis of species in the Hilltop of Elephant Camp Natural Forest |
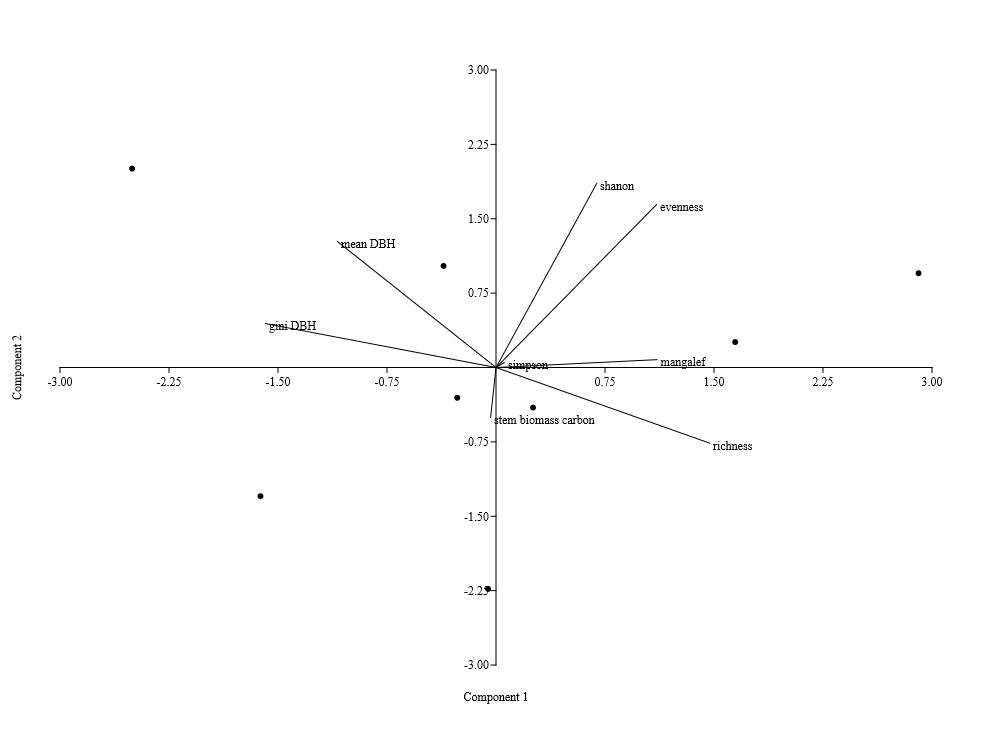 | Figure 3b. Principal component analysis of species in the Valley-Bottom of Elephant Camp Natural Forest |
|
5. Discussion
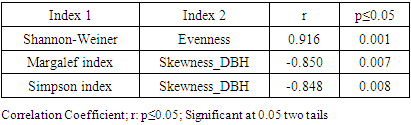
- There was similarity between tree size-density distribution of Hilltop and Valley-Bottom stands. The size-density distribution was positively skewed with many small and intermediate sized tree stems and a few very large stem size. This represented good reproductive success and regeneration for the two stands. The inequality based on dbh (Gini-coefficient, Skewness and Coefficient of Variation) of Valley-Bottom stand were higher than Hilltop stand. Metsaranta and Lieffers (2008) stated that high inequality in size may be due to large numbers of trees with low growth rate or due to small numbers of trees with high growth rate at sites with sporadic supply of specific plant growth resource. In the case of Valley-Bottom of Elephant Camp Natural Forest, there is seasonal flooding and supply of water through the tributaries of Omo river. Mohler et al. (1978) and Turner and Rabinowitz (1983) reiterated that high skewness of diameter distribution of stand is due to exponential growth rate of individual stems and may not be due to dominance and suppression of individual stems. This suggests asymmetric in the absence of competition. Hence, expression of high size inequality of Valley-Bottom stand may not be due to competition because of its stand stem density compared to Hilltop stand. Stem size distribution may become asymmetric in the absence of competition due to variance in exponential growth rates of individual stems. Therefore, change in elevation has cause changes in the forest structure of Elephant Camp Natural Forest. Structural diversity of tree size contributes to ecosystem services.Strong positive correlations between Gini and Skewness Coefficients was more pronounced in Hilltop stand and it indicate size variability among tree communities. High size inequality among neighbouring trees of the same or different species contributed to the mechanisms regulating coexistence of trees in Hilltop stand (Keren et al., 2020). High tree size inequality predicts high proportion of specific stem sizes. Microsite variability caused size variability. Also, positive correlation between tree species diversity indices was more pronounced in Hilltop stand. The Shannon-Weinner index emphasize evenness and richness of tree species while Simpson index emphasize abundance and richness of tree species (Young et al., 2011). Margalef index emphasize richness of tree species. Species mingling is when large tree is surrounded by different tree species (Wang et al., 2021a) Therefore, relationship between Shannon-Weinner and Margalef indices in Hilltop stand indicated that the species mingling was basically regular among different tree species but sizes do not differ. Wang et al. (2021a) stated that different species-size correlation patterns could be observed in a forest ecosystem. However, the dominant correlation will determine the functional mechanism. This indicated that quantification of forest structure require species identity. Apart from species enrichment, manipulating of tree sizes could be a practical tool for increasing biodiversity in Hilltop stand (Lian et al., 2007). This confirmed the study of Young et al. (2011) that increase in structural diversity is associated with increase in the species diversity.Strong negative correlations between size inequality and spatial species diversity in Valley-Bottom stand suggested high size diversity within the same species (Wang et al., 2021a). This effect is also associated with low stem inequality in plots of higher tree species diversity. This could be a consequence of high mortality in the tree communities with high size inequality. According to Magurran (1988), effect of low recruitment could lead to high tree species diversity and high tree species evenness in forest stand. Conversely, positive relationship between species diversity and evenness indices indicated that tree species mingling component were more regularly distributed in Valley-Bottom. According to Magurran, (1988), Shannon-Weinner index reflects both richness and evenness of tree species. Wang et al. (2021a) reported that high species mingling is more likely to be associated with large trees. Shannon-Weiner index of species diversity was strongly associated with tree species evenness in Valley-Bottom stand. Also, relationship between skewness-coefficient and Margalef and Simpson indices were moderately strong and negative in Valley-Bottom stand. Therefore, Margalef and Simpson indices were negative predictors of Skewness coefficient in Valley-Bottom stand. Tree size inequality was strongly associated with regular distribution of individual tree species in Valley-Bottom stand. Skewness is basically determined by the proportion of stem in the diameter classes while Simpson index emphasize abundance and richness of tree species (Young et al., 2011). This effect was associated with low stem inequality in plots of higher tree species diversity. The measures of size inequality and tree species diversity were significantly and negatively associated with each other in Valley-Bottom stand (Keren et al., 2020). Simpson and Skewness were significantly negatively correlated only in Valley-Bottom stand. Margalef and Skewness were significantly negatively correlated only in Valley-Bottom stand. The measures of tree size inequality and species diversity were strongly negative related with each other in Valley-Bottom stand. Therefore, the increase of structural diversity is associated with an increase in species diversity (Young et al., 2011).Tree species richness could be used as an indicator of tree biomass in Hilltop and Valley-bottom stands of Elephant Camp Natural Forest.
6. Conclusions
- Asymmetric distribution in the absence of competition indicated that elevation gradient is the major controlling factor of forest structure in Elephant Camp Natural Forest. Microsite variability may enhanced high tree species diversity and size inequality in Valley-Bottom stand. Variability in the significance and sign of the coefficient of the associated variables indicated that the relationships between predictors were site-specific. Spatial pattern of tree size and species diversity determined the structure of tree communities in Hilltop stand while size diversity determined structure of Hilltop stand. Overall, high size inequality among neighbouring trees of the same or different species determined the mechanisms regulating coexistence of trees in Hilltop stand while high size diversity within the same species determine determined the mechanisms regulating coexistence of trees in Valley-Bottom stand. These relationships were site-specific and the basis for the natural mechanisms for maintaining of plant diversity in forest ecosystem. Understanding the mechanisms necessary to maintain high species diversity under climate change condition is a major challenge of the present time.