E. C. Merem1, Y. Twumasi2, J. Wesley1, D. Olagbegi1, M. Crisler1, C. Romorno1, M. Alsarari1, P. Isokpehi1, A. Hines3, G. Hirse3, G. S. Ochai4, E. Nwagboso5, S. Fageir6, S. Leggett7, J. Offiah1, S. Emakpor8
1Department of Urban and Regional Planning, Jackson State University, 101 Capitol Center, Jackson, MS, USA
2Department of Urban Forestry and Natural Resources, Southern University, Baton Rouge, LA, USA
3Department of Public Policy and Administration, Jackson State University, 101 Capitol Center, Jackson, MS, USA
4African Development Bank, AfDB, 101 BP 1387 Avenue Joseph Anoma, Abidjan, AB, Ivory Coast
5Department of Political Science, Jackson State University, 1400 John R. Lynch Street, Jackson, MS, USA
6Department of Criminal Justice and Sociology, Jackson State University, 1400 John R. Lynch Street, Jackson, MS, USA
7Department of Behavioral and Environmental Health, Jackson State University, 350 Woodrow Wilson, Jackson, MS, USA
8Department of Environmental Science, Jackson State University, 1400 John R. Lynch Street, Jackson, MS, USA
Correspondence to: E. C. Merem, Department of Urban and Regional Planning, Jackson State University, 101 Capitol Center, Jackson, MS, USA.
| Email: |  |
Copyright © 2022 The Author(s). Published by Scientific & Academic Publishing.
This work is licensed under the Creative Commons Attribution International License (CC BY).
http://creativecommons.org/licenses/by/4.0/

Abstract
The access to agricultural subsidies optimizes the daily operations of farms in North Texas. Being an essential policy instrument for ensuring the success of government-supported agricultural program objectives among targeted groups. Over the years, the disbursement of federal agricultural assisted programs continues to flourish with the intent of boosting capacity of supposedly needy farms. While much of the aids serve ample uses in sustaining solely farms involved in a few select commodities (cotton, wheat, corn, sorghum, peanuts), together with natural disaster payments and conservation reserve programs. There is little or no consideration for fruits, vegetables, and dairy products essential for healthy living as bigger farms benefit more. Added to that are the rising use of farm nutrients made up of various volumes of pesticides and agrochemicals to boost output despite the rising risks to marshlands and the surrounding ecosystems in North Texas and subsidy induced ground water depletion along the major Aquifer. Notwithstanding the recurrent ecological implications of subsidy disbursement in the agricultural sector, very little study exists on the environmental footprints in the North Texas region under mix-scale orientation using the latest geospatial tools as analytical devices. This research will fill that void by assessing the environmental impacts of agricultural subsidy in the study area with emphasis on the issues, trends, impacts and the underlying factors. Using secondary data processed by mix scale methods of descriptive statistics connected to Geographic information Systems (GIS). The results reveal large subsidy allotment from 1995-2020 for commodities, disaster mitigation and conservation coupled with land use change, loss of farms amidst rising fertilizer use and ecosystem impacts. While GIS mappings show spatial dispersion of the trends over time with visible concentration in the ten counties, the emergent issues stem partly from several socio-economic, ecological, policy and global forces located within the larger agricultural structure. To address these concerns, the paper offered solutions ranging from the need for coherent policy, education, the design of a regional farm subsidy and environmental information system and ecological monitoring.
Keywords:
Agricultural subsidy, Impacts, Region, GIS, North Texas
Cite this paper: E. C. Merem, Y. Twumasi, J. Wesley, D. Olagbegi, M. Crisler, C. Romorno, M. Alsarari, P. Isokpehi, A. Hines, G. Hirse, G. S. Ochai, E. Nwagboso, S. Fageir, S. Leggett, J. Offiah, S. Emakpor, Assessing the Environmental Impacts of Farm Subsidy in North Texas Region, International Journal of Agriculture and Forestry, Vol. 12 No. 1, 2022, pp. 9-28. doi: 10.5923/j.ijaf.20221201.02.
1. Introduction
Agricultural aid as disbursements and various types of assistance, offered through the government of the US to needy planters and farming industry continues to find widespread appeal and acceptance [1]. Just as many individuals view such assistance as essential to the US Market economy, some see subsidies like a commercial benefit [2]. The subsidies are vital in minimizing the dangers farmers encounter by disruptions caused by climatic parameters like droughts, tornadoes, and hurricanes, market induced uncertainty and stagnations [3]. At the same time, the intervention of central government does have a place in guaranteeing farm output during fiscal downturns, and other monetary crunches [4]. Realizing the essence of agricultural production in the country’s wellbeing and food security compared to competing sectors. The US authorities have far long pointed out as to how farm aid creates safety net for growers [5]. The belief stems from the capacity of farm aid in sparing the nation of unnecessary dependence on imports. This is regardless of the specialized nature of agricultural space in most rural areas and the other actors from banks to insurance linked with subsidy [6]. Since policymakers started enacting fresh laws, different interest groups of all ideological stripes are rightfully questioning the total sum of money earmarked for agricultural aid and the intended beneficiaries with legitimate intensions [7-10]. Out of the $222.8 billion allotted to subsidy expenditures between 1995 through to 2010, about 74% of that ended in the hands of merely 10% of the farm sector beneficiaries across the country amidst demands for robust assistance for local growers and organic farmers [11]. With Texas among the top recipients over time in subsidy allocation, there are major concerns on the effects of decisions shaping the programs. Surely, within Texas as a whole, all through 1995 to 2010, the leading 10% of money-making agricultural operations brought in annual median amount of $40,600 individually in aids, whereas the lowest 80% got $649 [11]. In that way, the access to agricultural subsidy optimizes the needs of barely just a few of those involved in the daily operations of agricultural farms across different parts of the Northern region of Texas [12]. Yet, this is supposed to be an essential tool meant to ensure the success of government supported agricultural program objectives among targeted groups [13].Over the past fiscal years, the disbursement of federal agricultural assisted programs on paper continues to soar with the intent of boosting the output and capacity of those farms deemed to need such aids [13]. The frequency and scale of these financial aids are often devoted to better uses in sustaining farming activities and operational capacity [14]. This involves the planting of cotton, wheat, disaster payments, conservation reserve payments, corn, rice, environmental quality incentives program and others predicated on the size and needs of the farm operations [15]. Given the extent of funding for the top five produces most notably wheat, cotton, soybeans, corn, and rice known for their connection to diabetes and heart problems. The exclusion of fruit, vegetable, livestock, and poultry farms responsible for 2/3 of market activities from government assistance raises eyebrows on the efficacy of such policy decisions across the nation, considering the potentials for both environmental, health and economic vulnerabilities [16-25]. With that also came the rising use of farm nutrients made up of various volumes of pesticides and agrochemicals to boost output amidst the rising risks to marshlands and the surrounding ecosystems in North Texas [26]. Unsurprisingly, amidst the widespread applications of nutrients like nitrogen and phosphorus pesticides, encompassing herbicides, insecticides, and fungicides due to subsidies. Farming pollutants can degrade both exterior and subterrain water quality. It so happens that as fertilizers and pesticides are less motionless when sprayed on farm fields; overflows during storms, move the toxics onto adjoining lakes, rivers, and groundwater. Although, the transformation of landscapes to farm cultivation results in better yields and output. Frequently such changes leave in their wake unplanned ecological effects on the headwaters and natural habitats in terms of risks to quality and volume of marine assets. Considering that farming is hugely implicated in the contamination of major lakes and rivers nationwide [27,28]. Around 500,000 tons-12 million, to 4 million tons of pesticides, nitrogen, and phosphorus fertilizer are spread yearly throughout the US. Despite the anticipated risks posed by global warming and the triple digit temperature expected to magnify in 2050 [29-35]. The incidence of aridity is accelerating large scale extraction of ground water along the Ogallala Aquifer in the study area among farmers at a much intense pace [36]. With the current level of ground water pumping near the aquifer fuelled partly by pressures from subsidized farming activities involving cultivation of water thirsty crops from irrigated corn to cotton often covered under immediate disbursements [37,38]. As some of the corns are often used as cattle feeds and the production of ethanol biofuel, the High Plains ecozone has seen the proliferation of ethanol refining plants. While this amounts to the removal of more than 120 billion gallons of water annually out of the Ogallala Aquifer, ecosystem fragmentations have led to the change of grasslands and wetlands for row crops, loss of natural areas and unforeseen impacts resulting in the use of chemicals and pollution [39-40].Notwithstanding the recurrent ecological implications of subsidy disbursement in the agricultural sector, very little exists on the environmental externalities of farm assistance in the North Texas region under a mix-scale model using the latest geospatial tools as analytical devices [41-44]. Accordingly, this enquiry will fill that void by assessing the environmental impacts of farm subsidy in the study area with emphasis on issues, trends, impacts, and factors influencing the continual disbursement of federal funds to farms through assisted schemes. Since no efforts have been made to track the trends with a mix-scale model. This enquiry as mentioned earlier will also evaluate the situation further by identifying the current efforts, while utilizing descriptive statistics and GIS as well as secondary data sources [45-48]. The paper has five objectives and sections. Amongst the five sections in the paper, parts one to three contains the introduction, methods, and results along with the factors, impacts, and the initiatives. Sections four and five offer highlights of the discussions and conclusions. Accordingly, the initial two objectives cover the current issues in government subsidy disbursement and the trends. The third and fourth aims, assesses the impacts and the risks involved. The final and fifth objective is to design a decision support device for decision makers.
2. Methods and Materials
The study area in Figure 1 stretches through 10,469.65 square miles in 10 counties located in the low and high plans area of North Texas [49]. Known for the grasslands therein, the area contains reasonably high and equal plateau of sandy to thick, dark calcareous clay soils over an impermeable layer of caliche [50]. Even though just only 3 counties saw some increments, between 2010-2019, the population (Table 1) rose from 415,180 to 443,239 at a rate of +6.75%. [51]. With the region’s high propensity towards intense farming and heavy government subsidy [52], the farming soils therein are responsible for the production of a diversity of crops encompassing cotton, corn, wheat, peanuts, and sorghum [53]. Given its vast ecological features of wildlife habitats and adjacent streams, and aquifers [54], the adjoining watersheds [55], are prone to high sediments and chemicals from deeply supported farm fields amidst the growing deficits in the major aquifer [56]. With corn among the most water-thirsty crops cultivated in the zone, requiring at least almost 2 feet 20 inches in irrigation water in warmer areas of Texas [57]. In such semi-arid zone of the nation along Ogallala, the area represents the largest contiguous land mass set aside for farm production. Besides, the sun intensity and windy nature in the region does affect soils capacity to retain limited water droplets from rain. As a result, much of the subsidized farming operations presently rely on irrigation powered by the Ogallala aquifer, but it continues to decline. Being an area in the Plains where ground water and farm commodity programs took out 74% of more subterrain water than the others. The particularly lower recharge rates on the Ogallala Aquifer as sign of exhaustion remains unavoidable [58-61]. This has forced decision makers panicking in their search of alternatives modes to extend its continuity and water access.Table 1. Study Area Population and Land Area
 |
| |
|
 | Figure 1. The Study Area North Texas Region |
Despite the rising pace of subsidy allocation to the planters and changes associated with large farm systems, unforeseen ecological risks through subsidy dependent farm activities in the North Texas plain region remain unabated [62]. In the region, about 19 significant headwaters all through the years endured various kinds of degradation triggered by contamination hazards. This stems from the chemical sprayings to ensure higher yields, coupled with fertilizer and insecticides flows, high chemical loads and sediments oozing across the cultivated landscapes. The extent and form of these risks were worsened by the actual volume of agricultural land declines, losses in the number of farms, and the obsessions with and high use of chemicals. Other reasons include the ongoing threats posed to the fragile ecosystem via major aquifer depletion and water resources stress. The belief is that a GIS based assessment connected to mix scale model will usher in the ingredients for researching subsidy disbursement in the North plains of Texas [63-66].
2.1. Methods Used
The paper uses a mix scale temporal-spatial data approach involving descriptive statistics, agricultural census information and primary data connected to geographic Information Systems (GIS) to display the trends spatially. The spatial information for the research was obtained from the United States Department of Agriculture (USDA), the United States Environmental Protection Agency (EPA), The United States Geological Survey (USGS), as well as state agencies like The Texas Department of Environmental Quality (TDEQ). Other sources include non-governmental organizations such as the Environmental Working Group (EWG), farm groups and the US Census Bureau. All in all, the agricultural census data, subsidy information, the subsidy money and county rankings came from the USDA’ National Agricultural Statistics Service (NASS) for the periods of 1997-2017, while the Texas Department of Environmental Quality (TDEQ) office of pollution control provided state and county wide information on watershed impairment and pollution on the North Texas region for 2003-2010. In the process, federal geographic identifier codes of the state were used to geo-code available information and the socio-economic and environmental variables contained in the data sets. This information was analyzed with basic descriptive statistics, and GIS with particular attention to the temporal-spatial trends at the state and regional level. As mentioned earlier, this was made possible by the retrieval of spatial data sets of shape and grid files from the Texas Spatial Reference Center (TSRC), Texas Natural Resources Information System, The Texas Geographic Information Office and the Texas Spatial Accomplishment Registry System in digital form using ARCVIEW GIS. Part of the spatial data also came from land-use capability and classification maps for the study area. The statistical output of the variables from the spatial units were mapped and compared across time in ARCVIEW GIS. The relevant procedures consist of two stages.
2.2. Stage 1: Identification of Variables, Data Gathering and Study Design
The initial step in this research involved the identification of variables required to examine changes at the county level from 1995 to 2020. The variables consist of socio-economic and environmental information, including size of agricultural land in acres, the number of farms, the size of farmland treated with insecticides, the combined regional value of agricultural land, the size of farmland treated with fertilizer and chemicals, population size, population percentage of change and the total amounts of subsidy payments to farms. Added to that are the size of cropland, the size of irrigated farmland, number of farms with fertilizer, subsidy types, the number of subsidy recipients, study area size, the percent of subsidy type, the percent of subsidy amount, the dollar value of allotted subsidy, the rankings of county and the percentage of change. These variables as mentioned earlier were derived from primary sources made up of government documents, newsletters, and other documents from NGOs. This process was followed by the design of data matrices for socio-economic and land use (environmental) variables covering the census periods from 1997, 2007 to 2012 to 2017and 2019. The design of spatial data for the GIS analysis required the delineation of county boundary lines within the study area as well. Given that the official boundary lines between the 10 counties remained the same, a common geographic identifier code was assigned to each of the area units for analytical coherency.
2.3. Stage 2: Step 2: Data Analysis and GIS Mapping
In the second stage, descriptive statistics and spatial analysis were applied to transform the original socio-economic and land-use data into relative measures (percentages, ratios, and rates). This process generated the parameters for establishing, the extent of environmental change induced by farm subsidy and the trends across the region for each of the 10 counties through measurement and comparisons overtime. While the spatial units of analysis consist of counties, watersheds, region and the boundary and locations where subsidy blossomed. This approach allows for the detection of change, while the graphics highlight the agricultural landscape impacts, land-loss, and subsidy trends. The remaining steps involves spatial analysis and output (maps-tables-text) covering the study period, using ARCVIEW11. With spatial units of analysis covered in 10 counties (Figure 1), the study area map indicates boundary limits of the units and their geographic locations. The outputs for each county were not only mapped and compared across time, but the geographic data for the units which covered boundaries, also includes ecological data of land cover files and paper and digital maps from 1997-2017. This process helped show the spatial evolution of subsidy trends, the ensuing environmental impacts, ecological degradation as well as changes in other variables and factors driving subsidy proliferation and impacts in the study area.
3. The Results
This section of the paper describes the results of the data and environmental analysis of farm subsidy in the study area. Part of the research focus centres on temporal and spatial analysis of subsidy trends in the study area. Accordingly, using descriptive statistics there is an initial emphasis on the extent and nature of farm assistance and the trends amongst the 10 counties at the regional and state scales. This is followed by a temporal analysis of farmland use, percentage of change, environmental impact assessment mainly on the present state, subsidy indices and comparative assessment. Added to that are spatial analysis of GIS and the factors driving the surge in subsidy use along the North Texas High Plains region and the efforts.
3.1. The Analysis of Subsidy Trends in the Region
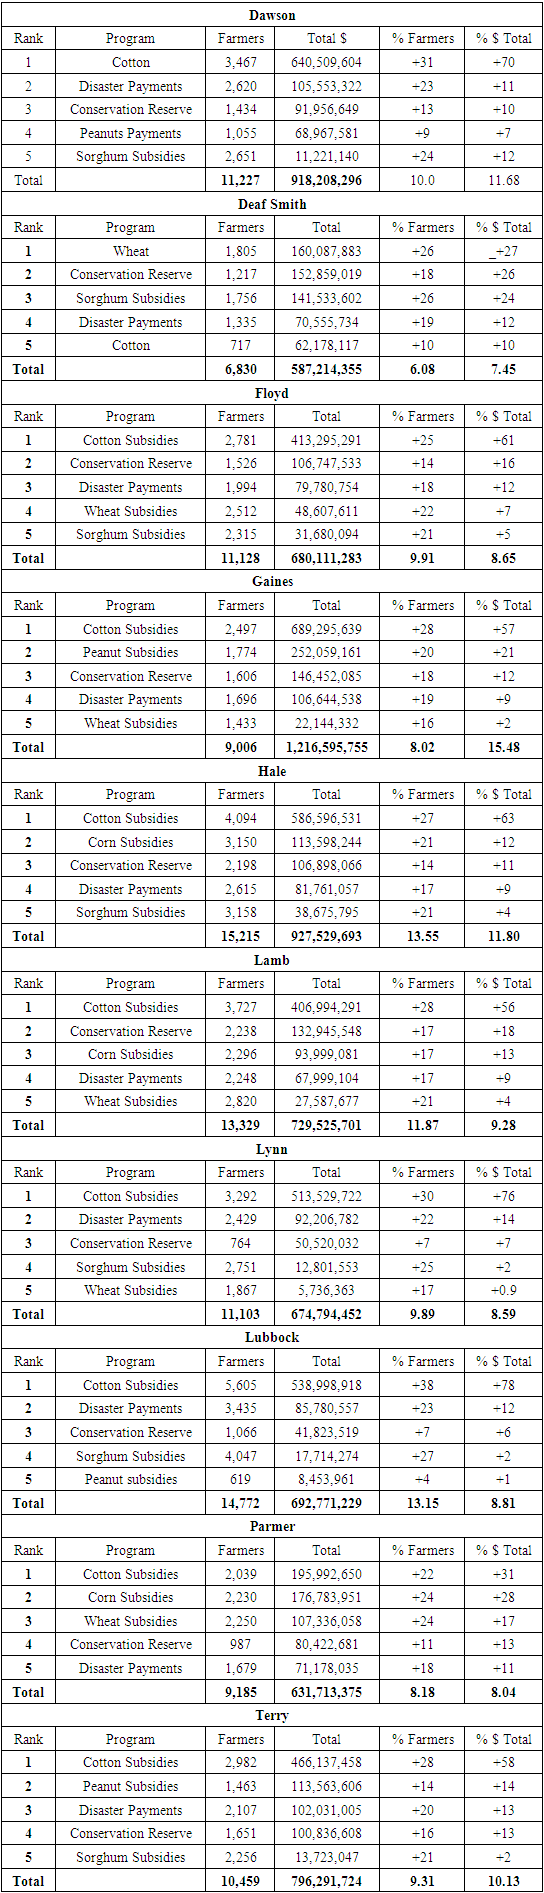
As from 1995 through 2020, the North Texas High plains region brought in $7.85 ($7,854,755,863) billion at an average of more than $785 million in subsidies. The expended cash at the time focused mostly on commodities (that were primarily cotton, peanuts, sorghum, wheat, and corn) and others on the ecology comprising of conservation and disaster payments for mitigating natural hazards. Under the overall $7.8 billion in aid for the zone by 1995 to 2020, Gaines County, Dowson and Hale held the top spots as the largest beneficiary of government subsidy estimated at $1.2 billion to $900 million plus. The additional targets for sizeable subsidy amounting to over $600 million-$700 million dollars encompasses the counties of Floyd, Lynn, Lubbock, Parmer, Lamb, and Terry. During the exact fiscal years under analysis, Deaf Smith County also obtained half a billion dollars through government assisted farm aid payout as well (Table 2). Table 2. Subsidy Summary For Recipients In North Texas Counties, 1995-2020
 |
| |
|
From the highlights of the aid payout in the study area, farm commodity which held firm at 60% or 3 of 5 in listed items on the metrics exceeded the other programs by far bigger margins in terms of dollar values in the half billion category or above together with conservation and disaster payments. This is evident considering the high proportion of these indicators in the respective counties. Further look on the tabular display shows the total percentage rates of key farm produces under subsidy, surpassed the 80% mark in 4 of 10 counties (Dawson, Deaf Smith, Gaines, and Lubbock). In a similar order, relatively high percentage levels of 73-79 and 78, to 76-75 total amounts in subsidy distributions surfaced in half a dozen counties made up of Floyd, Hale, Lamb, Lynn, Parmer and Terry.Among the second group of variables, both conservation and disaster payments still held their own despite the strong rallies of commodities in the percentage distribution of overall farm aid money. The two ecological rehabilitation parameters accounted for mostly low single and medium double digits rates in farm aid between 1995-2020 throughout the entire 10 counties under analysis. In a quartet of counties including Dawson, Def Smith, Floyd, and Hale, both crop insurance and conservation posted mostly modest values of low double digits at 11-10%, 26-12% and 16-12%-11-9% as their share of allotted portions of the government farm assistance. Along these lines, the same ecological subsidy programs of conservation and natural disaster assistance still reached a mix of single and soft double-digit rates (7-14% to 12-6%) at Lynn and Lubbock as Terry and Parmer finished at 13-10% a piece in total farm aid over time (Table 2). The other components of the agricultural subsidy index in the North Texas region during the periods 1995 to 2020 as shown, are characterized by the individual rankings of the actual farm aid schemes at the disposal of planters. The others are the number of recipients, overall dollar values and the ratios as set aside for agriculturalists in the zone. With about $7,854,755,863 billion dollars in subsidy money set aside for 112,254 eligible recipients in the ten counties under various programs. The program extends to a quintet of items made up of cotton, wheat, sorghum, corn and peanuts, disaster payments and conservation that have been prominent on the farm space of Texas high plains. Of the subsidy programs available in the zone, from the tabular display, cotton stands alone in a prime spot far ahead of others. The crop emerged the most popular subsidy item considering the frequency in classification in 9 of 10 counties except for Deaf Smith County where cotton ranked last when wheat and conservation took the number 1 and 2 spots respectively in classification. Notwithstanding all that, cotton still surpassed all subsidized programs across the counties when it comes to the number of farmers listed and the distributed monetary values dollar amounts while closely shadowed by sorghum, and wheat in 7-6 counties correspondingly, and peanut and corn at 4-3 counties. Since conservation and disaster assistance stands as highly indispensable programs given that the ecology of the high plains ecozone transcends all 10 counties. Note that aside from occasional variabilities, both conservation reserves and natural disaster programs not only attracted hundred million dollars and above in the counties of Gaines and Terry. But they reached slightly identical values of $95-100 million dollars at Dawson during the same periods. Farm aids directed at corn cultivation appeared only in a trio of counties consisting of Lamb, Hale, and Parmer. In as much as Gaines, Dawson and Hale topped the list of the counties with subsidy dollars in every facet of the measurable indicators as mentioned earlier on. The heavy concentration of large peanut subsidy money at $113-254 million to $68 million dollars in the counties of Terry, Gaines and Parmer remains overly significant compared to wheat and sorghum in which only Dawson and Parmer cracked the $160 million-$107 million mark despite the presence of these commodities in 6-7 counties. Within the counties of Hale and Lubbock where appreciable amount of the subsidy was distributed, the areas contained the largest number of farmers estimated at 15,215-14,772, while Lamb had 13,329. In another trio of counties about 11,000 plus farms at Dawson, Floyd, and Lynn benefited from the program. Elsewhere in Gaines, Parmer and Terry counties, over 9,000-10,459 recipients emerged as primary targets of the farm assistance scheme as well (Table 2).
3.1.1. Land Use Change Analysis
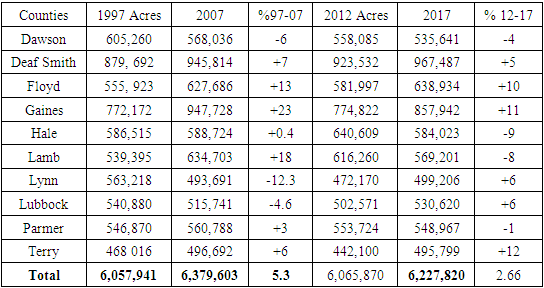
Give its attribute an intense land use farm belt, the study area held more than 24,731,234 million acres in tallies during the four-census year span at a mean value of 6,182,809. In those different years, all the 10 High Plains counties posted an overall cultivated land areas of 6,057,941 acres to 6,379,603 acres from 1997 to 2007. In the following census years of 2012-2017, the uptick in the size of farmland surged further by 6,065,870 acres to 6,227,820 acres. Under the county scale, Deaf Smith and Gaines contained vast farm areas totaling over 3,716,525 acres to 3,352,664 acres separately than their neighbors from 1997-2017. So, on the one hand in the span of a decade, the farmland distribution for Deaf Smith’s opening account of 879,692 acres, rose 945,814 acres until another upward movement of 923,532-967,487 acres in 2012 through 2017. On the other, Gaines County farmland base stayed on the rise at 772,172 to 947,728 acres and 774,822-857,942 acres between 1997-2017. Since about 7 counties (Dawson, Floyd, Hale, Lamb, Lyn, Lubbock, and Parmer) maintained medium level total farmland areas of over 2 million acres throughout the years. This exceeds far above the total size of 1,902,607 acres for Terry County from 1997-2017 at mean values of 566,756-601,135 acres. Accordingly, both Dawson and Floyd offer contrasting scenarios in which the later’ initial areas of farmland dropped from 605,260-568,036 acres to 558,085 acres -535,641 acres, but only to rebound by (555,923-627,686 to 581,997-638,934 acres) in the former. Out of combined averages of over 500,000 acres among the counties of Hale and Lamb. In 1997, their opening physical farmland values of 586,515-539,395 acres reached 588,724-634,703 acres respectively during 2007, until slight identical sizes of 600,000 plus to over 500,000 acres emerged by 2017. Among a trio of the counties (Lynn, Lubbock, and Parmer) with similar farmland mean values of more than 500,000 acres. Over time, all of them showed promising levels in the land areas devoted to agricultural activities except for the sudden slide involving Parmer in 2012-2017 census year. In the process, Lynn County farm area rose visibly by 563,218-493,691acres and 472,170-499,206 acres as Lubbock cultivated about 540,880-515,741 acres to 502,571-530,620 acres. Just as the county of Parmer followed up with 546,870-560,788 acres to 553,724-548,967 in land dedicated to farms, Terry’s farmland base surged from 468,016-496,692 acres to 442,100-495,799 acres.
3.1.2. Percentages of Change and Shifts in Farmland
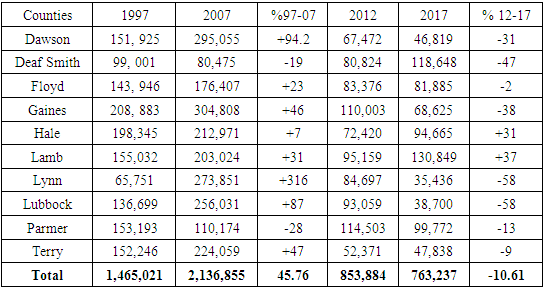
Beginning with a soft gain of 5.3% during 1997 through 2007, the Texas Higher plains agricultural land base rose by 2.66% during the 2012-2017 census periods. This seems to be in deep contrast given the extent of decreases that occurred in the periods 1997-2007 in 3 out of the ten counties. The rate of recurrence in farmland declines reached worrisome levels with the manifestation in 4 other counties during the 2012 all through 2017 censuses. Aside from the increasements of 7%, 13%, 23, 0.4%, 18%, 3% to 6% that occurred in, Floyd Smith, Gaines, Hale, Lamb, Parmer, and Terry from 1997-2007. The trio of counties made up of Dowson, Lubbock and Lynn posted substantial declines (-6%, -12.3%, -4.6%). The gravity of the agricultural land loss in the zone seems obvious by the four single digit drops (at -4, -9, -8, -1%) in Dawson, Hale, Lamb, and Parmer in 2012-2017. However, at the same time came remarkable surge of 5%, 10% to 11% for Deaf Smith, Floyd, and Gaines together with additional increments in farmland use for Lynn, Lubbock, and Terry at 6% to 12% respectively (Table 3).Table 3. The Size of Farmland Among North Texas Counties
 |
| |
|
3.1.3. Percentages of Change of Number of Farms
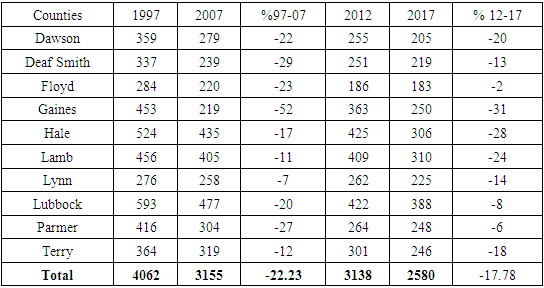
Starting from an overall farm estimate of 6583, 7501, in the first two censuses in 1997-2007 and the next ones at 7053-5832 at an average of 6817.25 and the sum of 27,269 in the different four periods. The number of farms that took in subsidy funds as manifested by the distribution outlook, points to the dominance of Lubbock as the leading farm county at over the 1000 mark from 1997-2017. Both Hale and Lamb ranked in the mix held 2nd and 3rd spots with 800-900 plus farms correspondingly on the upper tier of the farm belt counties. For these first three counties, the averages ranged from 1,106, 841.75 and 890.5. In that way, Lubbock’s farm numbers of 1,068-1,205 in 1997-2007 changed to 1,116 to 1,033 by 2012 through 2017. In Hale and Lamb counties, the farms fluctuated by 840-957, 865-987 as the activities therein continued by 899-671 and 933-777 farms all through 1997-2017. Similarly, Deaf Smith and Gaines in the medium group of farming counties, put into use sizable numbers of farms valued at 647-637 to 621-562 and 712-825 to 644-507. At that level, the counties of Dawson and Floyd did hold on to significant number of farms estimated at 583-555 to 596 386 and 517-650 to 589-440 respectively by averaging 530 to 616. In the case Parmer and Terry, see that the profile of farm operations was somewhat at an identical order of 599, 555, 70, 464 to 562-624,630-558 at mean values of 547 and 593.5. On the lower side of farm distribution in the zone, Lynn operated 490-506 farms to 455-434 farms at an average of 471.25 below the levels in other upper and medium counties. Looking at the sequence of percentage variations in gains and declines, the manifestation of single losses of -5%, -1,5%, -7% occurred mostly in 3 of 10 counties (Dawson, Deaf Smith, and Parmer in 1997-2007). In the same period, Floyd, Gaines, Hale, Lamb, Lubbock, Terry, and Lynn made gains of double- and single-digit proportions of 26,16,14,13,11% to 3%. But in the 2012-2017 censuses when all the 10 areas saw losses, about 8 of them posted double digit drops, while only two of others ended in single dight columns of declines. From the complete temporal snapshots in these places. Note that while Dawson accounted for the highest double-digit declines of -35%. It was followed by -25, 21, 19, 17, to 11, 10 % at Floyd, Hale, Gaines, Parmer, Lamb, Terry, and Dawson as Lynn, and Lubbock experienced lower declines of -5 to -7%. At the regional level, the changes in the number of available farms started with a surge of 8.97% between 1997-2007, until double digit losses of -17.31 crept in 2012-2017 (Table 4).Table 4. Number of Farms and Percentages of Change
 |
| |
|
3.1.4. Percentages of Change and Irrigated Lands
The size of irrigated areas as major drivers of subsidy farming intensification involves the water sprinkling on large sites. This includes 1,804,571-1,601,189 acres covered by 1997-2007 and 1,374,868 to 1,321,902 acres in the ensuing period of 2012-2017 throughout the region, at an average estimate of 1,527,883 acres. In the counties, a trio of them Hale, Gaines and Lambs dominated in irrigated land acreages. Therein, water sprinkling targeted over 200,000 acreages of land in the first 5 years at 310,315-243,491 to 233,513-242,624 acres and 218,235-234,848 acres. This reflects average values of 236,347 acres, 225,038 to 201,620 acres, whereas mean values at the nearest counties in that order stayed in the upper 100,000 plus category. The other heavily irrigated land areas are those in Lubbock and Parmer where the water flows covered sizable acreages measured at 212,168, -159,459 to 216,451-174,990. In the medium level counties at Deaf Smith, Floyd and Terry, water sprinkling reached 168,890-131,633, as well as 169,569-129,798 acreages in land areas therein. Within Dawson and Lynn, the irrigated land areas in the lower levels stood at solely in the tens of thousands (64,756-77,686 to 74,167-77,686) acres. By 2012-2017, both counties irrigated land areas remained similar in the tens of thousands of acre categories at 61,154-54,834 to 71,599-83,101 acres as well. Within the same periods in 2012-2017, the major irrigated counties in upper and medium categories (Gaines, Hale, Lamb, Lubbock, Deaf Smith, and Parmer) continued their water sprinkling operations on vast acreages of land (226,992-197,021, 202,238-189,342 and 179,531-173,865 acres). This altogether went on at appreciable levels (119,924-122,396 acres to 155,462-166,725 acres and 162,971-110,098 acres) essential to farming in the last three counties (Table 5).Table 5. Irrigated Land in acreages and Percentages of Change
 |
| |
|
The same can be said of Terry County whose irrigation land coverage stood at 98,249-104,419 acres. In terms of percentage changes in irrigated land that occurred. The numbers dropped by -10.77% to -3.82% from 1997-2017 as declines of mostly high double digits -22, -24, -25, -19 to -07 percentage points extended further deep into 6 of 10 counties at Deaf Smith, Floyd, Hale, Lynn, Lubbock, and Parmer. In 1997-2007, more drops in irrigated land remerged in 5 of 10 counties made up of Dawson, Gaines, Floyd, Lamb, and Parmer at -10%, -13, -6%, -3 to -32%. In the following census 2012-2017. Aside from gains of 20, 4 to 8% in a quartet of counties (Dawson, Gaines, Lamb, and Terry) in the opening five years from 1997-2007, half of the counties (Deaf Smith, Floyd, Lynn, Lubbock, and Terry) all made gains of 2,24, 16, 7, and 6% between 2012-2017 (Table 5).
3.2. Impact Assessment
In looking at how the surge in agricultural subsidy disbursement, spurred production among the core crops in farming operations in the 10 counties within the study area. There exists a mix of notable impacts as manifested with some upsides and downsides at various levels pertaining to the pressures from a handful of stressors precipitating fragmentation on the ecozone despite the known economic gains and dollar distribution among beneficiaries in North Texas. This consists of pollution, water depletion, economic and ecological implications.
3.2.1. Pollutions Risks From Agrochemicals Sprays
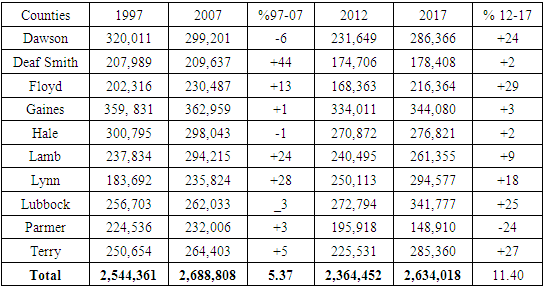
Considering the study area’s vast richness in natural areas, biodiversity and adjoining head waters, the risk to the ecosystem seems to have amplified more than ever. Yet the size of land treated with fertilizers and chemicals reached average levels of 2,557,910 acres in the four census periods throughout the region. From the temporal portraits of the nutrient spray over time on lands, see that the operational requirements not only extended to large swaths of fields. But the size of areas that came under nutrient treatment reached a combined total of about 2,544,361-2,688,808 acres in 1997 and 2007. In the ensuing years 2012-2017, additional 2,364,452-2,634,018 acres in North Texas saw further spraying. One striking thing out of the state of nutrient applications touches on the emergent classification patterns among the counties. From the order of rankings in place, Gaines stands out as the number 1 area with an average of 350,220 acres of land treated with fertilizers and chemicals. Just as this is overly above the combined average value of fertilizer and chemical sprayings for the other 8 counties from Dawson to Terry with group average of 251,876 acres in the same periods of 1997 through 2017. Deaf Smith County at 192,685 acres appears to have treated much fewer land areas with chemicals throughout the years (Table 6). In the same vein are the number of farms sprayed with fertilizers and chemicals from 1997-2017 as well (Table 7).Table 6. The Size of Land Treated with Fertilizer and Chemicals
 |
| |
|
Table 7. Number of farms treated with fertilizers and chemicals
 |
| |
|
Of the counties, the applications of insecticides on land areas in Gaines at an average of 173,080, as the leading place covered a total of 208,883-304,808 acres in the initial decade of 1997-2007 and 110,003-68,625 acres by 2012 to 2017. Accordingly, the use of subsidy induced insecticides remains high knowing fully well the ecological risks involved. From the vulnerability of the nearby natural systems, the recurrent spray of chemicals, nutrients and insecticides in the zone endangers the carrying capacity of the ecosystem (Table 8). Likewise, the lakes and rivers and watersheds within counties in the zone are exposed to the dangers of pollution coming from nutrient flows unleashed by intense agricultural operations in the North Texas high Plans. With many of the aquatic systems in the counties fully exposed to some level of impairment over the years. The pace of watershed damage therein stayed on the rise as well. Given the scope of degradation caused by the movement of various pollutant loads of pesticides and agro-chemicals. Also, some of the non-point source sludge containing nutrients and organic items threatens the hydrology through the inflow of contaminants onto open lakes and rivers during seepage from overload surface runoff and ground water penetration.Table 8. Acres Treated to Control Insects or Insecticides
 |
| |
|
Given that the primary nutrient of concern consists of nitrogen and phosphorous, the former is characteristically a limiting nutrient in most rivers saturated by non-point source apart from agricultural watersheds. With the watersheds adjacent to cropland activities where intense farming remains fully subsidized. The carrying capacity of the environment is fraught with recurrent degradation which is manifested by fishing and river advisories banning usage due to widespread contamination in surface water environment of the zone over the years. There is also the presence of pesticides, organic enrichment, and ammonia toxicity in the streams. While some of these originate from farming and human activity, they point to an ecosystem under stress from the influence of change induced by subsidy. Knowing the frequency and amount applied, pesticide run off remains a big issue in the region. In process, the streams and rivers were reduced to sinks for the by-products of farming activities which in turn threatens the ecosystem.
3.2.2. Water Depletion from Subsidized Farming
The water assets of the Ogallala Aquifer, as a major catalyst for farming in the North Texas High Plains, has for years boosted the fiscal fortunes of the counties and the zone. However, this seems to have occurred at the expense of hydrological security considering the shrinking pace of water levels in the aquifer. Since water transfers out of the aquifer involves over 200,000 wells, the removal pace at 10 to 50 times out of the Ogallala reservoirs exceeds the recharge rates. Within the adjoining localities involved in intense agricultural activities, the water table fell by 100 to 200 feet due to widespread usage. This new realty is contrary to agelong assumption that the sub terrain water availability in the aquifer was infinite. However, by the last 4 decades, the depletion pace of the major aquifer has fully accelerated to alarmingly high levels. Against that background, the looming water disaster therein seems to be in the horizon in a zone responsible for cultivating much of the nation’s foods. Beneath the flourishing landscape below, the region’s hydrology stands on the verge of extinction that is now putting a major food basket in danger. Being among the globe’s biggest reservoir, the hydrology as a critical system supports billions of dollars in farm output yearly. In the process, subsidy supported faming continues to push the Ogallala aquifer on extinction path much faster than anticipated with the pumping of about 89 trillion gallons out of the water source between 1900-2008.
3.2.3. Ecological, Physical and Soc-Economic
Bearing in mind the enormous dependence of local farms on the Ogallala water across areas in the zone, and the aquifer clearly accounting for 1/3 of irrigation. The quest for water from the aquifer surpasses availability since the recharge capacity falls below the extraction level. With yearly water level declines occurring at the rates of 2 ft and aquifer recharge at only 3 inches on the average. The freshwater environment faces serious impacts in the face of depletion as various enquiries have attested, as such the study area is no exception. With no water from the Ogallala water, vast segment of the regions farming, and associated enterprises would be unviable and devoid of sustainability. This might pose heavy impediment to the survival of many communities whose livelihood rely on water pumped out of the aquifer. Seeing the dominance of cotton and grain farming in the zone and the way the same produce ends up in China and then exported back to the US for consumers. Global consequences will be disastrous should the Ogallala aquifer vanish completely in a region that produces one-sixth of the world’s grain products. Since various ecosystems draw on sub terrain water like creeks, marshes, and streams. The rising incidence of subsidy induced depletion seems related to the disappearance of fish stocks in the zone, given the regular aridity of adjoining marine ecosystems including lakes and rivers reliant on the Ogallala ground water to sustain biodiversity during the periods of drought due many years of intense extraction.
3.3. GIS Mapping and Spatial Analysis
The GIS analysis consists of the visual display of spatial patterns underscoring the ingredients of subsidy indices involving regional agricultural structure based on farmland activities anchored on distribution and availability. The said indices consist of proportions and changes in the number of farms, irrigated area and cultivated land area, the spots treated with fertilizers and chemicals. The others cover the display of the physical components of watersheds and aquifers critical in the actual day to day operations of subsidized farming under the corresponding scales vital in the delivery of farm produces across various states. Based on the portrayals of the indices in space. These parameters embody subsidy variables of land in farms, the capacity of irrigated areas, the use of farm nutrients, and the recurrent diversion of water from aquifers and watersheds currently in progress. The manifestations of government aid and impacts across the hubs in the North Texas Plains did take center stage as well. The info conveyed via geo-analytics on several scales and shades represents the potential contours of the sector and the risks involved. The ability to pinpoint spatial-temporal dimensions of the subsidy impacts across spots in space using GIS as the analytical tool, is very vital in showing the state of farm aid and the drawbacks in the Texas Northern Plain amidst the ongoing proliferation of subsidy in the sector. Considering that the scope of changes in the number of farmlands cover notable declines in one period and gains in the other along the Lower South and the Upper corner between 1997-2017. It came as no surprise that most counties in 1997-2007 in the central zone, posted gains compared to the declines in 2012-2017. In the same periods, see that the same pattern of double-digit losses in the number of farmlands at Lamb, Hale, and Floyd extended deep into Deaf Smith. This is like what transpired in Terry and Lynn around the East and Gaines and Dawson in the Lower south where double-digit declines in blue held firm (Figure 2). | Figure 2. Percentage of Change in the Number of farms, 1997-2017 |
On the land use side of things, the percentages of change in irrigated land acreages in the North Texas zone indicates the pace of irrigation activities in the Lower south portion of the map. The analysis reveals a deep contrast with splits among the counties over the years especially in 1997-2007 and 2012-2017. This involved increases of 4-20% evident in Gaines and Dawson in 1997-2007 and drops of -13 to 10% during 5-year period that ran from 2012 through 2017. Elsewhere in the same periods, among the trio of the other areas (Terry, Lynn, Lubbock) actively involved in irrigation, the percentage of gains among the counties far surpassed the declines. In the same vein, are clusters of counties from Floyd, Hale, Lamb, Parmer and Deaf Smith in the central and Northern zone with notable concentration of irrigated land declines between 1997-2017 (Figure 3). Furthermore, the unfolding trend in the percentage of changes in the size of land in farms indicates low levels of increases in the both the Northern (Deaf Smith, Parmer) and Lower south counties of Terry and Gaines with a mix of increments and visible losses in the central and eastern areas of the study area (Figure 4). | Figure 3. Percentage of Change in Irrigated Land, 1997-2017 |
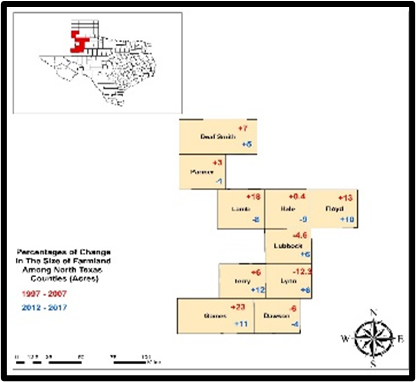 | Figure 4. Percentage of Change in Size of Agricultural Land, 1997-2017 |
From the info on the legend, the numeric info covers the areas, the number of farms that received both fertilizer and chemical treatments to boost productivity. With the spatial patterns evident across multiple counties distinguished in the colors of red and blue along the north, southeast and western parts of the study area during the periods 1997-2007 to 2012 -2017. From the temporal-spatial profile on the map, the spatial distribution of the areas in space with varying proportions of percentages of change in the farms sprayed with nutrients all through 1997-2017, reveals outright declines across the board in most of the counties. Even though among these areas, the southernmost edge of the counties, Gaines and Dawson and Terry posted quite a high level of losses in the high double-digit margins (-52% to -22% and -31to -20%). Moving further East into Terry, Lynn, and Lubbock, comes additional losses in which the rates for Lubbock at -20% in 1997-2007 superseded the levels of declines at Terry and Lynn in the same period. At the same time, the rate of losses for the central counties of Lamb, Hale, and Floyd appeared visibly and slightly identical at -24%to -28% as the changes in Floyd County stayed only at -2% during 2012-2017. In the other years, between 1997-2007, a reversal of pattern emerges with the percentage changes of -11 to -17 % at Lamb and Hale below Floyd’s -23%. In the same region, note that on the upper North corner of Deaf Smith and Parmer, the proportions in the number of farms under nutrients changed significantly by -29% to-27% during 1997-2007, but only to slide notably at -6 to -13% (Figure 5). | Figure 5. Percentage of Change in Farms Treated with fertilizers and Chemicals, 1997-2017 |
Of the changes in the land areas treated with fertilizers during the periods 1997-2017, the actual percentages mostly stayed in the upsides in terms of gains compared to declines in a couple of places in 1997-2007 at Dawson, Lubbock, and Hale. With time emerges widespread increments by 2012-2017 along the lower South area of Gaines and Dawson. Therein, by 2012-2017, the initial uptick in the spraying of fertilizers and chemicals at 3 to 24% continued at Terry Lynn and Lubbock together with further spread onto the neighbouring central counties of Lamb, Hale, and Floyd in blue at varying proportions of 9%, 2%, to 29%. In the northern counties of Parmer and Deaf Smith, despite a mix of 2% increase and the big skid of -24% during the 2012-2017 periods in the use of agrochemicals, there were evidence of higher increases in the counties of Deaf Smith, Lamb and Lynn at 44%, 24% and 28% during a span of 10 years from 1997-2007. Importantly, the major takeaways in one period of the other during 1997-2007 and 2012-2017 worthy of note, touches on the place of Deaf Smith in the upper north side of the study area as the leading user of agrochemicals coupled with Dawson, Terry, Lynn, and Lamb in similar order (Figure 6). | Figure 6. Percentage of Change in Farmland treated with Fertilizers and Chemicals, 1997-2017 |
On the ecological and physical side of things, one need not lose sight of the significance of current conditions of the region’s hydrology through the aquifers and watersheds as a major factor in the disbursement of subsidies and the implications regarding impacts within the counties. With Ogallala in light green being the major aquifer influencing farming activities on the upper side of the map (Figure 7). As current records indicate, the Ogallala aquifer has come under tremendous stress in the form of recurrent depletions and reductions in water depth (Figure 8). This ongoing change in the hydrology in part reflects the negative interactions of subsidized farming and the intensity of operations and ground water ecosystem. This stems from the aquifer’s critical roles in the cultivation of essential water thirsty crops from cotton to the others. Furthermore, the presence of major basins beginning with the Colorado in the Lower side, Brazos and Red River along the central counties as well as the Red river and Canadian in the Northern portion again affirm their roles in government assisted farming in the study area (Figure 9).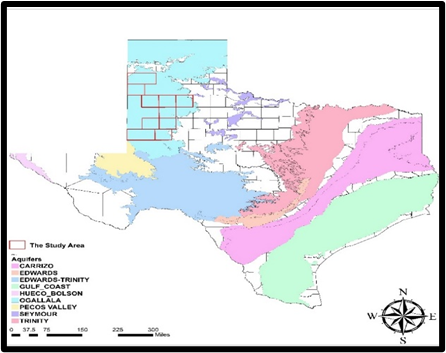 | Figure 7. Spatial Distribution of Aquifers In Texas, With Ogallala |
 | Figure 8. Water Depletion Levels In The Ogallala Aquifer |
 | Figure 9. Major Watersheds In Texas with Northern Plains Highlighted |
3.4. Factors Shaping Proliferation of Farm Subsidy
The important elements advancing the growth in farm subsidy across the 10 counties in Texas Northern Plain in terms of amounts of disbursements, the commodities involved in the study area and production trends did not happen in isolation. They are linked to different policy, socio-economic, and physical and environmental factors. These elements are described below one after the other.
3.4.1. Policy Elements in Place
The rising level of farm subsidy allotment in North Texas cannot be separated from the present approaches to the directions of policy making process in the country. The things to glean from the policy impacts come with the institutional bias towards the preference for the five commodity crops, the decision-making process pertaining water distribution and negation of healthy food crops in the actual implementation of subsidy in the study area. Essentially, grain items rank overly high on the chart among the farm produces deemed strongly fundable according to the affordability index of food shelves at grocery stores and far ahead of healthy vegetables and fruits. Therefore, grains account for ¼ of much of US’ food, while oil derived through corn, soybeans, and canola fully constitutes the reaming 25%. Because fruits and vegetables merely represent just below 10%, only over 6% in agricultural aid are directed at a quartet of scrappy cuisine elements made up of corn syrup, high-fructose corn syrup, corn starch, and soy oils. From the absence of healthy food on those listed as subsidized. One gets the impression; the US authorities only support items known to encourage the nation’s obesity pandemic. This is manifested in a manner that reserves unnecessary preferential treatment for top commodity producers with no level playing field for fruit farms in the study area. Surely, such an approach is not what subsidy should be all about, considering the overall implications on the system and the mixed messages. The contradictions are further evident as the same government subsidy system doles out cash to farmers to keep vast swaths of land fallow despite the volatility of the marketplace in such settings. In the case of corn production, the supply of ethanol serves the ultimate policy purpose while the attendant price surges get passed on to consumers despite the water intense nature of corn and the heavy fertilizer dependency with GMOs Gylosoaphate among them. In Texas, the policy overseeing ground water in context of common community resource at the disposal of landowners, forbids transfers on malicious grounds. Being an approach where landowners can freely transfer 25,000 gallons with no Ground water Conservation district authorization. The rising depletion rates of the Ogallala aquifer region raises further concerns, as US authorities still influence ground water usage from the aquifer through the subsidies for water thirsty corn farms where planting require about 20 inches amidst the rapidly dwindling pace of the reservoir.
3.4.2. Economic Forces
Texas is an important agricultural state, ranking only behind California and Iowa in terms of cash receipts from the sales of agricultural commodities. By 2018, those agricultural receipts reached around $22 billion. In that way, some of the factors affecting agricultural production include supply chain issues, labor shortages and instability in agricultural commodities markets, as well as the general change where people are not spending their food dollars due to COVID-19- restrictions. But as lawmakers begin to craft new legislation, groups across the political spectrum are challenging the amount of those subsidies—and who benefits from the federal support—with good reasons. Of the $222.8 billion in subsidy payments from 1995 to 2010, 74% went to only 10% of the agricultural-industry recipients nationwide. Accordingly, there is a public call for more financial support for local farmers and organic agriculture. In Texas, from 1995 to 2010, the top 10 percent of revenue-generating farms received a yearly average of $40,600 each in subsidies, while the bottom 80 percent took in $649. During that 15-year period, the largest beneficiary in the state was Dublin’s McNutt Bros Dairy, hauled in $13,591,913 in subsidies, while in 2010 Lahey Farms in Brownfield took the biggest subsidy of $528,819. Such an approach affects the capacity of marginal growers to hold on to land.
3.4.3. Physical Environment
The North Texas high plains as a key breadbasket, remains overly productive given the capacity of the core subsidised commodity crops to thrive in the farm fields. The Ogallala as a geologic formation where water fills the spaces between sandstone, gravel, clay, and other sediments remains major catalyst for farm output. Being the single source of irrigation water for the region, the presence of the Ogallala as the massive underground reservoir therein, stands high as one of the largest fresh-water aquifers in the world essential for agriculture. Formed millions of years ago from the erosion of the Rocky Mountains, it now traverses through portions of eight states from Colorado to Texas. While the system provides 30 percent of the US irrigation, it contributes to an astounding 20 percent of the country’s entire agricultural output. Known for the grasslands therein, the area contains reasonably high and level plateau of sandy to thick, dark calcareous clay soils. With the region’s high propensity towards intense farming and heavy government subsidy. The farming soils therein are responsible for the production of a diversity of crops. Given its vast ecological features of wildlife habitats and adjacent streams, and aquifers. The adjoining watersheds are prone to high sediments and chemicals from deeply supported farm fields linked to the growing deficits in the major aquifer and the pressures from water thirsty crops like corn. In such a semi-arid zone of the nation under heavy subsidy, the Oglala represents the largest contiguous land mass set aside for farm production.
3.5. Efforts and Initiatives
Seeing the extraordinary increases in subsidy disbursements for agriculture in the last several years, as an essential component of policy instruments intended to assist those in need. The present ecological and economic benefits and policy directions in favour of subsidy, and the contradictions, has sparked a turnaround aimed at containing program leakages and the fallout from the impacts. Hence, measures are being taken by different state entities and other actors in the industry to improve farm subsidy approaches through wide ranging initiatives beneficial to the industry in the North Texas Plains.
3.5.1. Water Conservation Initiatives
In the context of efforts aimed at containing subsidy effects and the changing hydrology in the study area. The intensity of aridity along the Texas High Plains has over time prompted a rare collaboration among planters and scientists working tirelessly in the search for efficient options to ease the strain from the region’s reliance on irrigation driven single cropping systems. From the urgency, the US authority has also initiated a package of both monetary and practical support targeted at growers committed to conservation. While this coincides with additional assistance directed at the design of huge water channel schemes in boosting the needs of deprived parts on the High Plains. This reflects US government interests in solving emergent water insecurity tied to depletion under the Ogallala Aquifer Initiative. Elsewhere the moves by the High Plains water district with jurisdiction over 16 counties dependent on the Ogallala and Texas water development, in ensuring certainty over access via various schemes is another right step-in place. In 2005, the legislature of Texas stepped up actions requiring all the state’s 16 groundwater management areas to synchronize with the 96 water districts on a novel planning procedure. Under the scheme, every place must tender an action plan highlighting the likely groundwater leftover in five decades, as a part of a criterion dubbed “preferred imminent situations”. To this effect, the High Plains Water District felt water transfer must be kept at only 50% of the current level by 2060 in the aquifer where corporate farm usage stood during the 1950s. As steps towards attaining such objective, the district has now curbed the number of yearly water transfer authorizations progressively.
3.5.2. Stakeholder Partnerships
There exist cooperative project partnerships initiated through various stakeholders including Kansas State University, Texas A&M University and Texas Tech University. The focus revolves on the use of state-of-the-art conservation techniques applicable to farming activities in Ogallala Aquifer zone near the study area and enriching countryside markets dependent on agriculture. Because the outcomes serve nearby localities heavily dependent on the common head water flow for farming and better practices essential in integrated and efficient cropping systems and sustainable irrigation administration. The expectations are that better awareness of the practices impacting soil water substance in the planting season, provides opportunities towards improved styles in evaluating the efficacy of alternate practices. The belief is that extended surveys will be used to measure the impacts of decreased cultivation on crop output, and soil physical attributes for wheat-sorghum-unplanted crop cycles and alternate harvesting structures. While this will involve the use of watershed, remote sensing, and climatological systems and the applicability of digital irrigation models. With geospatial tool of remote sensing intended to beef up water use projection and enhance its use in the policy making for planners, long term benefits for water districts, and managers in the zone remains.
3.5.3. Federal Legislative Mandate and Policy
In the context of what transpired over the years in lieu of the role of federal policy instruments of subsidy in the disbursement of funds. The farm bill’s expiration window under the legislative calendar of September of 2020 provided the impetus for final deliberations. As such, the US federal legislators showed their commitment in farm subsidy allocations by convening meetings under a fresh deal as part of the new bill. With center piece of the aid anchored on multibillion outlay for planters and those in large farm enterprises. The state of Texas and her Northern high plains counties as major hubs for farming and commodity trades, emerged as big recipients of the aid nationwide. Given that the benefits and results of the subsidy delivery are of great importance to the state of Texas and the Northern counties involved. Between 1997 through 2017, all the 10 counties as recipients of farm subsidies, benefited from the safety net for producers in a manner that kept production afloat along with food security. Looking at multiplier effects of subsidy across various sectors of the economy. The spillovers from it as catalysts for growth and the center of life in the countryside from businesses to farm aviation remains obvious. From the legislative powers of congress, to promulgate new laws beneficial to growers. Of the $222.8 billion in subsidy disbursements between 1995 to 2010, ¾ ended in the hands of only a few agribusinesses in the nation. Without such moves, farm aid payout in the study area would not have happened as it did.
4. Discussion
This study used a mix scale model connected to GIS and descriptive statistics to assess subsidy use and the ecological effects in the North Texas region. The emphasis revolved around the issues, trends, impacts, factors, and efforts. Overall, subsidy in the High Plains covered the payoff of $7.85 billion to support items from commodities to disaster expenses. Of these, while about 112,254 authorized farmers in mostly cotton, peanuts, sorghum, wheat, and corn and environmental conservation expenditures benefited from the scheme from 1995-2020. The payout affirms the prominence of farm commodity at 60% of all ranked items on the metrics. Seeing the rates of disbursements set aside for all the counties, evidently most farmers in the zone remain foremost beneficiaries of agricultural subsidy. In as much as this shows, the region’s heavy reliance on subsidies. However, the primary produces profiting from federal subsidy schemes in various places in the nation are not different from the ones in North Texas. Considering the dominance of cotton among the other items, the crop stood out as the most highly subsidized product from the regularity in rankings within 9 of 10 counties. This overwhelming presence of federal subsidy assistance in over 99% of all counties as unprecedented as they seem provides the areas many opportunities at their own expense. This is occurring under a system where some still lament, about the rationale behind the costs, the politics, and the misuse of subsidy allotment as a policy tool favouring select few crops while excluding healthy farm produces amidst limited consideration for organics, small farms, and marginal groups.Given Texas’ position as a major beneficiary of farm aid. There is a perception that this really translates into a broken system riddled with institutionalized preferential treatment under a scheme solely set up to serve mostly far larger farms. Being completely out of touch with the makeup of the state’s agricultural structure particularly across ethnic, racial and gender lines. It does raise questions pertaining to the integrity of the decisions leading to the actual allocations of subsidy dollars. Because farm aid assistance disbursement formula of that sort only enhances the desires of the affluent farms throughout the North Texas Plain. This only emboldens growing demands for fair practices regarding the allotment of public funds in way that does not make it degenerate into a scheme serving the exclusive rights of one group to the detriment of the others. Surely, those at the margin just because of class, race, and social stratification in a state with Latino, Black and female farmers should no longer be treated merely as bystanders. Still, such uneven level playing field only widens the gap between affluent planters and minorities who are forced to jockey around for bank loans under difficult conditions that do not favor them. In this case, the small farms limited capacity to absorb the quarterly volatilities from the marketplace sustained by state assisted schemes of subsidy, makes agricultural land holding challenging for marginal operators. For that, the number of farms across the region not only dropped from 7053 to 5831 at a rate of -17.31% by 2012-2017 even though the total agricultural land area surged by 5.3-2.66% 1997-2007 all through 2012-2017. GIS analysis also pointed shifts in farmland indicators and other elements tied to the larger agricultural structure together with extensive dispersion of agrochemical and nutrient applications across the counties. With increments in the land areas treated with fertilizer fully manifested remarkably in 9 of 10 counties during the 2012-2017 census periods. The region’s biodiversity and surrounding watersheds seems to be at risk.Overall, the North Texas plain ecosystem as farm intense zone where land use indices of farms and farmland are actively in regular use, seem highly vulnerable to farm aid impacts through that occurred given the gains and declines in the region. With that, fertilizers, chemicals, and insecticide use on agricultural land rose by 5.37%-45.26% during 1997-2002. Amidst the declines in irrigated land, note that the water table on the Ogallala aquifer dropped by 100 to 200 feet because of extraction of the resource to boost agricultural activities. From reliance of most farms on Ogallala water, this primary water aquifer accounted for 33% of most irrigation supplies in the zone.While the impacts stem from various socio-economic and policy failures and physical elements, several recovery efforts to address the issue still did not eradicate the impacts completely. Considering that, the paper offered several suggestions including the need for the reform of farm subsidy policy, the establishment of educational and awareness programs on the effects of farm aid, the need for environmental considerations, regular monitoring of natural areas adjacent to heavily subsided farms, the elimination of both fiscal and market distortions often skewed in favour of big farms and regular use of geo-based analysis.
5. Conclusions
This enquiry focused on an assessment of agricultural subsidy impacts on a couple of counties along the North Texas region and its surrounding ecosystem with vital outcomes: a) The study area is heavily dependent on farm subsidy, b) Uneven concentration of subsidy recipients in some areas c) mix scale methods stayed on target in unveiling the issues; d) the natural ecosystem remains highly vulnerable/impacts; e) the impacts of farm aid on the ecosystem caused by various elements. Generally, the expected impacts of agricultural subsidy on the Texas Northern Plain ecozone remains obvious. This trend does not have to be overlooked considering the level of fiscal and environmental concerns. Despite the ensuing environmental and social disparity risks involved, the study area has over time received significant sum of government aid aimed at farmers. Between the census years of 1995 to 2020, the North Texas Region collected around $7.85 billion dollars. Given how such hefty sums of cash are disbursed to farmers towards the sustenance of commodity produces. Subsidy has found ample uses in environmental programming like conservation and natural disaster relief. Gaines County surpassed every other place in the zone as the largest recipient of aid appraised at $1.2 billion dollars. Realizing the public calls for good practices in allotments amidst budget deficits and ecosystem disasters. The capacity of this study in delineating the heavy dependency of planters in the zone on assistance, provides a structure to reach several actors. This comprises of groups and decision-makers set on monitoring the tendencies to reassure the public that farm aids are only meant for the individuals in need. The basis is that subsidy ought to be utilized solely for its unique purposes without damaging the ecosystem, while serving underserved planters desirous of assistance to succeed. The present allocation formula of agricultural subsidy in the North Texas Plain zone remains beset by uneven disbursement of aids money in the past periods on a single crop cotton and the heavy concentration of largest dollar amounts in just a few counties at the expense of the others. The disparate presence of a particular crop and of aids beneficiaries within certain localities as seen in the region, represents a high risk. This could be problem should price volatility and disease outbreaks affect a popular crop and then dry up aid(s) cash to farmers operating in 3 to 6 of the counties. In as much as such farmers face the unwanted risk of limited harvest in the event of uncertainty. This shows the gravity of institutionalized bias directed against healthy foods from fruits to dairy items waived off the subsidy listings. Certainly, the consequences here stems from an erroneous view of the allocation criteria as a trivial exercise solely based on the dominant crops, land area and the farm size, without looking at those deemed unqualified. Considering the way small-scale farmers and minority farms are marginalized. Current approaches are so unjust that it reignites public doubts on issues linked with disparate allotment of farm subsidy to the wealthy but ignoring poor farms. This implies that the true mission of subsidy programs as a legit effort to help folks desirous of assistance, risks losing its correct sense. In detecting such irregularity, the belief is that those overseeing the payout of farm aid, will get the opportunity to monitor the unfairness involved in the one-sided dumping of farm subsidy dollars in just a few areas. Likewise, the uses of mix scale methodology of GIS and descriptive statistics as research tools showed a touch of timeliness. Applying a mix-scale method of descriptive statistics and GIS mapping as operating devices injected extra depth to the regional appraisal of the ecological effects of farm subsidy. Given that the focus on the management of farm aids effects requires a multi-faceted structure like the mix-scale used in the enquiry. The tool was overly useful in characterizing the study site and detecting the trends, together with the collection of data on the factors, the tabulation of beneficiaries and the monetary amounts. Further applications pinpointed sites of major freshwater ecosystems and the stressors tied to degradation and water depletion. While along these lines, the method also delineated the usage of farmland during the process. This model serves a vital purpose in meeting the desires of researchers involved in the geo-spatial analysis of regional effects of farm aid in the nation’s most deeply cultivated hub. The sound use of mix scale model requiring geographic visualizations together with subsidy info, as an analytical device increases our insight on concerns arising from farm aid allotment. Realizing the essence, improves the advancement of monitoring abilities in mitigating the pains in farming counties at the margin. The enquiry stayed quite on course in highlighting the rising exposures of the ecosystem. This stems from the heavy allocation of farm aid as manifested from the declines in agricultural land, the volumes of water diversions through irrigation acreages and the use of chemicals and insecticides. Recognising additional dangers encompassing environmental degradation and the use of insecticides on farm landscape and the incessant stress placed on Ogallala aquifer and the ongoing depletion pace, reiterates the appropriateness of the enquiry. Demonstrating such emergency flash points given the growing stressors, shrinking land area and water degradation and aquifer depletion triggered by farm subsidy has many upsides. Keeping communities informed of such facts, offers citizens the prospect of monitoring places under threat and the necessity of making those areas the focus of recovery. By pinpointing the susceptibility to environmental declines and water pollution and depletion around the zone. The research re-echoed that the effect of agricultural aid extends to every side of society economy-environment interface. Bearing in mind the vulnerability of the region’s ecosystem to stressors and the nature of liabilities from farming practices sustained by subsidies and what emerged from this study. Decision makers and county planners in the region would be tasked in the periods ahead to seek urgent responses to many pertinent questions that are germane to the welfare of the ecosystem. The questions involve which future liabilities are likely to emerge from farm aid practices in the North Texas Plain ecosystem? What will the level of impacts be like? Which patterns will the spatial aspects of the risks assume? Which other factors will influence subsidy dependency in the region? From these questions, there are plenty of prospects for research and policy practitioners to shift the strategy on subsidy impacts. This can be attained using policy interventions emphasizing mitigation with effective measures in the decision-making process. The belief is that this will protect communities and the surrounding ecosystem from environmental liabilities of farm aid in the years ahead. Fundamentally, the North Texas Plains region as a heavily farmed area dependent on subsidy remains an ecosystem under stress given the persistent vulnerability to agricultural subsidy burdens.
References
| [1] | Environmental Working Group. (2022). Top Subsidy Programs For Texas. EWG. DC: Washington. |
| [2] | US Department of Agriculture. (2002). US Farm Bill.24 CBO Now Forecasts that the Farm Bill Will Cost US$190 Billion e. Online Available: http://www.usda.gov/farmbill/. |
| [3] | Pearce, David. (2002). Environmentally Harmful Subsidies: Barriers to Sustainable Development. The OECD Workshop on Environmentally Harmful subsidies. Paris, France November 7-8, 2002. |
| [4] | Georgina, Gustin. (2017 September). Politics and Policy: Harvey Floods Batter Texas Farms. Online Available: https://insideclimatenews.org/news/02092017/hurricane-harvey-texas-farms -climate-change-cotton-cattle-longhorns-ranches-photos/. |
| [5] | Mayer, H. (2002 July). The 2002 US Farm Bill`s Implications for Commodity Markets and Canada`s Agri-food Sector. George Morris Center. |
| [6] | Porter, Gareth (2002) Subsidy and The Environment: An Overview of the State of Knowledge. The OECD Workshop On Environmentally Harmful Subsidies. Paris, France November 7-8, 2002. |
| [7] | Editorial. (2011 April). Federal Farm Subsidies Should Be Slashed. The Washington Post. April 1. |
| [8] | Organization for Economic Co-operation and Development. (1998). Improving the Environment Through Reducing Subsidies. Paris, France: OECD. |
| [9] | Edwards, Chris. (2018 April). Reforming Federal Farm Policies. DC: Washington. CATO Institute. |
| [10] | Mayrand, Karel. (May 2003). The Economic and Environmental Impacts of Agricultural Subsidies: An Assessment of the 2002 US Farm Bill and Doha Round. Montreal, Quebec, Canada, Unisfera International Centre. |
| [11] | Smith, Cheryl. (2012 March). Down on the Farm Subsidies. Texas Observer. |
| [12] | Environmental Working Group. (2020). Farm Subsidy. North Texas County Data. DC. Washington, EWG. |
| [13] | Taxpayers for Common Sense. (2018 April). Corporate Welfare. Fact sheet; Impact of U.S. Agriculture Subsidies on Water Quality. DC. Washington, TCS. |
| [14] | Taxpayers for Common Sense. (2018 April). Effects of Farm Subsidies on Farm Management Decisions DC. Washington, TCS. |
| [15] | Amadeo, Kimberly. (2020 November). Farm Subsidies with Pros, Cons, and Impact How Farm Subsidies Affect You. NY, New York: The Balance. |
| [16] | The Editors. (May 2012). For Healthy Country, Overhaul Farm Subsidies. Scientific American. 306:5:1-2. |
| [17] | Physicians Committee for Responsible Medicine. (2014). Agriculture and Health Policies In Conflict. DC, Washington. Physicians Committee. |
| [18] | Wallinga, D. (2010) Agricultural Policy and Childhood Obesity: a Food Systems and Public Health Commentary. Health Affairs. 29: 405-410. |
| [19] | Franck, C. (2013). Agricultural Subsidies and the American Obesity Epidemic. American Journal of Preventive Medicine. 45:3:327-333. |
| [20] | Fields, S. (2004 October). The Fat of the Land. Do Agricultural Subsidies Foster Poor Health Environmental Health Perspectives. 112: 14: A820- A823. |
| [21] | Bittman, Mark. (2011 July). Bad Food? Tax It and Subsidize Vegetables. The New York Times. |
| [22] | Frisvold, George (2004 November). How Federal Farm Programs Affect Water Use, Quality, and Allocation Among Sectors. Water Resources 40: 12. |
| [23] | Opperman, Jeff (1996 April). The Impacts of Subsidies on Endangered Species. Camp Sherman, Oregon. The Thoreau Institute. |
| [24] | Ostria, M. (2013 August). How US Agricultural Subsides Harm and The Environment, Taxpayers and The Poor. Washington, D.C: National Center For Policy Analysis. 126: 1-4. |
| [25] | Organization for Economic Co-operation and Development (OECD). (2002). How Green is Farm Support?, OECD, Paris France. |
| [26] | United States Department of Agriculture (USDA). (2020). Various Years Census Data: County Highlights. DC, Washington. USDA, NASS. |
| [27] | Cook, C (2014). The Spraying of America. Earth Island Journa. 1-5. |
| [28] | Merem, E C. (2015). Assessing the Environmental Impacts of Farm Subsidy In the Mississippi Delta Using GIS. The 25th Annual AEHS Conference, San Diego, California: March 2015. |
| [29] | Merem, E. C. (2022 March). The Analysis of Climate Change Issues In Florida’s Southern Region. The 96th Annual Louisiana Academy of Science Conference. LSU Alexandria, LA. March 12th, 2022. |
| [30] | Merem, E. C. (2022 March). Assessing Climate Change Risks In The US Midwest Region’s Environment. The 86th Annual Mississippi Academy of Science Conference. Biloxi, MS. March 31-April 1, 2022. |
| [31] | Merem, E.C. (2020, March). Assessing The Risks From Changing Climate In South Texas Region. 94th Annual Meeting of The Louisiana Academy of Science (LASC). Louisiana State University -Alexandria, Louisiana, March 14, 2020. |
| [32] | Merem, E.C. (2021). Assessing the Risks from Changing Climate in South Texas Region, Resources and Environment, 11: 1: 18-34. |
| [33] | Merem, E.C. (2018). Appraising Variations In Climate Change Parameters Along The Lower West African Region. Journal of Safety Engineering, 7:1:1-19. |
| [34] | Merem, E.C. (2019). Regional Assessment of Climate Change Hazards in Southern Nigeria with GIS. Journal of Safety Engineering. 8:1: 9-27. |
| [35] | Britt, Megan L. (2002 December). Effects of Quality Considerations and Climate/Weather Information on the Management and Profitability of Cotton Production in the Texas High Plains. Journal of Agricultural and Applied Economics, 4:3:561-583. |
| [36] | Cooking Up a Story. (2012 January). Water Scarcity on the Texas High Plains: The Ogallala Aquifer (video). |
| [37] | Julene, Bair. (2011 December). Can the 2012 Farm Bill protect the Ogallala Aquifer?.Climate Justice. Grist Magazine. |
| [38] | Kay, Ledbetter (2015 December). Water Conservation Policy Effectiveness Depends On Farmer Economics. Online Available: http://www.sciencedirect.com/science/article/pii/S2212428415300128. |
| [39] | Tong, Wanga. (2015 October). Will farmers save water? A theoretical analysis of groundwater conservation policies. Water Resources and Economics. Online Available: 12: 27-39: //doi.org/10.1016/j.wre.2015.10.002. |
| [40] | Seong, Park. (2015 December). Water Conservation Policy Effectiveness Depends On Farmer Economics. Texas A&M AgriLife Research. |
| [41] | Merem, E. C. (2021). Assessing Hydraulic Fracking Issues in the US Southeast and Western Region, Energy and Power. 11: 1: 1-19. |
| [42] | Merem, E. C. (2021). Assessing the Risks from Changing Climate in South Texas Region, Resources and Environment. 11:1: 18-34. |
| [43] | Merem, E.C. (2021). Analyzing the Use of Genetic Modified Organisms (GMOs) in Agriculture in the US Midwest Region. Food and Public Health. 11: 1: 1-17. |
| [44] | Merem, E. C. (2021). The Regional Assessment of Groundnut Farmland Use in Northern Nigeria. International Journal of Food Science and Nutrition Engineering. 11: 1: 1-19. |
| [45] | Merem, E.C. (2020). Evaluating Geothermal Energy Potentials In The US Western Region With GIS. International Journal of Engineering. 10:2: 23-40. |
| [46] | Merem, E.C. (2020). Assessing Water Resource Issues Among States in the US Southeast Region. Marine Science. 8:1:1-23. |
| [47] | Merem, E. C. (2020). Analyzing Organic Food Farming Trends in The US Western Region. Public Health Research. 10:2: 41-57. |
| [48] | Merem, E. C. (2020). Exploring Cocoa Farm Landuse Trends in The West African Region. International Journal of Agriculture and Forestry. 10:1: 19-39. |
| [49] | United States Bureau of Census. (2020). Census Quick Facts. Washington, D.C: US Bureau of Census. |
| [50] | Texas parks and wildlife. (2018). Plant Guidance by Ecoregions Ecoregion 9 High Plains. Online Available: https://tpwd.texas.gov/huntwild/wild/wildlife_diversity/wildscapes/ecoregions/ecoregion_9.phtml. |
| [51] | Merem EC. (2022 March). Evaluating the Ecological Effects of Agricultural Subsidy in The North Texas Region. The 31st Annual International (West Coast) Conference on Soil, Water, Energy, and Air (AEHS). San Diego, CA. March 14-17, 2022. |
| [52] | Brian, Riedl. (2007 June). How Farm Subsidies Harm Taxpayers, Consumers, and Farmers, Too. Manhattan Institute https://www.heritage.org/agriculture/report/how-farm-subsidies-harm-taxpayers -consumers-and-farmers-too. |
| [53] | Environmental Working Group. (2019). Major Crops: North Texas County Data. DC. Washington EWG. |
| [54] | Smith, Johnnie E. (2018a). Texas Waters: Exploring Water and Watersheds. Texas Parks and Wildlife. Online Available: https://tpwd.texas.gov/publications/pwdpubs/media/pwd_bk_k0700_1931_watershed_curriculum.pdf. |
| [55] | Johnnie E. Smith. (2018b). Texas Waters: Exploring Water and Watersheds. Austin: Texas, The Texas State Publications Clearinghouse and/or Texas Depository Libraries. |
| [56] | The Texas Alliance for Water Conservation (2012). The Ogallala Aquifer of the Texas High Plains: A Race Against Time. SARE Outreach. Online Available: https://www.sare.org/resources/the-ogallala-aquifer-of-the-texas-high-plains-a-race-against-time/. |
| [57] | Brooke Barton (2014). Environmental Risks of Corn Production. Online Available: https://www.wbur.org/hereandnow/corn-environmental-risks. |
| [58] | White, Deborah. (2020 May). What Are U.S. Farm Subsidies? Some Say Corporate Welfare, Others Say National Necessities. Online Available: https://www.thoughtco.com/us-farm-subsidies-3325162. |
| [59] | Braxton, Jane Little. (2009 March). The Ogallala Aquifer: Saving a Vital U.S. Water Source. Scientific American.32-39. |
| [60] | USDA (2016). Improving Water Productivity and New Water Management Technologies to Sustain Rural Economies. Annual Report Soil and Water Management Research. Online Available: https://www.ars.usda.gov/research/programs-projects/project/?accnNo=422661&fy=2016. |
| [61] | Steward, D.R. (2015). Peak groundwater depletion in the High Plains Aquifer, projections from 1930 to 2110. Agricultural Water Management. 170: 2016: 36-48. |
| [62] | Wei, Jackie. (2013 August). Record-Breaking $17.3 Billion in Crop Losses Last Year; Significant Portion Potentially Avoidable Report Shows County-by-County Analysis of Impacts in the Ten States with Highest Crop Insurance Losses due to Extreme Weather: Chicago, IL NRCS. |
| [63] | Merem, E.C. (2020). Appraising the Changing Trends In Oil Palm Farming in Nigeria’s Lower South Region. International Journal of Ecosystem. 10:1: 1-22. |
| [64] | Merem, E. C. (2019). Assessing Water Resource Issues in the US Pacific Northwest Region. International Journal of Mining Engineering and Mineral Processing. 8:1: 1-19. |
| [65] | Merem, E. C. (2016). The geography of wind energy use in the mid-west region of the U. S. Journal of Energy and Power, 6:1:1-15. |
| [66] | Merem, E. C. (2016). Assessing the environmental impacts of agricultural subsidy in the Mississippi Delta region using GIS. International Journal of Agriculture and Forestry. 6:1:1-21. |

 Abstract
 Reference
 Full-Text PDF
 Full-text HTML