-
Paper Information
- Paper Submission
-
Journal Information
- About This Journal
- Editorial Board
- Current Issue
- Archive
- Author Guidelines
- Contact Us
International Journal of Agriculture and Forestry
p-ISSN: 2165-882X e-ISSN: 2165-8846
2021; 11(1): 1-8
doi:10.5923/j.ijaf.20211101.01
Received: Dec. 6, 2020; Accepted: Dec. 31, 2020; Published: Jan. 15, 2021

Ecological Potential and Estimation of Mangrove Forest Carbon Stock in Kabaena Island, Bombana Regency
 Abstract
 Reference
 Full-Text PDF
 Full-text HTML
Nur Arafah1, La Baco Sudia2, Abdul Manan2, Kahirun2, Sahindomi Bana1, Zulkarnain1
1Department of Forestry, Faculty of Forestry and Environmental Sciences, Halu Oleo University, Kendari
2Department Environmental Science, Faculty of Forestry and Environmental Sciences, Halu Oleo University, Kendari
Correspondence to: Sahindomi Bana, Department of Forestry, Faculty of Forestry and Environmental Sciences, Halu Oleo University, Kendari.
| Email: |  |
Copyright © 2021 The Author(s). Published by Scientific & Academic Publishing.
This work is licensed under the Creative Commons Attribution International License (CC BY).
http://creativecommons.org/licenses/by/4.0/

Mangrove forests are one of the factors that can contribute to suppressing climate change. The phenomenon of the function of mangrove forests changes has an impact on reducing the ability to absorb carbon in the atmosphere. Kabaena Island has a coastline length of ± 200 km which has several mangrove forest spots that are scattered around Kabaena Island with an area of ± 1500 ha. This study aims to determine the ecological potential and carbon stock of mangrove forests in Kabaena Island, Bombana Regency. Data were collected at 75 observation locations in the form of a combination of transects and plots. The research variables are: 1. The variables used to analyze ecological potential consist of diversity index, density, dominance, frequency, important value index and mangrove species. 2. The variable used to analyze the carbon potential of mangrove forests is the estimated value of the biomass content of each mangrove species obtained from calculations using allometric equations. The results showed the vegetation composition at the tree, sapling and seedling levels in Kabaena Island was composed of 9 species belonging to 4 families. The level of diversity at the research location is included in the medium category. Mangrove carbon stocks in Kabaena Island at the tree level reached 10,847.185 kg/ha; at the sapling level it reached 11,950,314 kg/ha and at the seedling level it reached 3,797 kg/ha.
Keywords: Carbon Stock, Ecological Potential Mangrove, Kabaena Island
Cite this paper: Nur Arafah, La Baco Sudia, Abdul Manan, Kahirun, Sahindomi Bana, Zulkarnain, Ecological Potential and Estimation of Mangrove Forest Carbon Stock in Kabaena Island, Bombana Regency, International Journal of Agriculture and Forestry, Vol. 11 No. 1, 2021, pp. 1-8. doi: 10.5923/j.ijaf.20211101.01.
Article Outline
1. Introduction
- The increase in greenhouse gas (GHG) emissions that is CO2, CH4, N2O, HFCs, PFCs, and SF6 as a trigger for global warming has become an international issue in the last two decades. Sukadri [45] states that the largest GHG concentration is found in the CO2, approximately 75% of the total GHG. The increase of GHG emissions is largely due to deforestation and forest degradation in developing countries as well as industrial emissions from developed countries [1].FAO [2] released data on total deforestation from 10 developing countries of around 8.22 million ha, of which 1.87 million of this area is deforestation from Indonesia. The rate of deforestation in developing countries is estimated to continue to increase [3], so that large-scale carbon sequestration is required to reduce CO2 emissions [4], especially in developing countries including Indonesia.World conference held in Bali at December 2007, placing mangrove forests is one of the factors that can contribute to suppressing climate change. The connection with climate change is the existence of mangrove forests as natural carbon sinks [5]. Mangroves can also store more carbon per hectare [6,7].Indonesia is one of the largest areas of mangrove forests in the world and rich in carbon content. About 3 million hectares of mangrove forests grow along 95,000 kilometers (23% of the world's mangrove ecosystems) [8]. Mangrove forests have the densest carbon content in the tropics. Store more than three times the average carbon per hectare of inland tropical forest [9]. Indonesia's mangrove forests store five times more carbon per hectare than upland tropical forests. It is estimated that Indonesia's mangrove forests store 3.14 billion metric tons of carbon [10] or equivalent to 1/3 of global coastal carbon stocks [11].Bombana Regency is one of the districts in Southeast Sulawesi Province which bloomed in 2003 which is divided into 22 sub-districts, including Kabaena Island. The length of the Kabaena Island coastline is ± 200 km which has several large spots of mangrove forest that are scattered around Kabaena Island. The mangrove forest has the potential to get pressure from human activities and development, especially because the coast is an area with a high level of economic activity. This has an impact on converted mangrove forests became very high for aquaculture [12,13,14,15], coastal port infrastructure [16], industry [17,18], housing [18], utilization of forest wood [9,18,19], and agriculture/plantation [20].Land functions changes that occur in mangrove areas to development areas or conversion of coastal areas have an impact on the ecosystem and zoning of mangrove forests [21]. The phenomenon of the function of mangrove forests changes, has an impact on reducing the ability to absorb carbon in the atmosphere. At the same time, carbon stored in mangrove ecosystems is decomposed through a process of decomposition into the atmosphere. This study aims to determine the ecological potential and carbon stocks of mangrove forests in Kabaena Island, Bombana Regency.
2. Methods
- This research was conducted from October to November 2020. The research location was in the mangrove forest of Kabaena Island, Bombana Regency, Southeast Sulawesi. The research location can be seen in Figure 1.
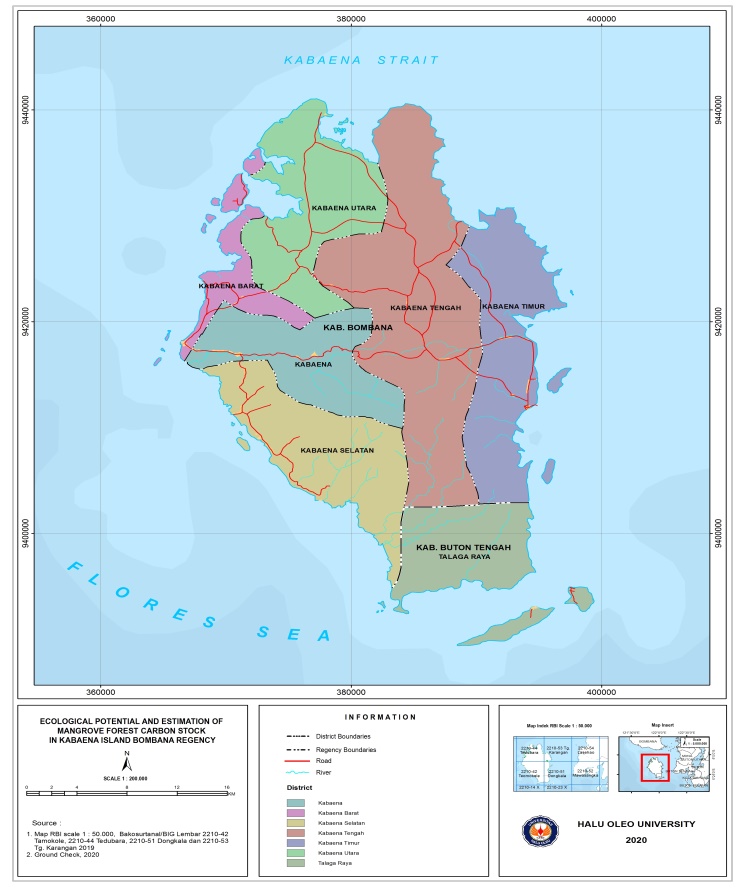 | Figure 1. Study Area |
 § Density;
 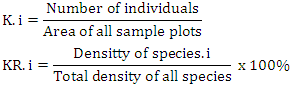 § Frequency
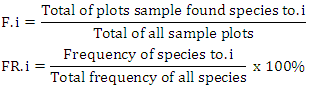 Total area cover LBDS = ¼ Π d2
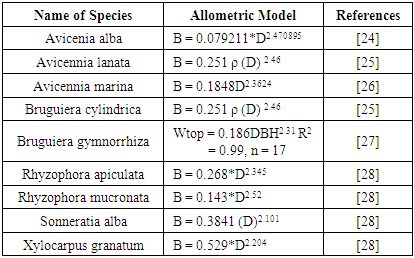
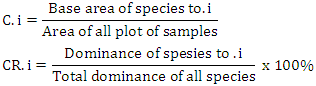 § Importance Value Index INP = KR + FR + CRINP-i = KR-i + FR-i + CR-i Potential of Mangrove Carbon Stock. Calculation of mangrove biomass in the field uses biomass estimation non-destructive (with allometric equations), this method does not damage the environment and can be implemented more quickly for a wider forest area.
|
3. Results and Discussions
3.1. Mangrove Ecological Potential
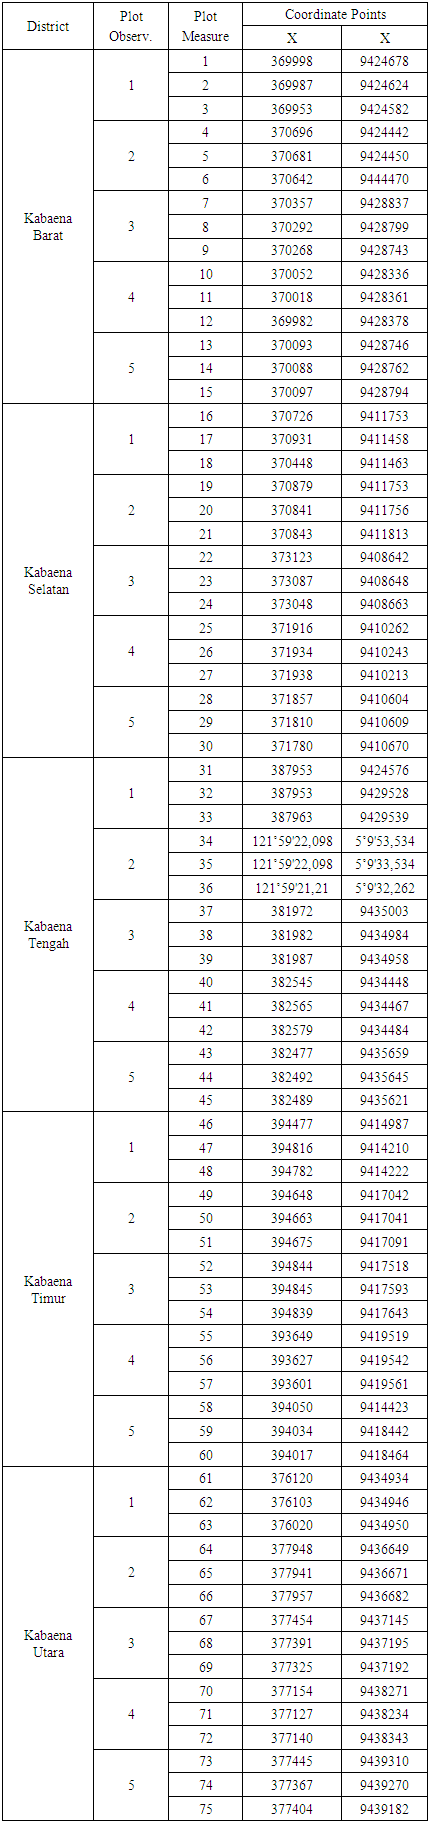
- The distribution of the sampling plots based on the results of the inventory at the research location, the types of individuals found were distributed at the tree, sapling and seedling levels which were the focus of observation in the study.In the implementation of field data collection in this study, measurements were carried out on 75 sample plots which were spread over five districts. Placement of sample plots was carried out by considering the principles of representation and field effectiveness. So that all mangrove areas on Kabaena Island can be represented. The following shows the distribution of the location of the sample plots in the study locations in Table 2.
|
|
3.2. Analysis of Mangrove Communities
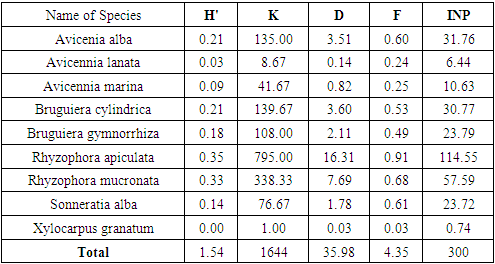
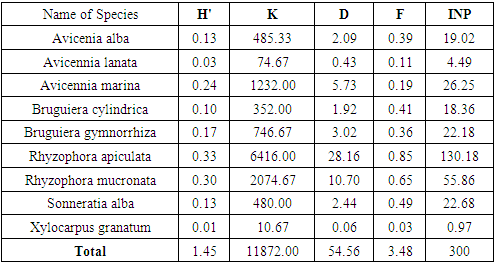
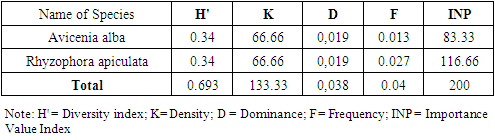
- The results of vegetation analysis at the growth rates of trees, saplings and seedlings are presented in Table 4, Table 5 and Table 6.
|
|
|
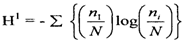
3.2.1. Diversity Index
- The results of the calculation of the index Shannon Wiener obtained the value of vegetation diversity (H ') at tree levels of 1.54 and saplings of 1.45 and seedlings of 2.29. Shannon-Wiener in [31] suggests that if the value of H '=> 3 indicates that species diversity is high, H' = 1 ≤ H '≤ 3 indicates diversity moderate, and H' = <1 indicates diversity low. Based on this classification, for the diversity index parameter, the species diversity at the research location is classified as criteria moderate.Indriyanto [17] states that species diversity can be used to measure community stability, namely the ability of a community to keep itself stable even though there are disturbances to its components. This concept is used to measure the ability of a community in a habitat to balance its components due to disturbances that arise [32]. Habitat stability is an important factor regulating species diversity [33].
3.2.2. Density
- The results of the vegetation analysis show that for all tree growth rates, saplings and seedlings are in the very dense category. At the tree level, the species density ranged from 1.00 - 795.00 ind.ha-1 with a total density of 1644 ind.ha-1. At the sapling level, the species density ranged from 10.67 to 6416.00 ind.ha-1 and the total density reached 11872.00 ind.ha-1. At the seedling level, the species density was 66.66 ind.ha-1-1 and the total density was 133.33 ind.ha -1. Decree of the State Minister for the Environment No. 21 of 2004 explains that the quality standard criteria for mangrove density are solid density ≥ 1,500 ind / ha, moderate ≥ 1,000 - 1,500 ind / ha and rarely <1,000 ind / ha.This gives an indication of the large number of individuals found in spatial unity in the research location, which means that the condition of the mangrove vegetation on Kabaena Island is still very good.Tables 4, 5 and 6 also show that the species with the highest density values at both the tree and sapling levels was Rhizophora apiculata. This indicates that this type is the type with the highest number of individuals as well as describing the type of character at the research location. The high density value also indicates a very good reproductive ability in this species. The high density of mangrove vegetation indicates that the vegetation community is in an undisturbed condition.
3.2.3. Dominance
- In the aspect of dominance, of the 9 species found in the study location, there are 3 species at the tree level and 2 species at the sapling level which have a dominance value of less than 1 m / ha. This shows that overall the species found in the study location generally have a fairly large diameter.At the tree level and sapling level,species Rhizophora apiculata had the highest growth rate dominance values, namely 16.31% and 28.16%. This is because Rhizophora apiculata can compete to obtain more nutrients than other types so that the growth of the stems becomes bigger and the canopy is broad. This indicates that this species has the most space occupation compared to other species in the study location which is indicated by the large size of the stem diameter in that species. The dominant species are those that can utilize the environment they occupy more efficiently than other species in the same place. The dominance of mangrove species is different from each type. The larger the stem size will expand its dominance, and vice versa. Species that have a relatively low dominance value reflects their inability to tolerate environmental conditions.
3.2.4. Frequency
- Frequency provides information about the distribution and adaptability of each type of mangrove in the research location. The species at the tree level as a whole are in the very low to very high frequency range (3% - 91%). At the sapling level it is also in the very low to high range (3% - 85%). However, the seedlings were in the very low frequency range (1.3% - 2.7%). The classification proposed by Raunkiaer in Indrianto[23], class A (0 - 20%) is very low, class B (21 - 40%) is low, class C (41 - 60%) is moderate, class D ( 61 - 80%) is classified as high, and class E (81 - 100%) is classified as very high.The highest frequency at tree and sapling levels was Rhizophora apiculata with the percentage of frequency values, respectively, 0.91% and 0.85% (in the very high frequency range). This indicates that this species is the species with the highest adaptability and the widest distribution in the study area. The other 8 types are in the low to high frequency range.This is due to the distribution of Rhizophora apiculata seeds evenly in each zone and the ability of the seeds to survive in the environment is better than the ability of other mangrove species. Pramudji [34], stated that the mud and soft ground covered by mangrove species Rhizophora apiculata, Rhizophora mucronata, Lumnitzera littorea with uniform distribution and wide. Bengen [35] also argues that the specific life cycle of the mangrove species (Rhizophora sp) with seeds that can germinate while still in the parent plant greatly supports the broad distribution process of this species in the mangrove ecosystem. Ferianita [36] states that frequency is used as a vegetation parameter which can indicate the distribution or distribution of plant species in the ecosystem. The frequency value also shows the adaptability of the species to environmental conditions. This is in line with the opinion of Djoko [37] that the distribution of plant species in the community is a different response from these species to differences in micro-habitats.
3.2.5. Importance Value Index
- The structure of the mangrove vegetation community can be determined by determining the importance value index and diversity index of the constituent mangrove forest communities. Importance value shows the importance of a plant species whether or not it affects the community and ecosystem [38]. Based on the analysis of the Importance Value Index (IVI) at the tree, sapling and seedling levels, the mangrove species Rhizophora apiculata occupied the highest percentage value compared to other species, respectively, namely 114.55%, 130.18% and 116.66%. [33] that a species is said to play an important role in the ecosystem if the INP value => 15 (on tree and pole size) and the INP value => 10 (sapling and seedling levels). Prasetyo [39] explains that mangrove areas that have importance value index high that the mangroves in the area are in good condition and have not changed, on the other hand, if this condition is reduced or turned into land due to sedimentation and damage due to human activity, rehabilitation is necessary so that it is balanced maintained ecosystem.In terms of the effect of species on the ecosystem, at the tree level there are 6 species that show a strong influence in the community, namely these species have an IVI value of 15. These species are Avicennia alba, Bruguiera cylindrica, Bruguiera gymnorrhiza, Rhizophora apiculata, Rhizophora mucronata and Sonneratia alba. For sapling level, there are 7 species that show a strong influence in the community, namely species that have an IVI value of 10. These species are Avicennia alba, Avicennia marina, Bruguiera cylindrica, Bruguiera gymnorrhiza, Rhizophora apiculata, Rhizophora mucronata and Sonneratia alba. As well as the level of seedlings, species Avicennia alba and Rhizophora apiculata show strong influence in the community.This illustration shows that at the research location, these species are very important in maintaining the stability of the mangrove ecosystem. This is because these species are relatively abundant compared to other types, have greater adaptability and distribution capacity and relatively greater control of space than other types. If there is pressure on these species, the stability of the mangrove forest community will be disturbed. Plants with high IVI have better adaptability, competitive power and reproductive capacity than other plants in a certain area. A low IVI indicates that these species have the potential to disappear from the ecosystem under stress due to their very small numbers, low reproduction and narrow distribution.
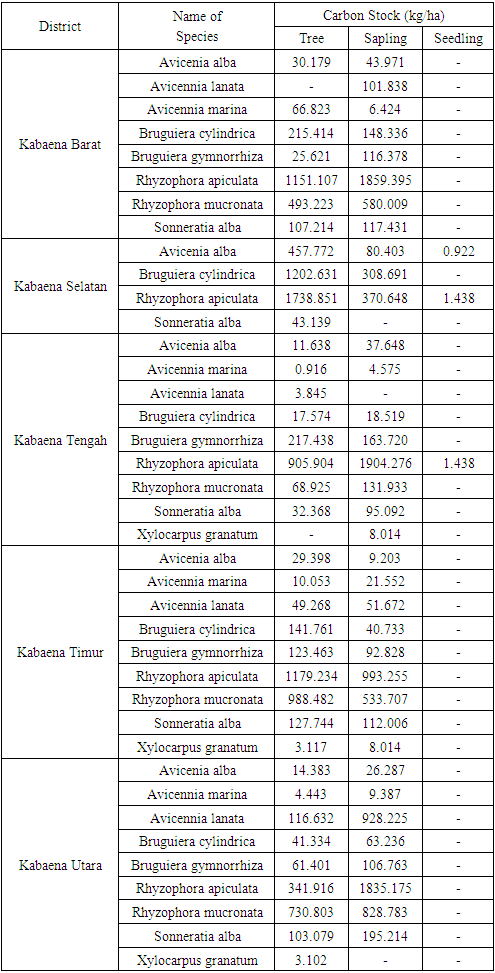
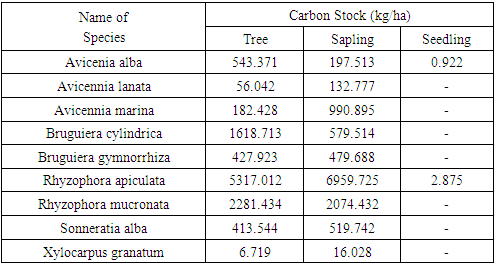
3.3. Analysis of Mangrove Carbon Stocks
- Carbon stores describe how much a tree stores carbon. The size of the carbon storage depends on the amount of biomass contained in the tree [40]. Through the process of photosynthesis, plants absorb CO2 in the air as raw material for photosynthesis and will be converted into biomass stored in plant parts. This study uses the value of carbon stock from the measurement of tree trunk biomass converted to organic carbon. Carbon stock in mangrove forests at sapling level reaches 11,950,314 kg / ha and at seedling level reaches 3,797 kg / ha. The results of the calculation of mangrove carbon storage are presented in Tables 7 and 8.
|
|
4. Conclusions
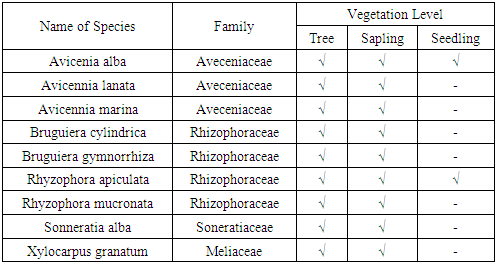
- The results of the study concluded that the vegetation composition at the tree, sapling and seedling levels in Kabaena Island was composed of 9 species belonging to 4 families. Family Rhizophoraceae and Aviceniaceae is the family with the largest number of species. Avicennia alba, Bruguiera cylindrica, Bruguiera gymnorrhiza, Rhizophora apiculata, Rhizophora mucronata and Sonneratia alba are species with strong influence in their ecosystem. The level of diversity at the research location is included in the medium category. Mangrove carbon stocks in Kabaena Island at the tree level reached 10,847.185 kg / ha; at the sapling level it reached 11,950,314 kg / ha and at the seedling level it reached 3,797 kg / ha.
ACKNOWLEDGEMENTS
- Thanks to the Institution for Research and Community Service, Halu Oleo University, for financial this research through the UHO DIPA Fund 2020.