International Journal of Agriculture and Forestry

p-ISSN: 2165-882X    e-ISSN: 2165-8846

2020;  10(1): 1-10

doi:10.5923/j.ijaf.20201001.01


Water Use Efficiency of Smallholder Farmers’ Irrigation Scheme and Its Consequences on Lake Hawassa

Yadeta Teshome Negasa

Lecturer at Wondo Genet College, Ethiopia

Correspondence to: Yadeta Teshome Negasa, Lecturer at Wondo Genet College, Ethiopia.

Email:

Copyright © 2020 The Author(s). Published by Scientific & Academic Publishing.

This work is licensed under the Creative Commons Attribution International License (CC BY).
http://creativecommons.org/licenses/by/4.0/

Abstract

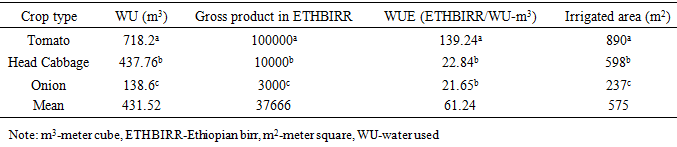
The research was conducted in Hawassa watershed around Lake Hawassa during 2019. Cultivation near the lake and over-pumping of Lake Hawassa water for irrigation has initiated the research. Analysis of smallholder farmers’ irrigation schemes WUE and its consequences on Lake Hawassa were the objectives addressed. Regular field observations into irrigation schemes and measurements’ made into WUE indicative parameters while smallholder farmers’ irrigate their crops has been generated the core research data. Water applied into the field and moisture stored in the soil both before and after irrigation was determined empirically and gravimetrically. Additional data regarding socioeconomic aspects of irrigation was collected from focus group discussion. Excel Microsoft word, CROPWAT 8 and ArcGIS were used to analyze data, and produce figures. The soil texture of the study area was dominated by sandy loam with large percolation loss of water resulted in poor application efficiency. The irrigation water pumped was three-fold higher than the required. Overall irrigation scheme efficiency was very poor (38%). Chemicals used for crop growth and healthy purpose were washed into the lake during the rainy season with sediments carried on from upper cultivated lands. Therefore, to prevent lake water from deterioration the irrigation water sources should be replaced by harvested water or/and well water. If not a mode of water application needs to be modified into drip irrigation. For these the government body and NGOs should be aware the smallholder farmers about problems of irrigation on the lake and provide all the necessary support to sustain it.

Keywords: Dependency on lake water, Poverty, Furrow method, Over-pumping, WUE

Cite this paper: Yadeta Teshome Negasa, Water Use Efficiency of Smallholder Farmers’ Irrigation Scheme and Its Consequences on Lake Hawassa, International Journal of Agriculture and Forestry, Vol. 10 No. 1, 2020, pp. 1-10. doi: 10.5923/j.ijaf.20201001.01.

1. Introduction

Lake Hawassa is one of the Ethiopian main rift valley lakes over which precipitation is the only fresh water very limited to certain months. Access to sufficient water for irrigation is the basic need that affects socio-economic enhancement and expose the lake to pollution (Worako, 2015). Food shortage which made survival of farmers complex have resulted due to dense population derived by small landholding, irregularity and total dependency on rainfall and lack of perennial stream flow has initiated intensive use of Lake Hawassa water for supplemental irrigated agriculture. Irrigation based agriculture especially smallholder farmers’ schemes are the top users of water (Howell, 2001). Prevalence of drought, sedimentation in natural lakes of Ethiopia due to intensive cultivation around the lakes has been affecting capacity of lakes (Alemayehu et al., 2007.); chronic poverty prevailing in sub-Saharan Africa needs promising use of irrigation (Gebrehiwot and Gebrewahid, 2016). The overriding problem shall be total dependence on agriculture, intensive cultivation near the shore lake, losses/misuse of irrigation water and lack of knowledge/advice. These problems are aggressive to bring farreaching negative effect on water users and overall development of the country.
Smallholder farmers’ of developing countries (definitely Ethiopia) are highly dependent on natural resource exploitation in destructive ways. Water in the lake and adjacent lands (lake shores) are the main resources under pressure. Now a day irrigation water scarcity is the main concern for more portions of Ethiopian surface dry land. Extraordinary pressure is exerted on available water resources due to increasing demand for food (Howell, 2001, Golzardi et al., 2017 and Teshome et al., 2018). Thus, even if over-pumping of lake water was not recommendable for adjacent land cultivation; efficient water use and sufficient buffer zone were very crucial in study area. Onion, head cabbage and tomato are among vegetables being produced around the lake as to most Ethiopian irrigated lands as source of income and food at different levels (Hunde, 2017). Natural lakes and rivers were the pillar water supply sources for irrigated agriculture. Rising demand for water and over-pumping of lake water will lead to diminishing in lake water quantity, deteriorated food security and constrain economic development (Alemayehu et al., 2007).
WUE of irrigated agriculture in most cases were enhanced by on-farm irrigation technology. Reduced irrigation water loss and increased WUE sustains water supply potential of the water sources. Agriculture consumes more than eighty percent of the worlds developed water supplies (Howell, 2001). Even if underground pipes were used to transport water into farm land mode of water distribution within the field strongly enhances water loss. Thus, it was said that gravity based traditional schemes has only 40% efficiency (Seckler, 1996); which means that 60% of diverted water was lost with related consequences. WUE contain any measure that reduces the amount of water used per unit of any given activity (Gebremariam et al., 2018 and Hamdy, 2007). WUE has been major challenge in irrigation scheme. Sustainable water supply technique and effective watering approaches are pressing need (Taddese and Peden, 2001 and Teshome et al., 2018). Adequate dosage of irrigation water maximize crop production and rise WUE for future purposes (Taddese and Peden, 2001) with the aim of keeping water level in the root zone within a range where crop yield and quality are not damaged due to either inadequate or excess watering. Thus, capable use and appropriate allocation of irrigation water are energetic for durability of cultivation in water scarce areas. However, irrigation water use has been dared by many factors including quantity and accessibility of water, types of crop grown, struggle in sharing water and mode of application. Therefore, the research was aimed to address the following objectives:
× To analyze (crop water requirement) CWR of more commonly produced field crops by CROPWAT 8.
× To determine supplemental irrigation WUE at smallholder farmers level located around Lake Hawassa thorough water measurement at pipe outlet and field inlet points across areas, water delivery potentials of the scheme and output of the scheme
× To determine selective physical properties of soils whether it contributes for water loss and irrigation inefficiency.
× To examine consequences of irrigated agriculture on Lake Hawassa.
× To execute socioeconomic aspects of irrigation water used via focus group discussion (FGD) encompassing development agents and irrigators located across Lake Hawassa.

2. Methodology

Description and irrigated map of study area
The area under supplemental irrigation is located towards the western side of Lake Hawassa and Hawassa city figure 2. It is closely adjacent unto the lake which means no buffer zone in between the two. Geo referenced GPS points overlaid on google earth has utilized to generate study area map and related data. The overall perimeter of the lake was 53235 m. Body contacts of features such as irrigated land, Hawassa town (settlements), natural features (forests, mountains) boundary in touch with the lake were 29665, 13956 and 9614 m respectively. The core point of this research, irrigated land is bordered with the lake shore line by about 56%. Such kind of proximity has created everlasting opportunity for surrounding smallholder farmers’ and investors of ease Lake water pumping using motor with buried pipes unto irrigated lands.
Weather data analysed over fifteen consecutive years indicated that areas near Hawassa city receives mean annual temperature of 19.79°C and mean annual precipitation of 944 mm per year. The study area has three major seasons. The first is long rainy season occurs between June to September called summer with annual total precipitation 50-70% locally called kiremt. Second is dry period that happens in between October and February locally called bega and the third is short rainy season takes place during March and May locally called belg when 20-30% of the precipitations occur (Halcrow, 2010). Mean monthly precipitation between April and September be beyond 105 mm with 128.8 mm in August and the lowest precipitation occurred in November, December, January and February. figure 1.
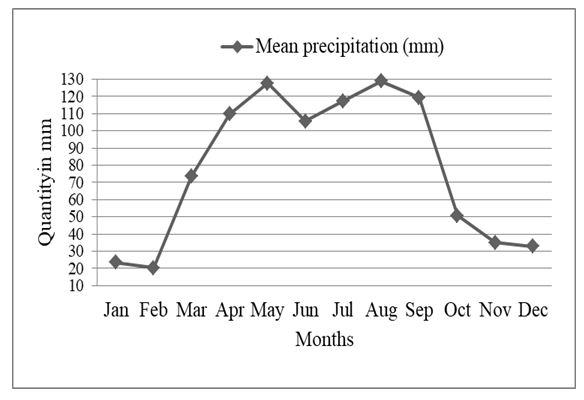
Figure 1. Monthly precipitation averaged over 2000-2015 at Hawassa watershed
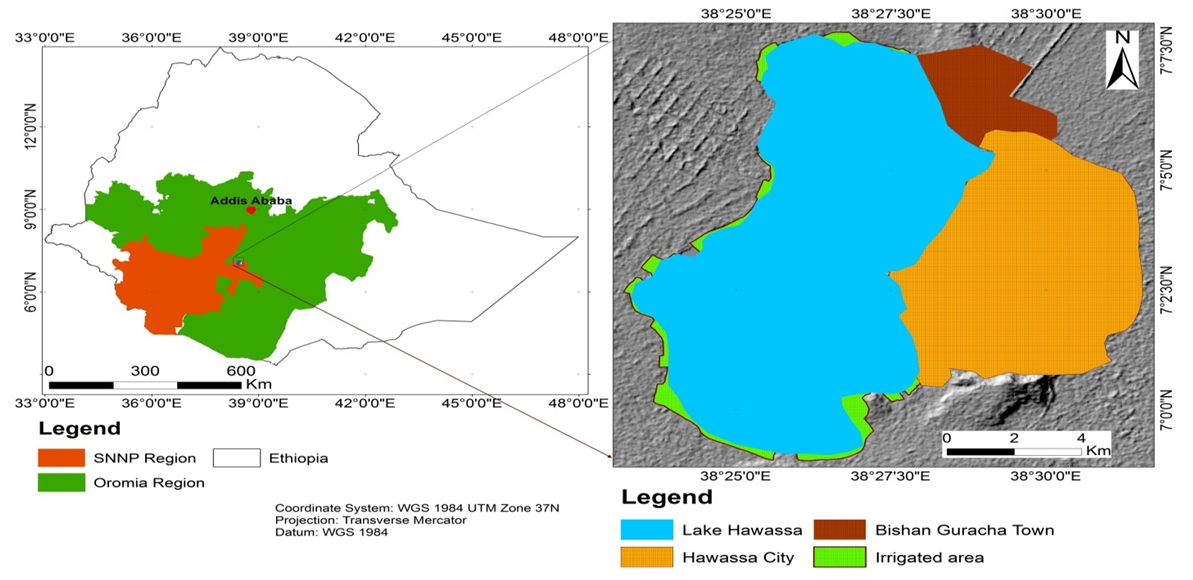
Figure 2. Irrigated and study area map
Data collection techniques and analysis
Initially, field observation conducted unto irrigated lands near Lake Hawassa has identified water source for irrigation, mode of water application and main crops grown in the area. Soil, weather, crop and water data is among the biophysical parameters investigated. Soil samples were collected from 0-15 and 15-30 cm depth vertically through transect pass and compiled at each point and taken for laboratory work. In accord of these, representative soil samples collected have been used to determine moisture stored in the root zone (before and after irrigation), texture, bulk density and irrigation WUE parameters (Howell, 2001, Brady and Weil, 2002, Horst et al., 2005). Soil sample collection from the indicated depth and thoroughly mixing for a particular sample point has been done both before and after irrigation. Near the soil sampling pit undisturbed soils were taken for bulk density determination. The tomato, onion and head cabbage were the main field crop types in the cultivation by smallholder farmers’ near the lake. Generally 36 soil samples were collected using core sampler using the plastic bag. The scientific method developed by (Brady and Weil, 2002) was used for soil sampling and data analysis. The areas under irrigation were determined using GPS points and GIS interface. CROPWAT 8 and Excel Microsoft word was used for data analysis. Irrigation time, amount and frequency have been recorded while farmers exercise watering of crops. For soil water contents determination, gravitational method was used as suggested by (Ali, 2011). Buried pipes were used to deliver water from the lake into the field. Dimensions of the channels near the field were noted, and water applied into the field has been measured at the inlet into the field. Regular observations and measurements have been made on the selected parameters including channel discharge, and irrigation practices as indicated by (Ali, 2011). Specifically the following irrigation scheme efficiency indicators have been used.
(1)
Where Ec is conveyance efficiency (percent)
Q1 is water flowing into the system (m3/s)
Q2 is water flowing out of the system (m3/s)
(2)
Where Ea was irrigation water application efficiency in percent; WZr was irrigation water stored in the root zone in m3, WF was irrigation water applied to the field in m3
(3)
Where, Ed = Water distribution efficiency in %; D = Mean depth of water stored during irrigation (m3); d = Average of the absolute values of deviations from the mean (m3)
(4)
Where Es is surface irrigation scheme efficiency in percent; Ec is conveyance efficiency in %.
Most powerfully WUE determination using economic yield has got popularity among many irrigation practitioners. For instance for the specific region and to identify difference between irrigation methods and irrigation management experienced practitioners can use the following equation as to (Howell, 2001).
(5)
Where Pe was effective precipitation, SW was the soil water depleted from the root zone during crop growth period and I stand for irrigation water applied into the field. In doing so water lost thorough runoff out of irrigated area, ground water use and percolation neglected.
Frequencies of irrigation water application shall be in accordance with crop water demand, and it was calculated as to (FAO, 1977).
(6)
Out of the different techniques that have been developed to investigate the soil moisture content, the gravimetric method was used (Walker, 2003). After laboratory analysis of 150 gm soil sample, the soil moisture content was calculated as a percentage of dry weight of the soil samples (FAO, 1989, Kamara and Haque, 1991).
(7)
Where: - 
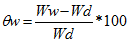
soil water content on a dry weight basis in % Ww - wet weight of the soil, gm; Wd - dry weight of the soil, gm.
The weather data collected form national meteorological agency encompasses precipitation, relative humidity, sunshine hours, wind speed, minimum and maximum temperature on daily bases has been analyzed by CROPWAT 8. Various methods have been developed to compute reference crop evapotranspiration. Thus, the most accurate and complex method was the Penman-Monteith method as presented by (Allen, 1986). Radiation and advection are both considered in the method. Studies have shown that the Penman-Monteith method is more reliable for any length period than methods that use less weather data (Jensen et al., 1990). The method works well for daily calculations and for estimating monthly or seasonal water needs. The crop coefficients were assimilated from (FAO, 2006).

3. Results and Discussions

Physical properties of soils near the Lake
Soil sample analysis conducted in Wondo Genet College of Forestry and Natural Resources laboratory has generated indicative soil physical properties. Texture, soil moisture and bulk density of soils were determined that such properties potentially show whether irrigation water loss and inefficiency exists. Irrespective of soil textural class the soil moisture across crop types and within the crop were different figure 3. Comparatively slight consistent moisture content was observed under tomato crop due to the fact that good basal area coverage and leaf fall which minimizes evaporative water loss than onion and head cabbage. Sandy loam subjected soils have low water holding capacity than other textures (Howell, 2001 and Teshome et al., 2018). Bulk density of such soils shows similarity across crop types. Uniformity in bulk density values has been reflected more due to similarity in soil textural classes (75% of the total samples is sandy loam) figure 3. Dominance in sandy loam shows low moisture content with high percolation losses in the study area.
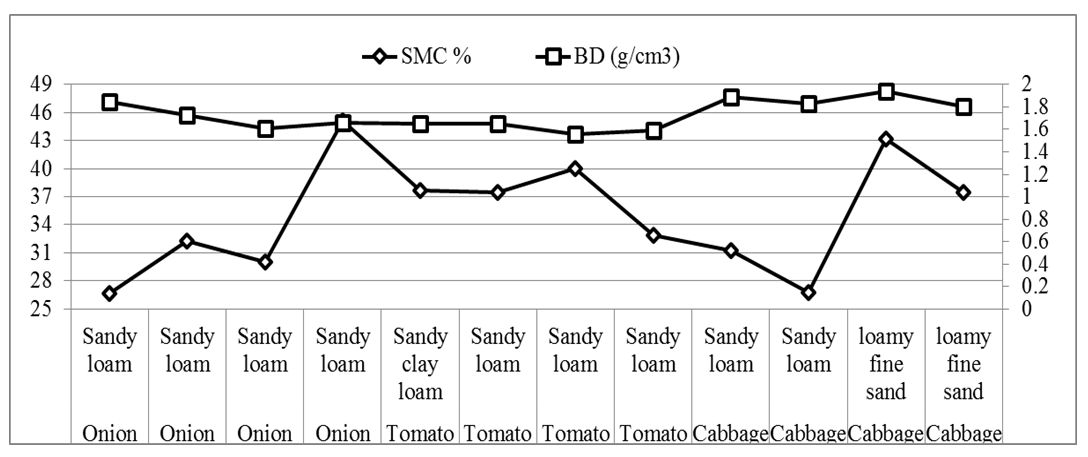
Figure 3. Physical property of soils in study area
CWR of More Commonly Produced Field Crops near Lake Hawassa
Rain-fed crop production is very common practice in study area. As derived by dry spell and rainfall insufficiency supplemental irrigation had got popularity in the study area. Artificial water application is very suitable as it is controllable and available. For the sake of better production and keep sustainability of the available lake water fixation of water dose per CWR was very essential than ever before. By applying CROPWAT 8 CWR of most commonly produced field crops (tomato, head cabbage and onion) were determined. CWR per crop type were 158, 267 and 246 mm/decade for tomato, head cabbage and onion respectively figure 4. The mean CWR of similar vegetation was 224mm/decade. CWR of the tomato was less than the other crops due to variation in planting time which means tomato has stayed in the field during the highest rainy season. Volume of water required to bring crops into maturity were 140.62, 159.66 and 58.3 m3 for the tomato, head cabbage and onion respectively. Mean volume of water required across the lake for such similar vegetation was 358.6m3. The overall volume of water required to bring such like vegetation into harvesting stage on irrigated areas around the lake figure 2 was 1,294,339m3. This was the right quantity of irrigation water to be applied onto the crop during the indicated period on figure 4 excluding conveyance and application loses figure 8.
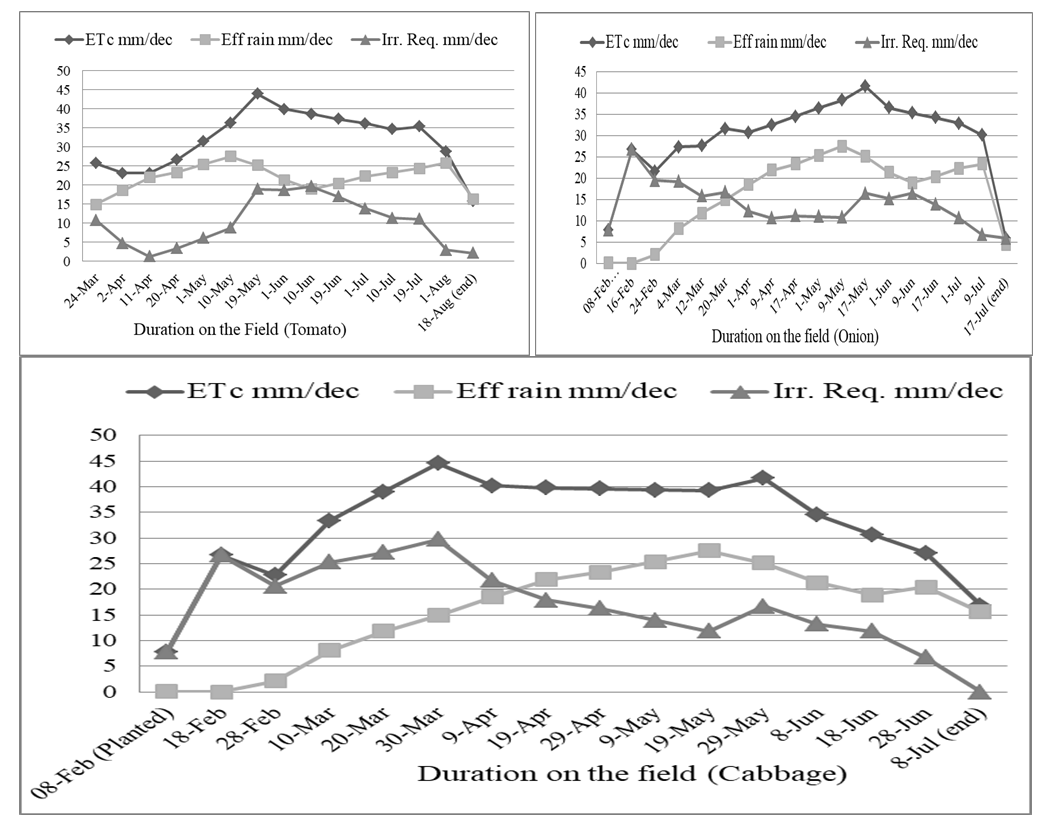
Figure 4. CWR of field crops using CROPWAT 8 in study area
Historical Practices of Irrigation Schemes at Smallholder Farmers’ Level in study area
As to watershed approach Lake Hawassa is located at the lower stream; at which sediment buildup is very common. Prevalence of scattered trees (acacia), Enset (Enset ventricosum) and fruit crops (avocado) has initiated silt deposition next to ground elevation to some extent. Porous top soil detected while soil sampling has confirmed that topsoil of the study area was soils of the upper watershed carried on through soil erosion occurred of overland flow/flooding during the rainy season. Lake Hawassa watershed is positioned in central rift valley which is experienced by dry and hot climatic condition. Even though the watershed receives rainfall twice per year, intra-seasonal and annual drought spells are very common. Total dependency on traditional rain-fed agriculture and lack of other income sources had influenced them to intensively pump lake water. Smallholder farmer number is increasing over time indicating high demand for food from agricultural field crop production. Initially irrigated crop productions were begun by Hajira Beyene (pioneer female irrigator) during 1989EC. A year later two farmers namely Rasa Torba (dead) and Ingida Shafo had engaged into the system. Fetching and watering were the mode of water application at that period. The practices were on lands around the home not in open fields. Decades ago irrigation practice commenced near Lake Hawassa has got popularity following lack of food/poverty as influenced by population density, total dependency on natural resources. Following raise of food demand lake water pumping were intensified more during 2000EC. Now a day there were strong linkage exists between irrigation practice and smallholder farmers’ livelihood as a matter of survival shown by FGD and agricultural office documents.
Lake Hawassa water was the only irrigation water source for irrigators devoted on supplemental irrigation. Physical observation into the area (motor pumps implemented at lake shores), farmers’ FGD and documents from local agriculture office has been confirmed that Lake Hawassa has been the only irrigation water source so far.
The pipes buried underground received pumped water from the motor installed at lake shore and supplied into above ground or surface tubes indicated on figure 5. The scheme irrigation water conveyance losses during transportations were highly minimized. Lined channels or pipes lessen the water loss up to 5% (Ali, 2011). In view of such fact conveyance efficiency of the stallholder farmers’ irrigation scheme was 95%.
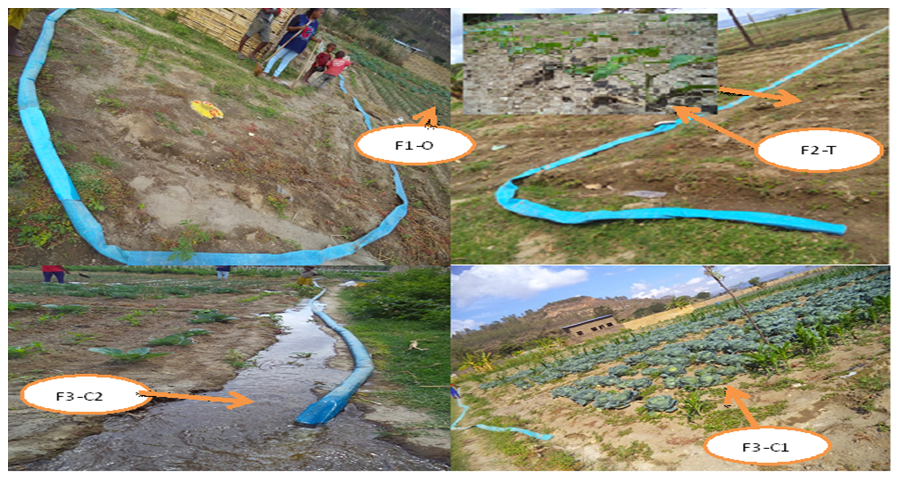
Figure 5. Irrigation water delivery scheme from Lake Hawassa
Irrigated area around the lake is located beyond the water level. Due to these irrigators were using the motor to pump water for irrigation. The smallholder farmers’ motor pump and pipe dimensions were similar. As influenced by pipe size the flow rate/discharge applied into the fields were similar across three crop types. As it was owned by different farmers’ the irrigated land size per crop type were different figure 6.
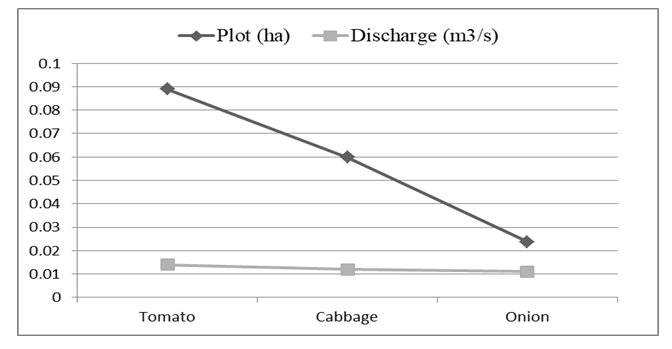
Figure 6. Irrigation water application rate as practiced by farmers
Furrow method of infield irrigation water distribution is the only way of water application for the smallholder farmers devoted on irrigated agriculture in the study area figure 7. The technique was one of the best surface irrigation methods if properly managed by irrigator. Furrow irrigation method only waters one-fifth up to half of the irrigated land surface. Therefore it results in less soil pudding, lower water loss through evaporation as well as permission of irrigated land cultivation sooner after irrigation (Kumar, 2014). However as a matter of practicability even ridges have been saturated indicating over watering by irrigators’ figure 7.
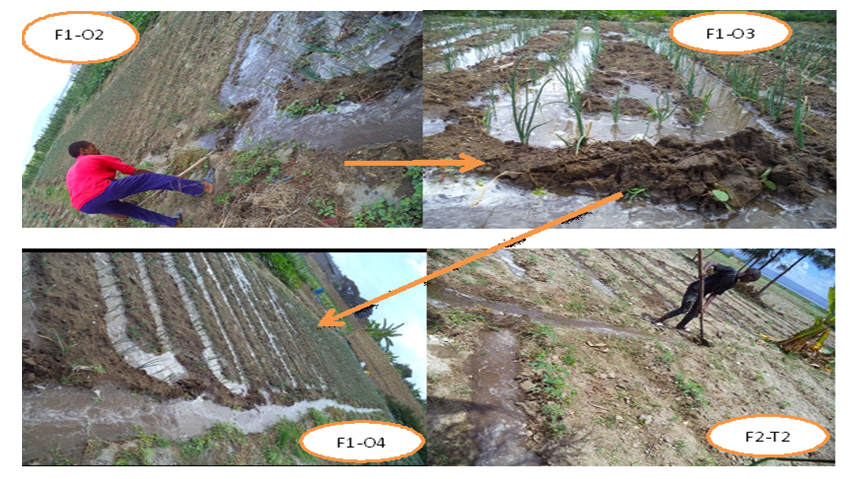
Figure 7. Infield irrigation water distribution as practiced by smallholder farmers’
Irrigation WUE as Exercised by Irrigators in study area
Worrying about irrigation WUE can potentially give directions of solving consequences and futurity of the system. While irrigators’ water the crops onsite water-flow velocity and width measurements were conducted to calculate discharge into the field. Soil moisture content due to irrigation has been investigated figure 3. Following water flow rate and soil moisture determination irrigation water application and distribution efficiency were calculated for the mainly produced field crops. Distribution efficiency for the tomato, head cabbage and onion were 93, 84 and 81% respectively on average bases figure 8. The general distribution efficiency of the furrow irrigation methods as to irrigators in study area was 86%. This highly influenced by over irrigation. The mean application efficiency of the furrow irrigation techniques on the tomato, head cabbage and onion land has been 69, 38 and 35%. The overall application efficiency across irrigators of the study area was 47%. Since water holding capacity of the dominant soil texture was less, the large water applied were being lost in different ways rather than stored in root zone for crop growth. That was why the scheme application efficiency less than half (Howell, 2001 and Teshome et al., 2018). The overall surface irrigation scheme efficiency was 38.4% which mean that irrigation water loss was very large indicating need for scheme improvement.
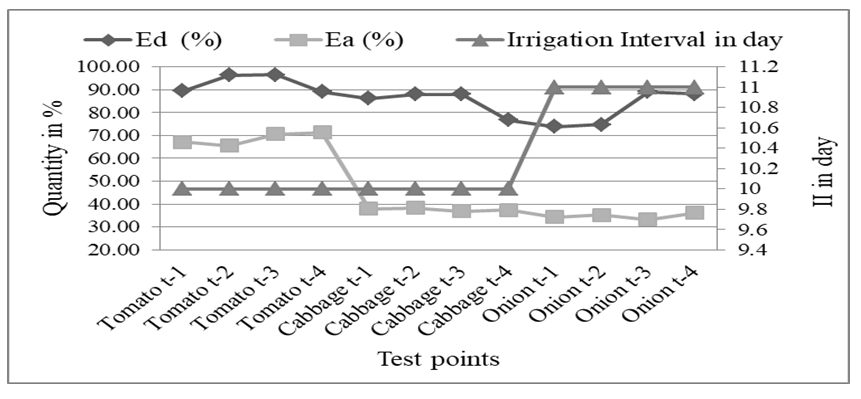
Figure 8. Irrigation water use efficiency
Economic yield Based Irrigation WUE in study area
The economic yield based irrigation WUE of the furrow watering method was determined. Difference in productive capacity as influenced by crop type, volume of water used and size of irrigated land was resulted in different WUE Table 1. Areas occupied by irrigation for tomato, head cabbage and onion were 51, 35 and 14% proportionally. Volume of water consumed has been 55, 34 and 11% for the tomato, head cabbage and onion comparably. These imply that large irrigated area consumes large volume of water (Howell, 2001). Enormous difference in gross product (in Ethiopian birr) was due to variation in productive capacity of the crops. Even if irrigated area and volume of water used was different across crops type WUE of the tomato was much better than others; which had been being prioritized it as a first chose by irrigators in terms of areal coverage.
Table 1. Economic yield based irrigation WUE
     
The saturated furrow channel has been drained after 15 minutes since inlet of irrigation water into the field figure 9. Percolation losses of water for sandy dominated soils were large and fast which favors less water holding capacity. Dry portions of irrigated land were appeared following quick evaporation and percolation of ponded water. Such soils need less volume of water but with frequent application that based on CWR (Howell, 2001 and Teshome et al., 2018).
Figure 9. Moisture condition soon after irrigation water cutoff
Water exploitation of smallholder farmers’ irrigation scheme on Lake Hawassa
Water abstraction for supplemental irrigation gets intensified during the dry period of the year figure 4. Even though study area receives rainfall twice per year in varied amount; crop production highly needs supplemental irrigation. For two decades the slightly emerged irrigated agriculture has acquired popularity for poverty minimization derived experience sharing among dwellers around the lake. There was no question on economic contribution of the scheme; but as a matter of water application technique and quality of irrigators more water has been applied beyond crop demand and area limit; even soil texture and water holding capacity character not recognized never go with the practice. As to Table 1 mean volume stands for average quantity of water applied across crop type; which was about 431m3 on 575 m2 of land (approximately 0.75m3/m2). The overall irrigated land across the lake was 5,778,300 m2 figure 2; multiplying this area by 0.75 gives the overall water consumption of the supplemental irrigated agriculture. The water pumped from the lake was 4,333,725m3 per irrigation season on average bases. The right amount of irrigation water expected for pumping into the crop was 1,294,339m3 excluding conveyance loss (less in this study) and application losses. The difference between volume of water applied into the field and CWR prior to irrigation was 3039385.8m3. Proportionally more than 70% of Lake Hawassa water was pumped over; only about 30% of 100% was applied into the field for crop production. This implies that huge amount of water had been being pumped due to irrigation. Therefore the existing irrigation practices (furrow irrigation) were resulted in losses of water by about three-fold of CWR in the single base period of the crop.
Socioeconomic contribution of the smallholder farmers’ irrigation scheme in study area
The FGD made have been explored socioeconomic aspects of smallholder farmers’ irrigation scheme. The overall condition of the aspect indicated that strong linkage existed among the scheme and socioeconomic of the smallholder farmers’ around Lake Hawassa. Individuals in the FGD had debated on the checklists prepared regarding socioeconomic aspects of irrigation and their discussion was presented as follows.
Most of the smallholder farmers’ (65%) had started irrigation practice during 2000EC but some (35%) had begun in 2007EC. The engagements into irrigation practice were purpose based. The driving factors that initiated irrigators were to have day to day food; to survive; life relies on it; to modify livelihoods. Even if the watershed receives rainfall twice per year it was insufficient and unevenly distributed. The dry period dominates over the area and irrigators lack rainfall when crops need moisture. The practice was supplementary irrigation. Portions of moisture demand were being in place thorough rainfall while the remaining is via irrigation. Most of the time CWR was satisfied by lake water pumping. Harvesting production frequency is highly dependent on crop type and management interventions. Field crop productions were three times per year while vegetables with three months base-period cultivated. However currently since the tomato, head cabbage and onion stay about five months in the field to be matured; productions were twice per year. Tuber and non-tuber vegetation’s sometime corn and potato have been the succeeding plants. Engagement into irrigation practices has resulted in harvest of initiative benefits per season per individual. In doing so, beyond home consumption demand irrigators were supplying the local market from products through mediators. The production was condition based; it may be air condition or pests and diseases. If conditions allow and good management practices in place from sixteen square meters of plot two boxes; each weighing 60kg (120kg/16m2) product were harvested. Currently from 890m2 plot covered with the tomato about sixty thousand Ethiopian birr net benefit was earned. In terms of yield more than eighty boxes of the tomato was harvested from the plot by farmer Kajela Firdamo. Onion crop planted on 237 m2 plot had earned 1500 birr net benefit. The head cabbage cultivated on 598 m2 plot has earned more than 5000 birr net benefit was obtained. The head cabbage and onion crops on which the research was conducted were farmed by Mr. Asefa Debiso. The same ideology had been reflected from other participants of the FGD.
Sedimentation problem was raised from FGD. Majority of the FGD participants worried about challenges of silt deposition on crop land from the upper slope during the rainy season. Waterlogging is very common; that was why production during the rainy season was much less than the other period. The problem was getting serious due to lack of conservation works and position of the land proximity to the lake. Others said that the problem was being managed using runoff diversion works done into the lake and planted Enset across the structure. The FGD members were discussed on whether soil erosion occurs from the irrigated land into the lake. As I had observed during on field data collection the irrigated land and shore of the lake has no buffer zone. Tillage was up to mouth of the lake. They said that “our irrigation water application was based on CWR.” It means that we observe color or appearance of crop leaf and hand testing of soil moisture. Again irrigation water was being applied beyond rim of the furrow. Since irrigation water pumping was by use of benzene no over watering; while the furrow saturated by water inflow gets the cutoff. No runoff or no soil erosion due to irrigation from irrigated land into the lake. These were very common practice in the scheme across all irrigators.
FGD members have been questioned if the irrigation scheme has negative effect on lake water quality and quantity. Yes of course farmers’ had heard something from the training made by NGO and all irrigators had been applying chemicals to control pests and diseases intensively. The over land flow happening at the rainy season erodes or washes out the top soils’ with chemicals’ into the lake. This can affect quality of the water and biota in the lake. Irrigation water pumping gets intensive during the dry period which dominates time of rainfall prevalence. Dry periods and short and long dry spells occurring in between rainy season demands water supply. During the whole of such periods irrigation water pumping was intensively needed. This was the other negative impact of irrigation practice on the lake water quantity. The FGD participants had asked whether fallowing run-through was exercised between crop productions per season/year. Following two terms of crop production fallowing stayed only for one to two months. We know that the practice had tangible benefit towards maximizing soil fertility through natural soil self-modification in physicochemical properties. It contributes positively for productivity enhancement. But no further fallowing due to high demand for food as influenced by population pressure. Finally, the FGD members were questioned regarding futurity of the irrigation scheme in use whether they need to modify or change water application method to that save water more. As to irrigators the NGO named as CCA has a plan to change the existed furrow scheme into drip irrigation and water sources into well. We informed that about 500,000 birr is allocated for the sector. If the planned project is implemented lake water pumping will be replaced by underground water exploration. Therefore, both quality and quantity of Lake Hawassa water will be enhanced, and biota gets sustained for the next generation in good and safety way. If not we will continue lake water pumping and applying water by furrow method as usual. That was why our capacity never afforded the cost of drip irrigation system implementation.

4. Conclusions and Recommendations

The irrigated land and the lake were fussed; no buffer zone between the two. Tomato, head cabbage and onion were the main vegetables produced under supplemental irrigation by furrow method of water application. The irrigation water distribution method in use with the soil textures has allowed large percolation loss. Lake Hawassa water was over pumped than required (about three-fold of the required water) due to irrigation; contributing for lake capacity reduction especially during the dry period of the year. Lack of Lake buffer zone and prevalence of chemical application and sediment carried on during the rainy season resulted in further lake water quality deterioration. The smallholder farmers’ of the study area was strongly dependent on lake water due to challenges of life/poverty. To save the lake water from deterioration the irrigation water sources should be replaced by harvested water or/and well water. If not, the mode of water application needs to be modified into drip irrigation. The government body and NGOs should capacitate the smallholder farmers’ about problems of irrigation on the lake and provide all the necessary support which sustains Lake Hawassa water from deterioration.

Ethical Statement

I testify that my article submitted to applied water science entitled “Water Use Efficiency of Smallholder Farmers’ Irrigation Scheme and Its Consequences on Lake Hawassa.”
Author:
1) this material has not been published in the whole or in part elsewhere;
2) the manuscript is not currently being considered for publication in another journal;
3) I have been personally and actively involved in substantive work leading to the manuscript and will hold myself individually responsible for content.
Date: 05/12/2019

References

[1]  Alemayehu, T., Furi, W., Legesse, D., 2007. Impact of water overexploitation on highland lakes of eastern Ethiopia. Environ Geol 8.
[2]  Ali, M.H., 2011. Practices of irrigation & on-farm water management. Springer, New York.
[3]  Allen, R.G., Jensen, M.E., Wright, J.L., and Burman, R.D. 1989. Operational estimates of reference evapotranspiration. Agron. J. 81:650-662.
[4]  Brady NC, Weil RR (2002) The nature and properties of soils, 13th edn. Prentice-Hall, Upper Saddle River.
[5]  FAO, 1977. Guidelines for designing and evaluating surface irrigation systems. FAO Corporate Document Repository, Natural Resource Management and Environmental Department, Rome.
[6]  FAO, 1989. Irrigation scheduling. Irrigation water management. Training manual no. 4. FAO, Rome.
[7]  FAO, 2006. Crop Evapotranspiration (guidelines for computing crop water requirements). FAO irrigation and drainage paper no. 56.
[8]  Gebrehiwot, K.A., Gebrewahid, M.G., 2016. The Need for Agricultural Water Management in Sub-Saharan Africa. JWARP 08, 835–843. https://doi.org/10.4236/jwarp.2016.89068.
[9]  Gebremariam, H.L., Welde, K., Kahsay, K.D., 2018. Optimizing yield and water use efficiency of furrow-irrigated potato under different depth of irrigation water levels. Sustain. Water Resour. Manag. 4, 1043–1049. https://doi.org/10.1007/s40899-018-0238-4.
[10]  Golzardi, F., Baghdadi, A., Afshar, R.K., 2017. Alternate furrow irrigation affects yield and water-use efficiency of maize under deficit irrigation 9.
[11]  Halcrow, G., 2010. Rift valley lakes basin integrated resources development plan study project. Lake Hawassa sub-basin integrated watershed management feasibility study. Main report Volume 1.
[12]  Hamdy, A., 2007. Water use efficiency in irrigated agriculture: an analytical review 12.
[13]  Horst MG, Shamutalov SS, Pereira LS*, Goncalves JM (2005) Field assessment of the water saving potential with furrow irrigation in Fergana, Aral Sea basin. Agric Water Manag 77:210–231.
[14]  Howell, T.A., 2001. Enhancing water use efficiency in irrigated agriculture. Agronomic journal Vol. 93, No. 2.
[15]  Hunde, NF, 2017. Opportunity, Problems and Production Status of Vegetables in Ethiopia: A Review. J Plant Sci Res. 2017; 4(2): 172.
[16]  Jensen, M.E., Burman, R.D., and Allen, R.G. (ed). 1990. Evapotranspiration and Irrigation WaterRequirements. ASCE Manuals and Reports on Engineering Practices No. 70., Am. Soc. Civil Engrs., New York, NY, 360 p.
[17]  Kamara, C. S. and Haque, I. (1991). Soil physical manual. Working Document No.B-12. Soil Science and Plant Nutrition Section: International Livestock Center for Africa. Addis Ababa, Ethiopia.
[18]  Seckler, D., 1996. The new era of water resources management from dry to wet water savings. IIMI Res. Rep. 5. Int. Irrig. Mange. Inst., Columbo, Sri Lanka.
[19]  Taddesse G, and Peden D (2001). Efective management of water and livestock resources for community based irrigation in Addis Ababa, Ethiopia
[20]  Teshome, Y., Biazin, B., Wolka, K., Burka, A., 2018. Evaluating performance of traditional surface irrigation techniques in Cheleleka watershed in Central Rift Valley, Ethiopia. Appl Water Sci 8, 219. https://doi.org/10.1007/s13201-018-0862-z.
[21]  Walker, W.R. (2003). SIRMOD III: Surface irrigation simulation, evaluation and design. Guide and Technical Documentation. Utah State University, USA.
[22]  Wallace, J. S. and Batchelor, C. H. (1997) Managing water resources for crop production. Philosophical Transactions of the Royal Society of London. 352:937-947.
[23]  Worako, A.W., 2015. Evaluation of the water quality status of Lake Hawassa by using water quality index, Southern Ethiopia 8.