-
Paper Information
- Paper Submission
-
Journal Information
- About This Journal
- Editorial Board
- Current Issue
- Archive
- Author Guidelines
- Contact Us
International Journal of Agriculture and Forestry
p-ISSN: 2165-882X e-ISSN: 2165-8846
2019; 9(1): 1-15
doi:10.5923/j.ijaf.20190901.01

Determinants of Choice, Number and Simultaneous Adoption of Sustainable Land Management Practices in Eastern Africa
 Abstract
 Reference
 Full-Text PDF
 Full-text HTML
Oliver K. Kirui, Alisher Mirzabaev
Center for Development Research, University of Bonn, Germany
Correspondence to: Oliver K. Kirui, Center for Development Research, University of Bonn, Germany.
| Email: |  |
Copyright © 2019 The Author(s). Published by Scientific & Academic Publishing.
This work is licensed under the Creative Commons Attribution International License (CC BY).
http://creativecommons.org/licenses/by/4.0/

This paper assesses the determinants of choice, number and simultaneous adoption of sustainable land management (SLM) in three Eastern African countries (Ethiopia, Malawi and Tanzania). The analysis of nationally representative household surveys shows that the key drivers of SLM in these countries are biophysical, demographic, regional and socio-economic determinants. Secure land tenure, access to extension services and market access are some of the determinants incentivizing SLM adoption. The implications of this study are that policies and strategies that facilities secure land tenure and access to SLM information are likely to incentivize investments in SLM. Local institutions providing credit services, inputs such as seed and fertilizers, and extension services must also not be ignored in the development policies.
Keywords: Adoption, Land Degradation, Sustainable Land Management, Poisson Regression
Cite this paper: Oliver K. Kirui, Alisher Mirzabaev, Determinants of Choice, Number and Simultaneous Adoption of Sustainable Land Management Practices in Eastern Africa, International Journal of Agriculture and Forestry, Vol. 9 No. 1, 2019, pp. 1-15. doi: 10.5923/j.ijaf.20190901.01.
Article Outline
1. Introduction
- Land degradation is an extensive and serious impediment to improving rural livelihoods and food security of millions of people in the eastern Africa. Recent estimates show that land degradation affected about 51%, 41%, 23% and 22% of the terrestrial areas in Tanzania, Malawi, Ethiopia and Kenya respectively [1]. Addressing land degradation through the formulation of proper strategies and effective policies requires first the identification of both the proximate (direct) and underlying (indirect) causes [2-4]. In Tanzania, land degradation has been ranked as the top environmental problem for more than 60 years [5]. Soil erosion is considered to have occurred on 61% of the entire land area in this country [5]. Chemical land degradation, including soil pollution and salinization/alkalinisation, has led to 15% loss in the arable land in Malawi in the last decade alone [6]. The adoption and investment in sustainable land management is crucial in reversing and controlling land degradation, rehabilitating degraded lands and ensuring the optimal use of land resources for the benefit of present and future generations [7, 8].SLM, also referred to as ‘ecosystem approach’, ensures long-term conservation of the productive capacity of lands and the sustainable use of natural ecosystems. Sustainable land management is important for sustainable development because it facilitates land users to maximize the benefits from their land while maintaining the ecological support functions of the land resources [9]. The efforts directed at addressing the causes of land degradation or addressing the constraints to SLM adoption, however, have been largely insufficient. Recent reliable estimates show that the adoption of sustainable land management practices in sub-Saharan Africa is very low – about 3% of total cropland [10].Several studies have been carried out to document significant determinants and constraints to adoption of SLM in eastern Africa, however, a number of limitations that should be fulfilled in next research are evident. These studies either focuses on some specific location(s) in the region (such as, [11] in Kenya, [12] in Malawi, [13-15] in Ethiopia) are considered subjective and lacking in scientific rigor and/or have weak explanatory power due to small sample size. The results from different studies are often contradictory regarding any given variable [16]. The current assessment is unique in that; it uses nationally representative data (at farm level) with diverse variables (both proximate and underlying) and that it includes socio-economic and behavioral factors. These include a mix of biophysical, demographic, socio-economic, and institutional variables.Despite on-going land degradation and the urgent need for action to prevent and reverse land degradation, the problem has yet to be appropriately addressed, especially in the developing countries, including in Eastern Africa. Adequately strong policy action for SLM is lacking, and a coherent and evidence-based policy framework for action is missing [17]. Identifying the determinants of SLM adoption is a step towards addressing them [3]. The assessment of relevant drivers of land degradation by robust techniques at farm level is still lacking. There is an urgent need for evidence-based economic evaluations, using more data and robust economic tools, to identify the determinants of adoption as well as economic returns from SLM. The objectives of this paper are thus three-fold; i) to assess the determinants of SLM adoption in Eastern Africa, ii) to examine the determinants of number of SLM technologies adopted, and iii) to assess the determinants of simultaneous adoption of SLM technologies in Eastern Africa.It is particularly important to study the diverse social–ecological context within a national or international scale. It further addresses and control for the diverse contexts such as regional and agro-ecological zonation to capture a wide spectrum of heterogeneous contexts in the three Eastern Africa countries. The approached used in the current study also account for the non-linear relationship between the drivers of land degradation and determinants of SLM. This approach could lead to innovative and comprehensive assessment of both causes of land degradation and SLM use and thus a better targeting of policy measures for combating land degradation and facilitating SLM uptake across different contexts. The rest of this paper is organized as follows: section two provides a brief review of key studies on extent on the determinants of SLM adoption in Eastern Africa; section three presents the study methods and the empirical strategy; Section four outlines the data, study area and sampling procedure; section five discusses the findings of the study; section six concludes.
2. Relevant Literature
- Empirical review of literature on adoption of production related technologies dates back to Feder et al., [18] which summarizes that the adoption of new technology may be constrained by many factors such as lack of credit, inadequate and unstable supply of complementary inputs, uncertainty and risks. A comprehensive review of literature shows several factors determining investment in sustainable land management practices. These include; household and farm characteristics, technology attributes, perception of land degradation problem, profitability of the technology/practice, institutional factors, such as, land tenure, access to credit, information and markets and risks and uncertainty [19-30]. Detailed empirical studies in developing countries include that of Pagiola [11] in Kenya in Malawi, Shiferaw and Holden [13], Gebremedhin and Swinton [14], and Bekele and Drake [15] in Ethiopia. All these studies highlighted the direction as well as the magnitude of factors hypothesized to condition the adoption of SLM. Some of the significant factors facilitating the adoption of sustainable land management include; access to information (education and extension), access to both input and output markets, social, human and physical capital endowments, credit availability, profitability of the management technology, and property rights. The adoption of sustainable land management is also influenced by lack of local-level capacities, knowledge gaps on specific land degradation and SLM issues, inadequate monitoring and evaluation of land degradation and its impacts, inappropriate incentive structure (such as, inappropriate land tenure and user rights), inaccessible market and infrastructure constraints (such as, insecure prices of agricultural products, increasing input costs, inaccessible markets), and policy and institutional bottlenecks (such as, difficulty and costly enforcement of existing laws that favor SLM) and risks [31, 32, 7, 8, 33]. In summary, these factors are largely area specific and their importance is varied between and within agro-ecological zones and across countries. Thus, caution should be exercised in attempting to generalize such individual constraints across regions and countries.Important contributions have been made by these previous studies on identifying the determinants of adoption of SLM practices, however, a number of limitations are evident. Despite the fact that a long list of explanatory variables is used, most of the statistical models developed by these studies have low levels of explanatory power [16]. The results from different studies are often contradictory regarding any given variable ([16]. Lindner [34] and Ghadim et al., [35] point out that the inconsistency results in most empirical studies could be explained by four shortcomings, namely; failure to account for the importance of the dynamic learning process in adoption, biases from omitted variables, poorly specified models and failure to relate hypotheses to sound conceptual framework. Adoption studies using dichotomous adoption decisions models have inherent weakness [36]. The single stage decision making process characterized by a dichotomous adoption decision models is a direct consequence of the full information assumption entrenched in the definition of adoption, that is, individual adoption is defined as the degree of use of a new technology in the long run equilibrium when the farmer has full information about the new technology and its potential. This assumption of full information is usually violated and hence use of logit or probit models in modeling adoption decision may lead to model misspecification. Recent studies have tried to overcome these limitations in different ways: model adoption sequentially [37], include farmers’ personal perceptions, abilities and capabilities and risk preferences to capture the dynamic learning process [16], use of stochastic production function to capture importance of risk effects of factors inputs on production behavior [38], use a partial observability model to capture the varied access to information and levels of awareness of the new technology [36], use of a double hurdle model to capture the sequential decisions and multiple stages in investing in SLM [14] and determinants of adoption and intensity of adoption of SLM may be different, hence use a tobit model rather than probit or logit [39].
3. Empirical Strategy
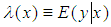
3.1. Determinants of SLM Adoption
- The adoption of SLM technologies/practices in this study refers to the use of one or more SLM technologies in a given plot. The adoption of SLM technology/practice in a farm plot was measured as a binary dummy variable (1= adopted SLM in a farm plot, 0 = otherwise). The two appropriate approaches to estimate such binary dummy dependent variable regression models are the logit and the probit regression models. The logit and probit models guarantee that the estimated probabilities lie between the logical limit of 0 and 1 [40]. Both probit and logit models are quite similar [41]. They generate predicted probabilities that are almost identical. The main difference between the two is in the nature of their distribution which is captured by Cumulative Distribution Function (CDF); probit has a normal distribution while logit has a logistic distribution. The choice of probit versus logit regression depends, therefore, largely on the distribution assumption one makes. Logit is however preferred because of its comparative mathematical simplicity. Sirak and Rice [49] argues that logistic regression is powerful, convenient and flexible and is often chosen if the predictor variables are a mix of continuous and categorical variables and/or if they are not normally distributed. Some of the predictor variables in this study objective categorical and therefore this study used logit model to examine the drivers of SLM adoption. The reduced form of the logit model applied to nationally representative agricultural household survey data from Ethiopia, Tanzania and Malawi is presented as:
 | (1) |
 is the error term. Adoption studies using dichotomous adoption decisions models have inherent weakness [36]. The single stage decision making process characterized by a dichotomous adoption decision models is a direct consequence of the full information assumption entrenched in the definition of adoption, that is, individual adoption is defined as the degree of use of a new technology in the long run equilibrium when the farmer has full information about the new technology and its potential. This assumption of full information is usually violated and hence use of logit or probit models in modeling adoption decision may lead to model misspecification. Robust tests carried out to check these misspecifications. Further, assessment beyond adoption to intensity (number) of SLM adoption can also counter such inherent weakness. We explore this option in our study.
 3.2. Determinants of Number of SLM Technologies Adopted: Poisson Regression Model
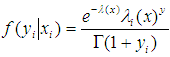
- This model aims at analyzing the determinants of the number of SLM technologies adopted or applied in the same plot simultaneously. The number of SLM technologies is a count variable (ranging from 0 to 6 in this study). Thus, the assessment of the determinants of intensity of adoption of SLM technologies requires models that account for count variables. Poisson regression model (PRM) is normally the first step for most count data analyses [43]. PRM assumes that the dependent variable y given vector of predictor variables x has a Poisson distribution. The probability density function of y given x is completely determined by the conditional mean;
 | (2) |
 | (3) |
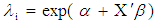
 PRM specifies that each observation yi is drawn from a Poisson distribution with parameter λi which is related to a ray of predictor variables
  [44]. The PRM is derived from the Poisson distribution by introducing parameters into the relationship between the mean parameter λi and predictor variables x. Wooldridge [40] and Greene [44] show that the expected number of events, yi, (number of SLM technologies) is given as:
 | (4) |
 and its equi-dispersion assumptions
  are the main features of Poisson regression model [44]. Thus, the reduced form of the PRM applied to nationally representative agricultural household survey data from Ethiopia, Tanzania and Malawi is presented as:
  | (5) |
 is the error term. PRM is preferred because it takes into account the non-negative and discrete nature of the data [45]. The assumption of equality of the variance and conditional mean in PRM also accounts for the inherent heteroscedasticity and skewed distribution of nonnegative data (ibid). PRM is further preferred because the log-linear model allows for treatment of zeros [45]. Some of the limitations of PRM in empirical work relates to the restrictions imposed by the model on the conditional mean and the variance of the dependent variable. This violation leads to under-dispersion or over-dispersion. Over-dispersion refers to excess variation when the systematic structure of the model is correct [46]. Over-dispersion means that the variance of the coefficient estimates are larger than anticipated mean – which results in inefficient, potentially biased parameter estimates and spuriously small standard errors [47]. Under-dispersion on the other hand refers to a situation in which the variance of the dependent is less than its conditional mean. In presence of under- or over-dispersion, though still consistent, the estimates of the PRM are inefficient and biased and may lead to misleading inference [48, 44]. Our tests showed no evidence of under- or over-dispersion. Moreover, the conditional mean of the distribution of SLM technologies was similar to the conditional variance. Thus, PRM was appropriately applied.
 4. Data and Sampling Procedure
- The data used for this study is based on household surveys in three countries - Ethiopia, Malawi and Tanzania, conducted over different time periods. The surveys were supported by the Living Standards Measurement Study - Integrated Surveys on Agriculture (LSMS-ISA) project undertaken by the Development Research Group at the World Bank. The project aims to support governments in seven Sub-Saharan African countries to generate nationally representative, household panel data with a strong focus on agriculture and rural development. The surveys under the LSMS-ISA project are modelled on the multi-topic integrated household survey design of the LSMS; household, agriculture, and community questionnaires, are each an integral part of every survey effort. We describe the sampling procedure in each of the three countries below.
4.1. Ethiopia
- The Ethiopia Rural Socioeconomic Survey (ERSS) data was collected during the period October 2011- March 2012 by the Central Statistical Agency (CSA). The ERSS sample is designed to be representative of rural and small town areas of Ethiopia. Based on population estimates from the 2007 Population Census, the CSA categorizes a town with a population of less than 10,000 as small. The ERSS rural sample is a sub-sample of the Annual Agricultural Sample Survey (AgSS), while the small town sample comes from the universe of small town Enumeration Areas (EAs). The sample is a two-stage probability sample. The first stage of sampling entailed selecting primary sampling units – the CSA’s enumeration areas (EAs). For the rural sample, 290 enumeration areas were selected from the AgSS enumeration areas based on probability proportional to size of the total enumeration areas in each region. For small town EAs, a total of 43 EAs were selected. The second stage involved random selection of households to be interviewed in each EAs. For rural EAs, a total of 12 households were sampled in each EA. Of these, 10 households were randomly selected from the sample of 30 AgSS households. The AgSS households are households which are involved in farming or livestock activities. Another 2 households were randomly selected from all other households in the rural EA (those not involved in agriculture or livestock). In some EAs, there is only one or no such households, in which case, less than two non-agricultural households were surveyed, and more agricultural households were interviewed instead, so that the total number of households per EA remains the same. Households were not selected using replacement. The sample covers a total of 3,969 households (and 24,954 farm plots).
4.2. Malawi
- The Malawi 2010-2011 Integrated Household Survey (IHS) is a national-wide survey collected during the period March 2010- March 2011 by the national Statistics Office [49]. The sampling frame for the IHS is based on the listing information from the 2008 Malawi Population and Housing Census. The targeted universe for the IHS survey included individual households and persons living in those households within all the districts of Malawi except for Likoma and the people living in institutions such as hospitals, prisons and military barracks. The IHS followed a stratified two-stage sample design. The first stage involved selection of the primary sampling units (PSUs) following proportionate to size sampling procedure. These include the census enumerations areas (EAs) defined for the 2008 Malawi Population and Housing Census. An enumerations area was the smallest operational area established for the census with well-defined boundaries and with an average of about 235 households. A total of 768 EAs (average of 24 EAs in each of the 31 districts) were selected across the country. In the second stage, 16 households were randomly selected for interviews in each EA. In total 12,271 households (18,329 farming plots) were interviewed.
4.3. Tanzania
- The 2010-2011 Tanzania National Panel Survey (TNPS) data was collected during twelve-month period from September 2010 - September 2011 by the Tanzania National Bureau of Statistics [50]. In order to produce nationally representative statistics, the TNPS is based on a stratified multi-stage cluster sample design. The sampling frame the National Master Sample Frame (from the 2002 Population and Housing Census), which is a list of all populated enumeration areas in the country. In this first stage stratification was done along two dimensions: (i) eight administrative zones (seven on Mainland Tanzania plus Zanzibar as an eighth zone), and (ii) rural versus urban clusters within each administrative zone. The combination of these two dimensions yields 16 strata. Within each stratum, clusters were then randomly selected as the primary sampling units, with the probability of selection proportional to their population size. In rural areas a cluster was defined as an entire village while in urban areas a cluster was defined as a census enumeration area (from the 2002 Population and Housing Census). In the last stage, 8 households were randomly chosen in each cluster. Overall, 409 clusters and 3,924 households (6,038 farm plots) were selected. Figure 1 presents the distribution of sampled households in the three countries.
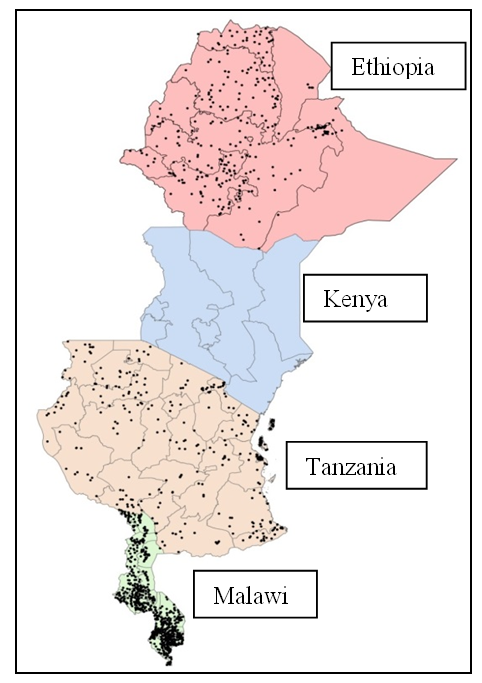 | Figure 1. Distribution of sampled households (Source: Author’s Compilation) |
5. Results
- The data used for this study is based on household surveys in three countries – Ethiopia, Malawi and Tanzania, conducted over different time periods. The surveys were supported by the Living Standards Measurement Study - Integrated Surveys on Agriculture (LSMS-ISA) project undertaken by the World Bank.
5.1. Descriptive Statistics of Variables Used in the Econometric Estimations
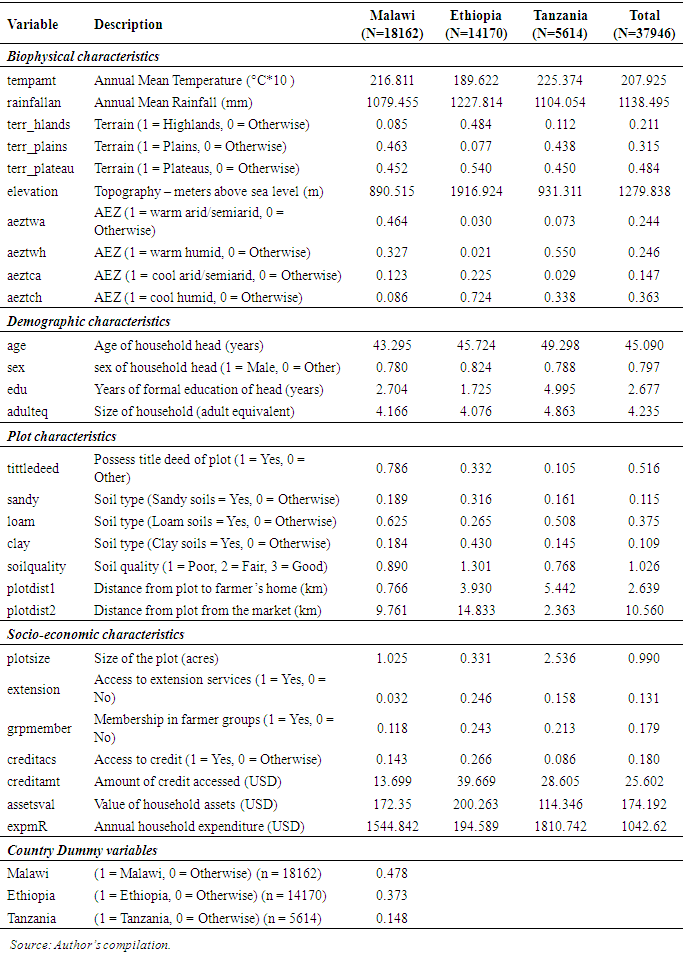
- We discuss the results of the descriptive analysis on this section. Table 1 presents the results of the mean and standard deviation of all the independent variables used in the regression models. Results show substantial differences in the mean values of the biophysical, demographic, plot-level, and socioeconomic characteristics by country. Among the biophysical characteristics, notable differences can be noted in such variables as mean annual rainfall, topography (elevation) and agro-ecological classification.
|
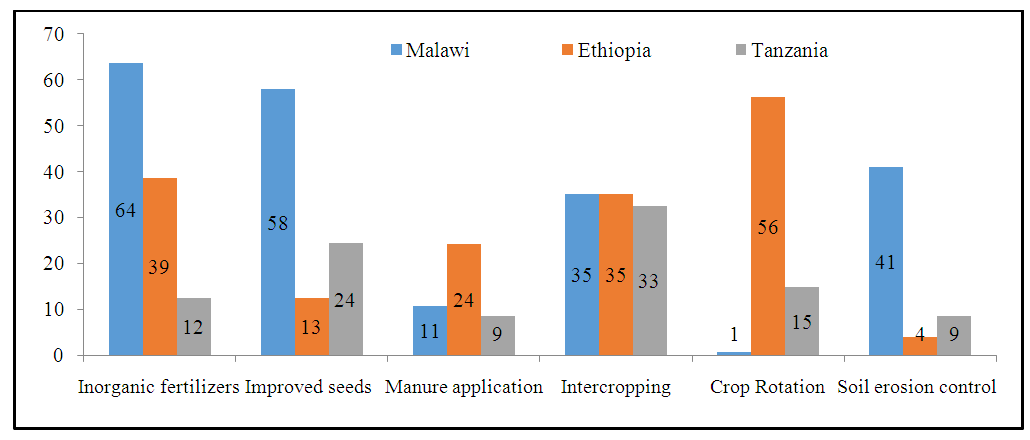 | Figure 2. The distribution of different SLM technologies adopted in Eastern Africa (Source: Author’s compilation) |
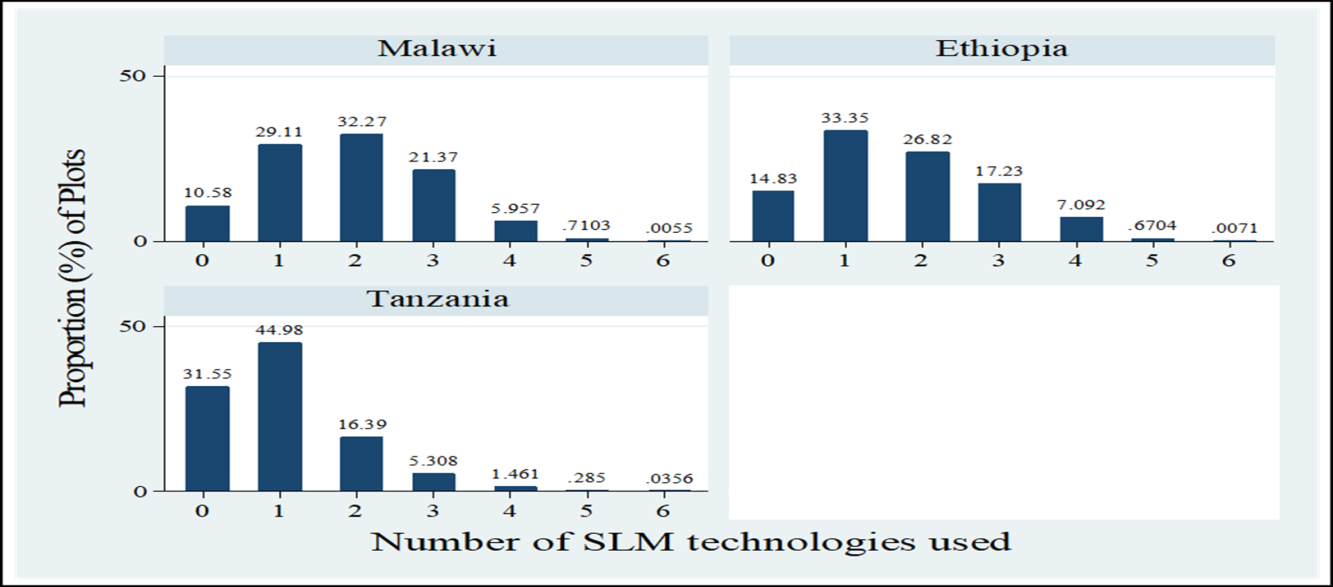 | Figure 3. The distribution of number of SLM technologies adopted (Source: Author’s compilation) |
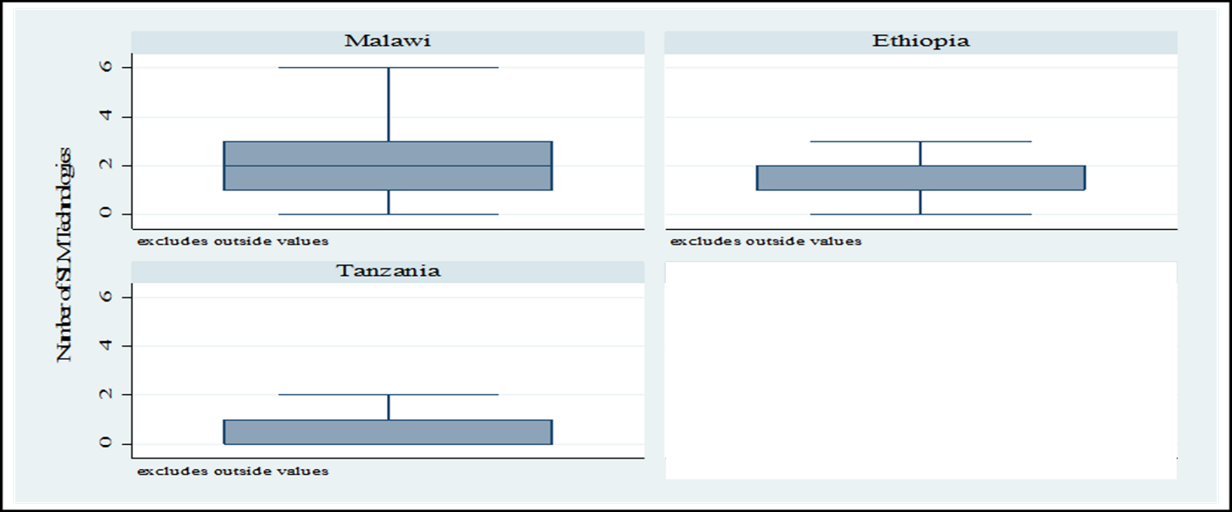 | Figure 4. The mean number of SLM technologies adopted (Source: Author’s compilation) |
5.2. Determinants of SLM Adoption: Logit Regression Model Estimations
- The results of the logit regression models on the determinants of adoption of SLM technologies are presented in Table 2. An adopter was defined as an individual using at least one SLM technology. The assessment was carried out using plot level data. The logit models fit the data well (Table 2). All the F-test showed that the models were statistically significant at the 1% level. The Wald tests of the hypothesis that all regression coefficients in are jointly equal to zero were rejected in all the equations at 1 percent confidence level.
|
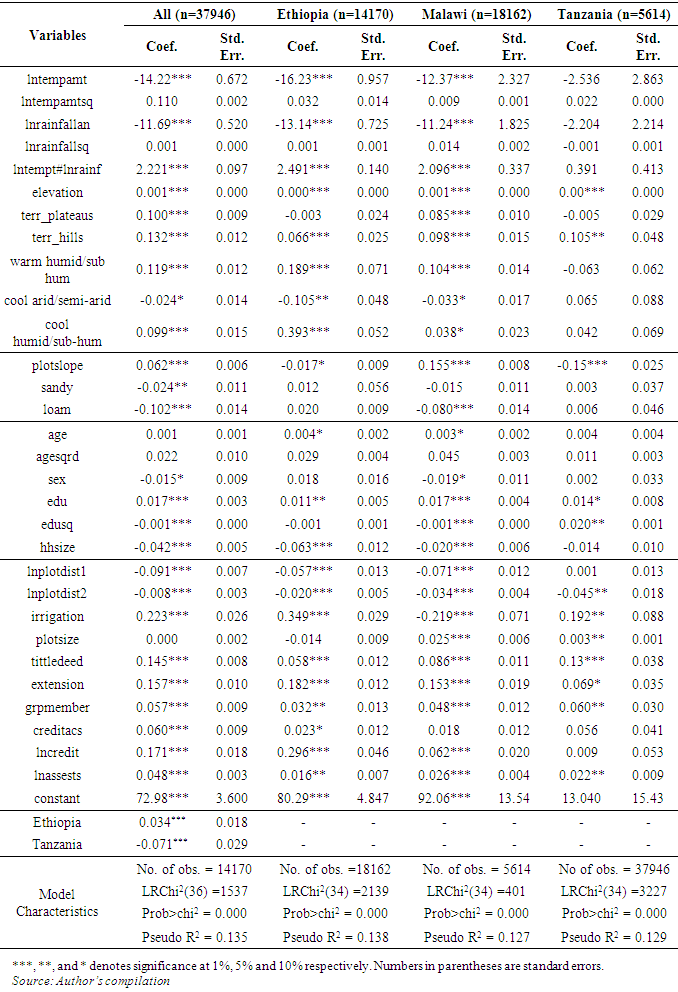
5.3. Determinants of Number of SLM Technologies Adopted: Poisson Regression Results
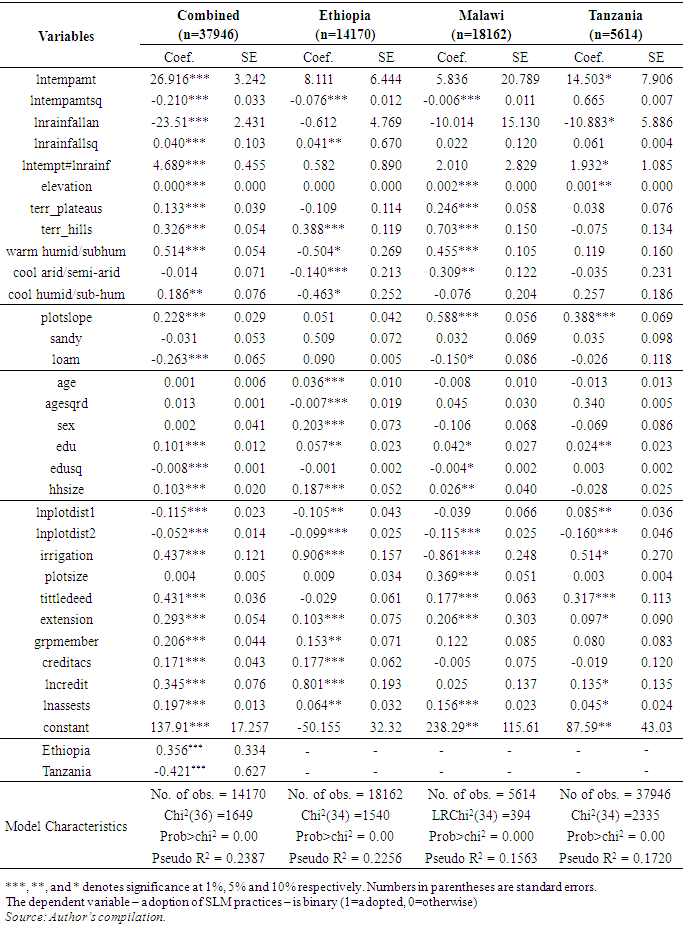
- The results of the Poisson regression on the determinants of the number of SLM technologies used per plot are presented in Table 3. The assessment is done at plot level in each of the case study countries and a combined model is also estimated for all the three countries. The Poisson estimations fit the data well. All the models are statistically significant at 1 percent. There was no evidence of dispersion (over-dispersion and under-dispersion). The corresponding negative binomial regressions were estimated, however, all the likelihood ratio tests (comparing the negative binomial model to the Poisson model) were not statistically significant – suggesting that the Poisson model was best fit for this study. The results (marginal effects) suggest that biophysical, demographic, plot-level, and socioeconomic characteristics significantly influence the number of SLM technologies adopted (Table 3). The relationships between these factors and the number of SLM technologies adopted are however mixed across the countries. Significant factors for each country and the combined model are discussed in the subsequent section.
|
6. Conclusions and Policy Implications
- Land degradation is increasingly becoming an important subject due to the increasing number of causes as well as its effects. This chapter utilizes nationally representative household surveys in three eastern Africa countries (Ethiopia, Malawi and Tanzania) to assess the determinants of adoption and extent of adoption SLM technologies. The adoption of sustainable land management practices as well as the number of SLM technologies adopted is critical in addressing land degradation in Eastern Africa. To ensure rigor, three approaches are used to assess the determinants of SLM adoption. First, a logistic regression is used to assess the probability of adopting SLM technologies, a Poisson regression model to assess the number of SLM technologies adopted, and a multivariate probit model to assess the simultaneous adoption of different SLM technologies. Adoption and the number of SLM technologies adopted is determined by a series of factors; biophysical, socio-economic and demographic and plot characteristics. The key proximate biophysical factors influencing the adoption of SLM practices include rainfall, temperature, elevation and the agro-ecological characteristics. Among the relevant demographic and socio-economic factors include age and education level of the household head, family size, land size, membership in farmer cooperatives and savings and credit cooperatives, land tenure, access to credit and proximity to markets. Securing land tenure and access to relevant agricultural information pertaining SLM will play an important role in enhancing the adoption and the number of SLM adopted. This implies that policies and strategies that secure land tenure is likely to incentivize investments in SLM in the long-run since benefits accrue over time. There is need to improve the capacity of land users through education and extension as well as improve access to financial and social capital to enhance SLM uptake. Local institutions providing credit services, inputs such as seed and fertilizers, and extension services must not be ignored in the development policies. The important role of rainfall and agro-ecological classification on adoption of and number of SLM technologies adopted suggests the need for proper geographical planning and targeting of the SLM practices by stakeholders. The assessment of simultaneous adoption of SLM technologies revealed that most of the SLM technologies are complementary to each other – such as the use of improved seeds and fertilizers, use of manure and use of fertilizers.
ACKNOWLEDGEMENTS
- This research has been made possible with the financial support of the German Federal Ministry for Economic Cooperation and Development (BMZ). We thank Quang Bao Le for providing the spatial data and the World Bank for providing the LSMS data. Special thanks to all anonymous reviewers for their comments and improvements.